
This section provides an example to illustrate the use of the Generic Layout Editor to create a Generic ASCII Data Logger. The items and sub-items chosen for logging to file are only to illustrate the selection procedure. Your particular situation in the field may be similar or significantly different. It really depends on the circumstances and the client's specifications.
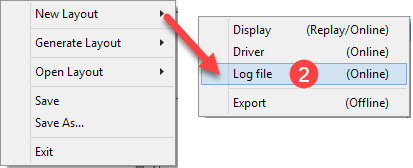
Open Layout Editor


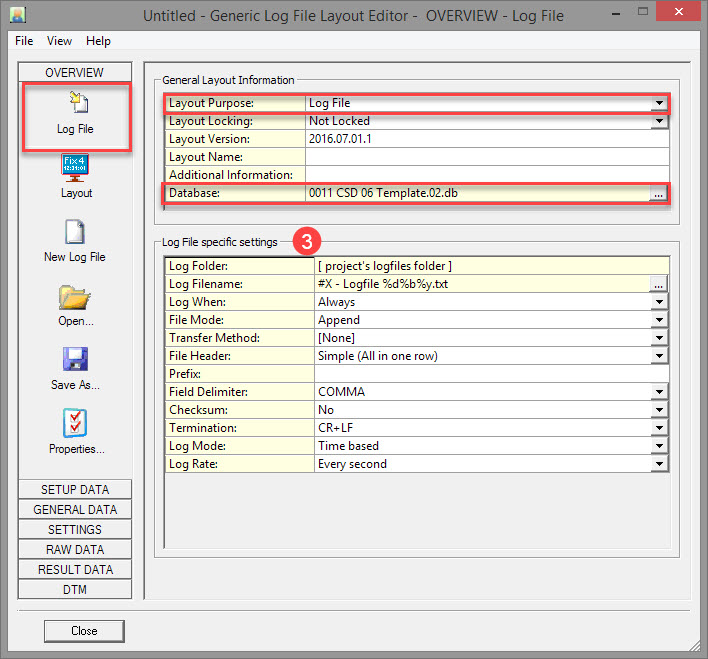
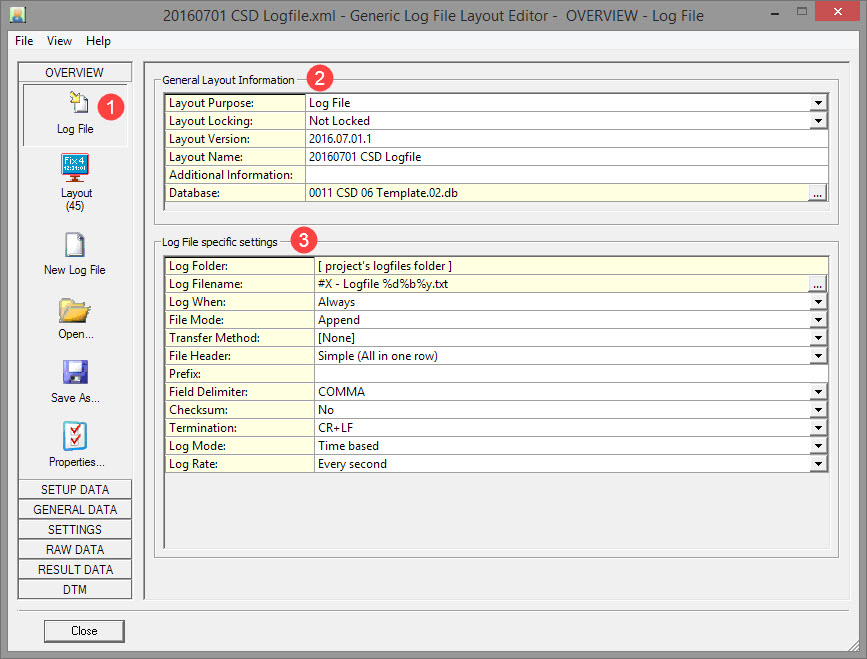
The main window defaults to the Log File button of the Overview Tab dialog.
The main window has 7 tabs on the left side, each of which references different system and observation parameters. Each tab has multiple option buttons each of which, again, references different data parameters.
Typically you work your way from the top tab to bottom tab, and from top button to bottom button, with the exception of the Overview tab when first creating the driver.
It is probably best to return to the Overview tab options after selecting items in the other main tabs: Setup Data, General Data, Settings, Raw Data, Result Data and DTM.
As with all tabs, each of these buttons has a slightly different dialog to the right. But in general they all have items to select along with their properties, sub-items and their properties.
Check that Layout Purpose is 'Log File', and that the correct Database is selected.

Refer to and to for an explanation of parameters on this page.
Return to top of page.
Setup Data Tab
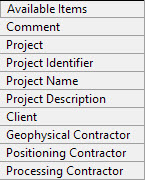
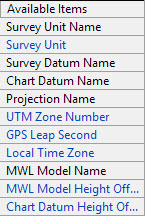
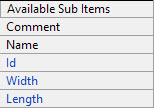
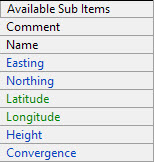
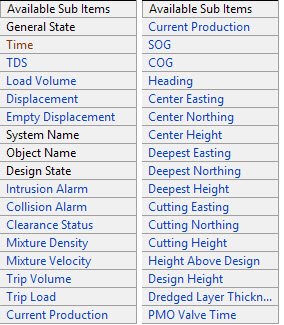
This table shows the available items for each of the buttons listed under the Setup Data tab.
Click on any of the upper row icons to access an explanation of each item, its properties, each sub-item and its properties.
|
|
|
Main Item is an Object |
Main Item is a Fixed Node |
|
|
|
|
Refer to .
Return to top of page.
Return to Cutter Suction Dredger (CSD) - System Definitions.
General Data Tab
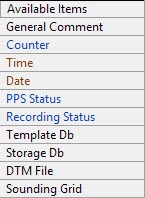
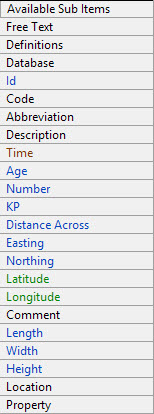
This table shows the available items for each of the buttons listed under the General Data tab.
Click on any of the upper row icons to access an explanation of each item, its properties, each sub-item and its properties.
For our example it could be necessary to output information about the sailed survey line. Other items and sub-items are unlikely to be applicable.
|
|
Main Object is a Line |
|
|
|
|
|
|
|
|
General Button

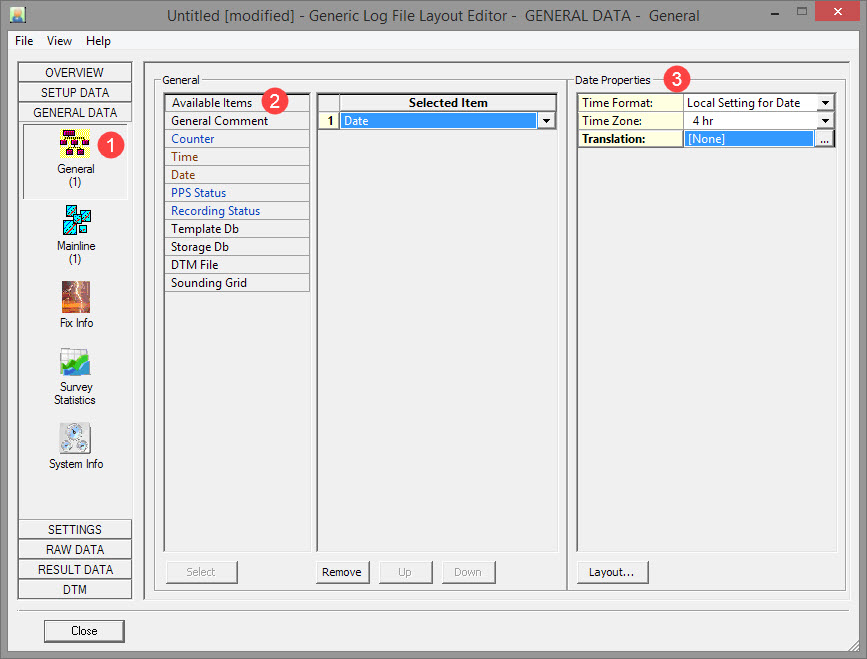


You may format a date item the same as a time item, i.e. in general, it's the current computer system time, default in UTC.
More specifically, it depends on the update mode of the display/driver/log file/export:
-
Time based
When on-line, it's the current computer time, and in case PPS is used, it will be the PPS time.
When replaying, it is the time of the last position filter calculation. -
Fix based
The time of the last fix event -
System based
The time of the last update for the selected system -
Event based (Driver and Log File only)
The time of the event -
Node based (Export only)
The time of the selected node result update
Refer to .
Return to top of page.
Return to Cutter Suction Dredger (CSD) - System Definitions.
Mainline Button
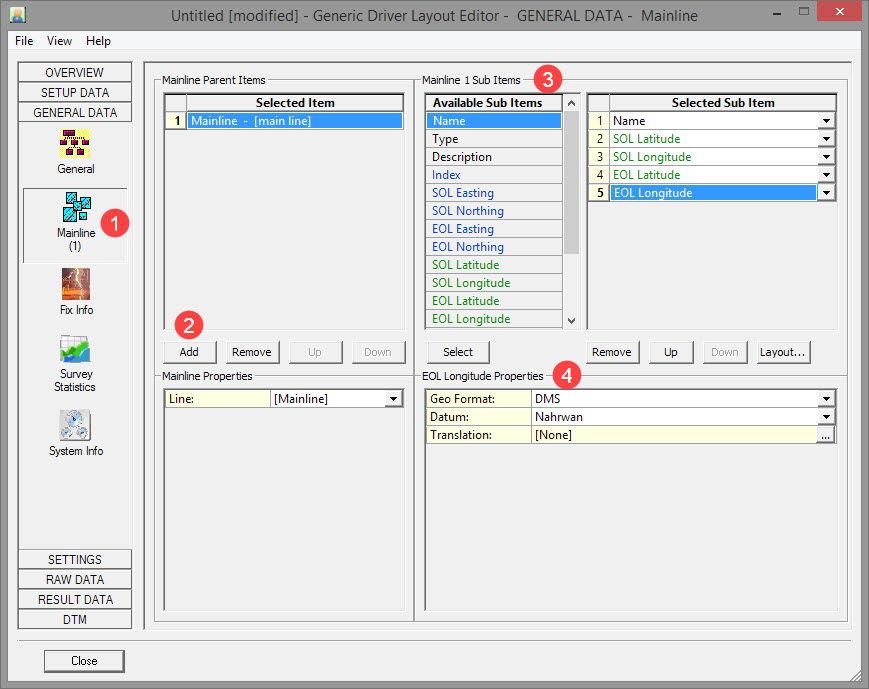
Under Properties below select the line. A list with 10 entries is given - the Mainline and nine additional lines.
The first one is always the Controller's mainline. The other 9 are the additional mainlines.
The actual mainline/additional mainline selection (POINT, LINE, ROUTE) is done in the Controller's Session Setup, Planning.

Refer to .
Return to top of page.
Return to Cutter Suction Dredger (CSD) - System Definitions.
Settings Tab
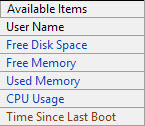
This table shows the available items for each of the buttons listed under the Settings tab.
Click on any of the upper row icons to access an explanation of each item, its properties, each sub-item and its properties.
For our example none of these items are chosen.
|
|
Refer to .
Return to top of page.
Return to Cutter Suction Dredger (CSD) - System Definitions.
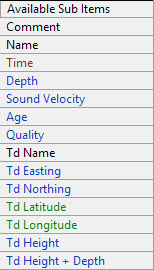
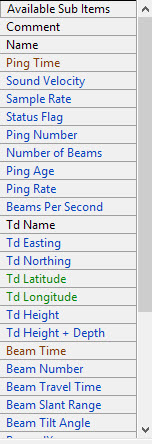
Raw Data Tab
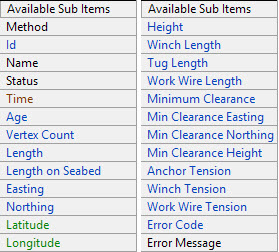
This table shows the available items for each of the buttons listed under the Raw Data tab.
Click on any of the upper row icons to access an explanation of each item, its properties, each sub-item and its properties.
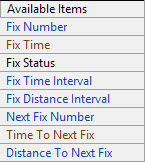
For our example several raw data items and sub-items are applicable.
|
Main Item is a
|
Main Item is a
|
Main Item is a
|
Main Item is a
|
Main Item is a
|
Main Item is a
|
Main Item is a
|
|
|
|
|
|
|
|
Gyro System Button
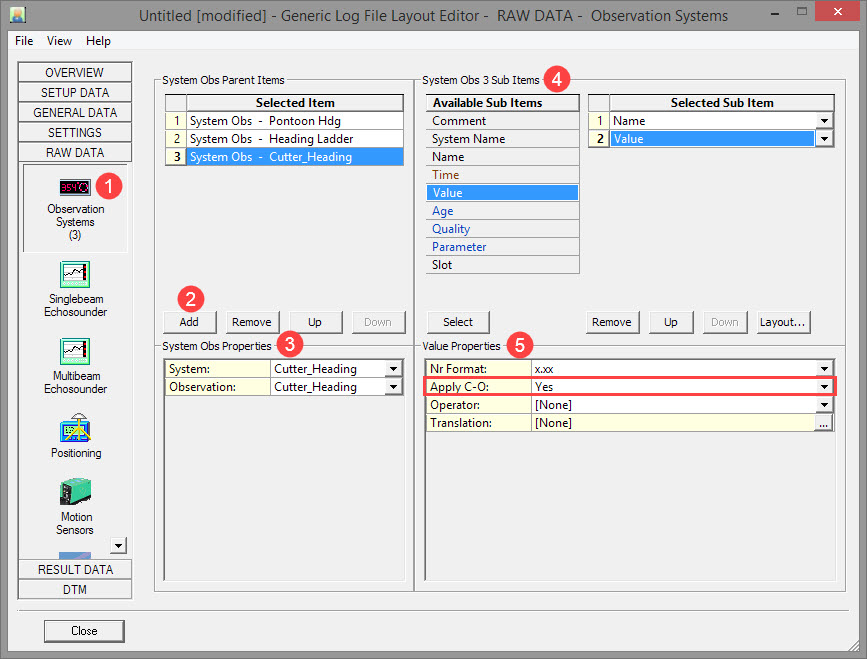
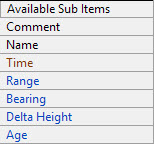
If the log file requires an identifier in order to decode the gyro observation, you could add 'Name' as another sub-item.
Use the Translation function to modify the name if a specific identifier is needed.
'Time' is another option but in this case it is preferred to use the date and time from the computed position of the vessel CoG, which is added under the Result Data tab. The software will then output a gyro value for that time.

Note that the C-O corrected raw value is sent in the log file.
Refer to .
Return to top of page.
Return to Cutter Suction Dredger (CSD) - System Definitions.
Cloned Headings
Ladder, spud and cutter headings are all the same as the pontoon heading.
These values could be needed in the data string.
In our example, the following Observation Systems are available:
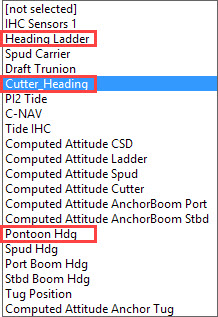
Add ladder and cutter orientations by following the same steps as detailed above for the vessel's gyro system.
Motion Sensor System Button
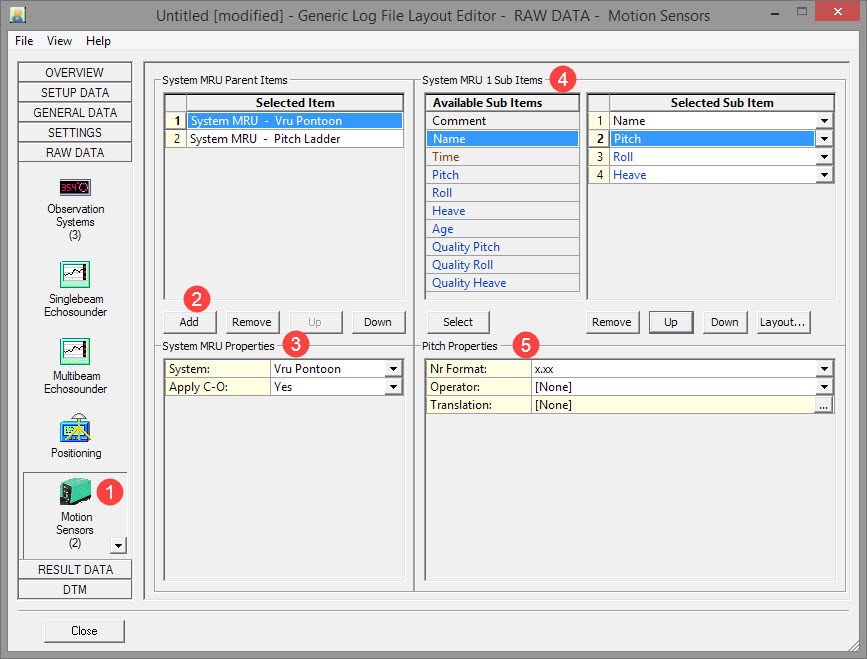
Choose to apply C-O values to the raw values so that the C-O corrected values are logged to file.
For the Ladder select 'Pitch'.
If the log file requires an identifier in order to decode the pitch and roll observations, you could add two 'Comments' as sub-items.
Enter the comment string under Properties below.
'Time' is another option but in this case it is preferred to use the date and time from the computed position of the vessel CoG, which is added under the Result Data tab. The software will then output a gyro value for that time.
Refer to .
Return to top of page.
Return to Cutter Suction Dredger (CSD) - System Definitions.
USBL Button
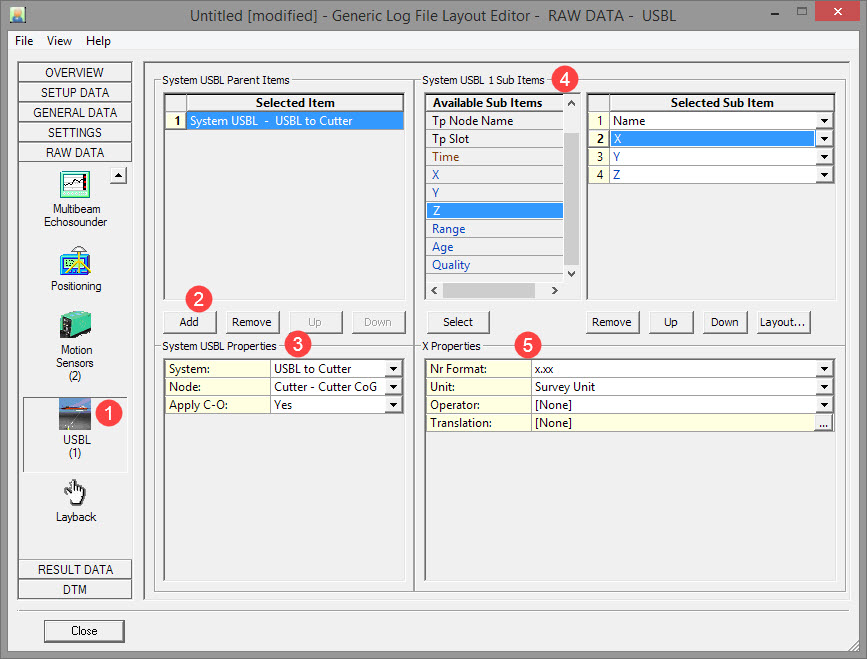
Choose to apply C-O values to the raw values so that the C-O corrected values are logged to file.
If the log file requires specific identifiers, you could add two 'Comments' as sub-items.
Enter the comment string under Properties below.
Refer to .
Return to top of page.
Return to Cutter Suction Dredger (CSD) - System Definitions.
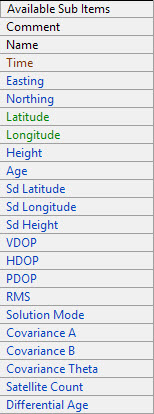
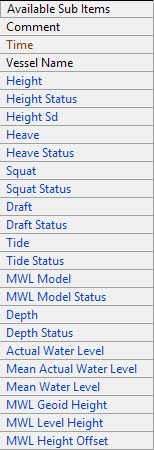
Result Data Tab
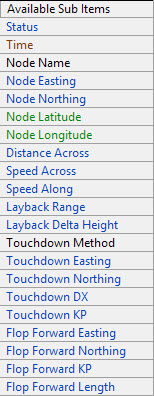
This table shows the available items for each of the buttons listed under the Result Data tab.
Click on any of the upper row icons to access an explanation of each item, its properties, each sub-item and its properties.
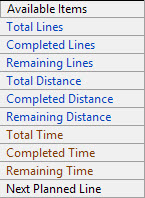
For our example several result data items and sub-items are applicable.
|
Main Item is a
|
Main Item is a Node |
Main Item is a Line |
Main Item is a Vessel |
Main Item is a Vessel |
|
|
|
|
|
|
||||
|
Main Item is an
|
Main Item is a
|
Main Item is an Anchor |
Main Item is a
|
Main Item is an
|
|
|
|
|
|
Nodes Button
Raw position is referenced to the GNSS antenna.
What is needed is the computed position of the CSD reference point (CoG), which is the reference for the pseudo-USBL measurements that position the cutter head and the carriage spud.
Therefore this node position is taken from Result Data, along with the time tag.
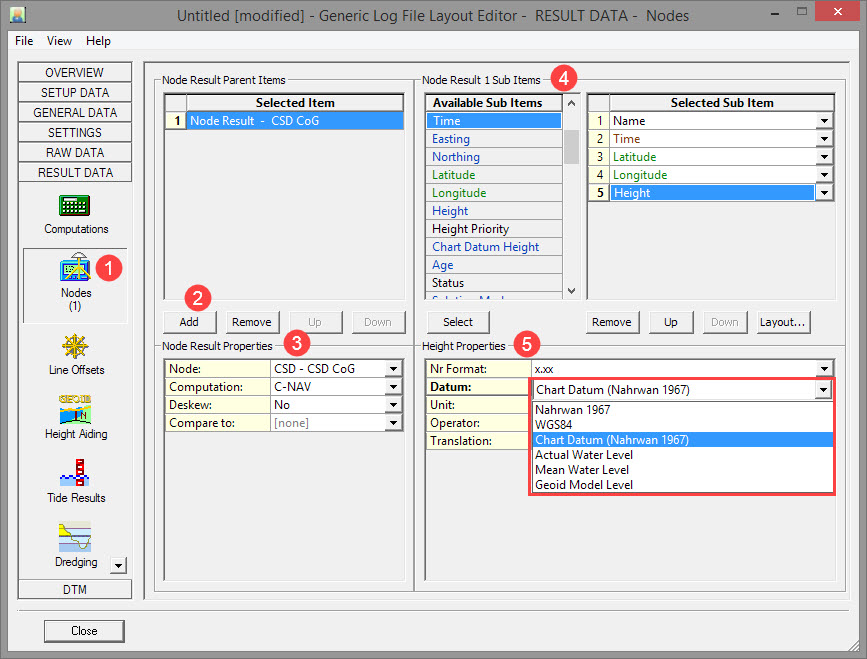
The first (default) entry is always [Steered Node]. It can be changed if the position of the steered node is not required.
In this case we want the CSD CoG.
In our example the CSD CoG is the preferred node to output to the log file.
Choose the Computation used to compute the node coordinates and choose whether to deskew the node position:
-
No
Node Position and Time as calculated by the PositionFilter -
Yes
Skewed linear to the time of output/trigger time, using the current Node Position (Horizontal), Time, SOG and COG.
Notice that the SOG and COG depends on the Controller's Computation Setup, Object COG/SOG - Prediction Parameters Settings.
Formula used:-
Delta Easting = SOG * Delta Time * SIN(COG)
-
Delta Northing = SOG * Delta Time * COS(COG)
-
Notes:
-
Height value are never deskewed.
-
The selected deskew option counts also for the 'Compare to' node
If the log file requires an identifier in order to decode the position fields, 'Name' can be used. It can be translated to something else as appropriate.
'Time' is selected here because it will be used as the basis to determine which gyro, motion sensor and USBL values to output with the coordinates.
Height is by default on Chart Datum (also known as Vertical Datum), but Survey Datum, WGS84, the Actual Water Level, the Mean Water Level, or the Geoid Model Level may be selected.
Note in particular to select the appropriate height reference.
Height is by default on Chart Datum (also known as Vertical Datum), but Survey Datum, WGS84, the Actual Water Level, the Mean Water Level, or the Geoid Model Level may be selected.
Refer to .
Return to top of page.
Return to Cutter Suction Dredger (CSD) - System Definitions.
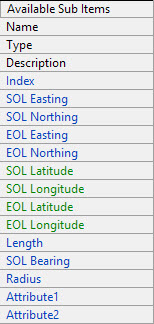
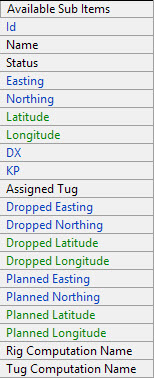
Line Offsets Button
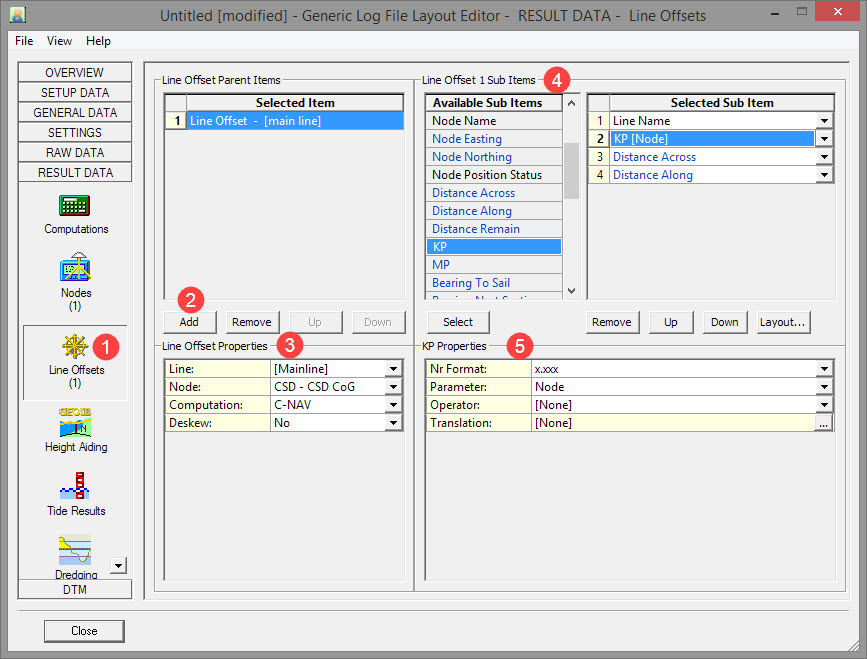
The first (default) entry is always [Mainline].
The first one is always the Controller's mainline.The other 9 are the Additional mainlines.
The actual mainline/additional mainline selection (POINT, LINE, ROUTE) is done in the Controller's Session Setup
If the log file requires an identifier in order to decode these fields, add a Comment sub-item before each of the selected sub-items.
Refer to .
Return to top of page.
Return to Cutter Suction Dredger (CSD) - System Definitions.
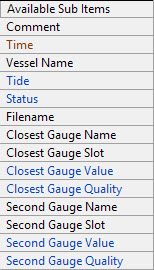
Tide Results Button
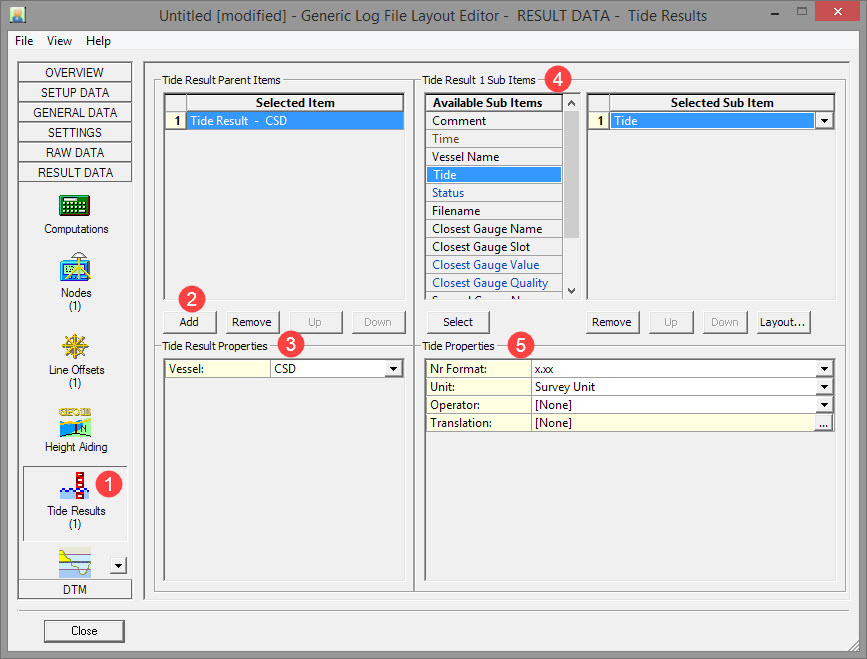
The first (default) entry is always [Reference Vessel]. This means that the first defined object will be used (with Object Id 1).
In Db Setup you will see 'square' icon in front of the vessel name.
The rest of the list will show all available objects, existing in the current selected QINSy database .
The list shows all available objects, existing in the current selected QINSy database .
If the log file requires an identifier in order to decode these fields, the Comment sub-item can be used.
Refer to .
Return to top of page.
Return to Cutter Suction Dredger (CSD) - System Definitions.
Dredging Results Button
Selections made here depend on the setup. Sometimes the PLC computes TDS, Load, Displacement etc..
If calculated in the software some items may be logged in the output file.
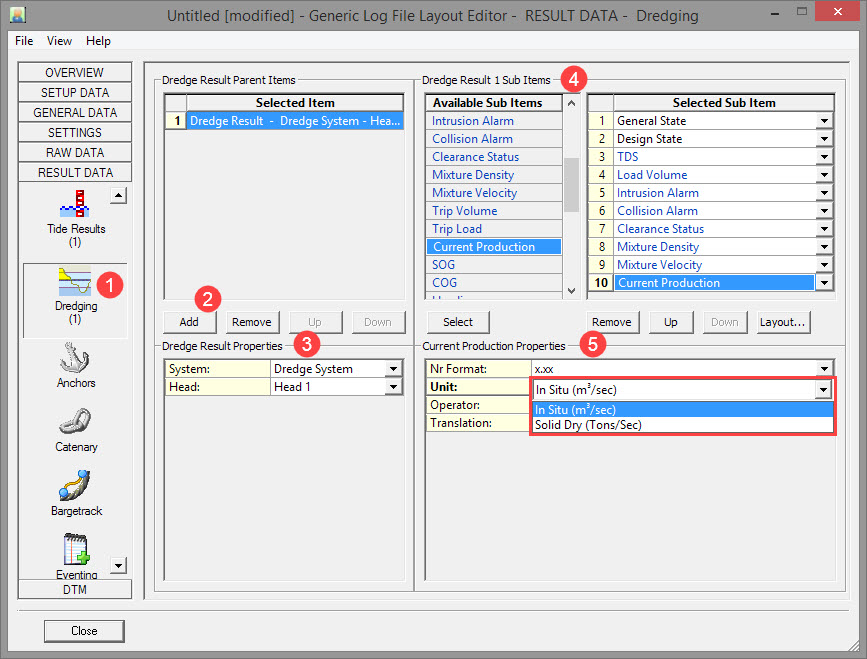
The first (default) entry is always [Dredge Result Head 1].
The list shows all available systems existing in the current selected QINSy database .
General State (dredging status), Design State, TDS, Load Volume, Current Production, Intrusion Alarm (formerly Emergency Hoist), Collision Alarm, and Collision Status.
Design state:
-
Above
Head footprint is above design (including tolerance) -
On Target
Head is on design level (within tolerance levels) -
Over Dredge
Head is below design level (including tolerance)
Usually bad news for contractor... -
Not Used
Unknown/not used possible when grid data is not available
If the log file requires an identifier in order to decode these fields, the Comment sub-item can be used before each sub-item.
In particular the unit for Current Production.
Refer to .
Return to top of page.
Return to Cutter Suction Dredger (CSD) - System Definitions.
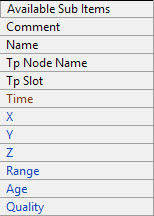
DTM Tab
Sounding Grid Button
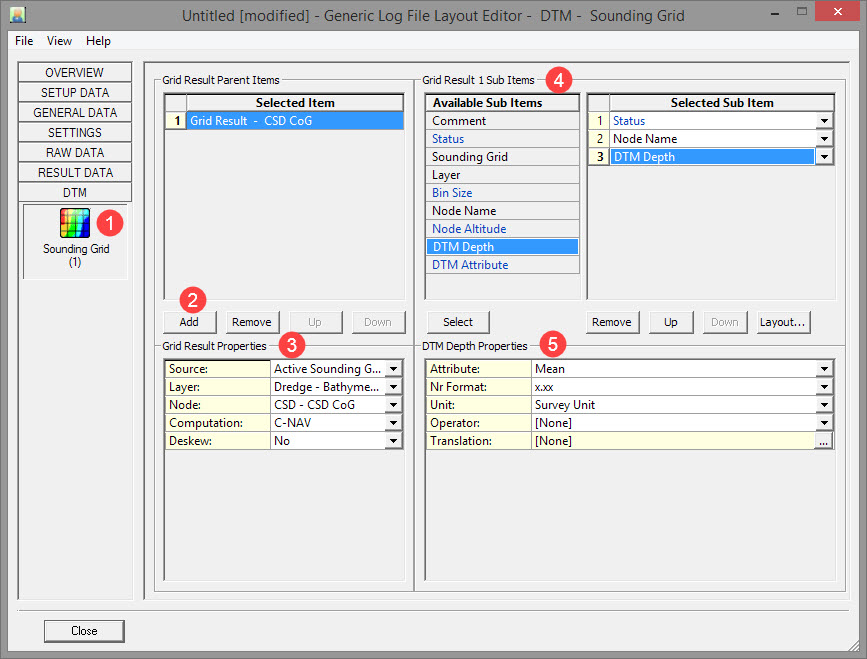
The first (default) entry is always Grid Result - [steered].
By default the Source is 'Active Sounding Grid'. Use the Browse option to load a different grid.
Then select the Layer, Node and Computation.
Node Name, Status and DTM Depth.
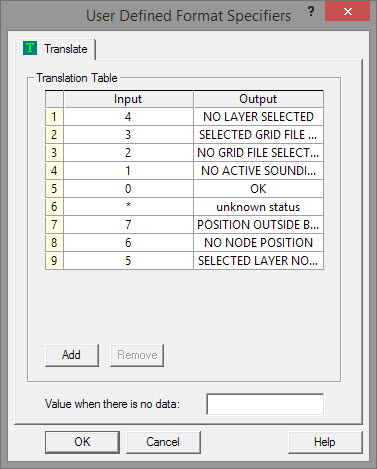
Status: A number between 0 and 7 indicating the status of the selected Sounding Grid, Layer and / or Node
0 means all okay, a valid DTM value was extracted successfully for the current node position
1 means no active sounding grid file has been selected in the Controller's Session Storage Setup
2 means that no grid file was selected
3 means that the selected grid file was not found
4 means that no layer has been selected
5 means that the selected layer was not found in the current sounding grid
6 means that no node was selected, or that the selected node has no valid position
7 means that the current node position is inside a bin with no valid DTM values
This sub-item employs a translation table:
DTM Depth: This is the mean (default) depth value from the bin (level 0) for the current position, but may also be the deepest and/or shallowest depth value if that attribute exist in the current layer.
The value will be empty if the status (see above) is not zero, or if the selected attribute deepest/shallowest is not a property of the selected layer.
Refer to .
Return to top of page.
Return to Cutter Suction Dredger (CSD) - System Definitions.
Overview Tab
While this tab is located uppermost, thereby suggesting its priority, it is preferable to access its most used option button, 'Layout', after items and sub-items have been selected using the other tabs.
Layout Button

This page shows the layout of all items selected so far.
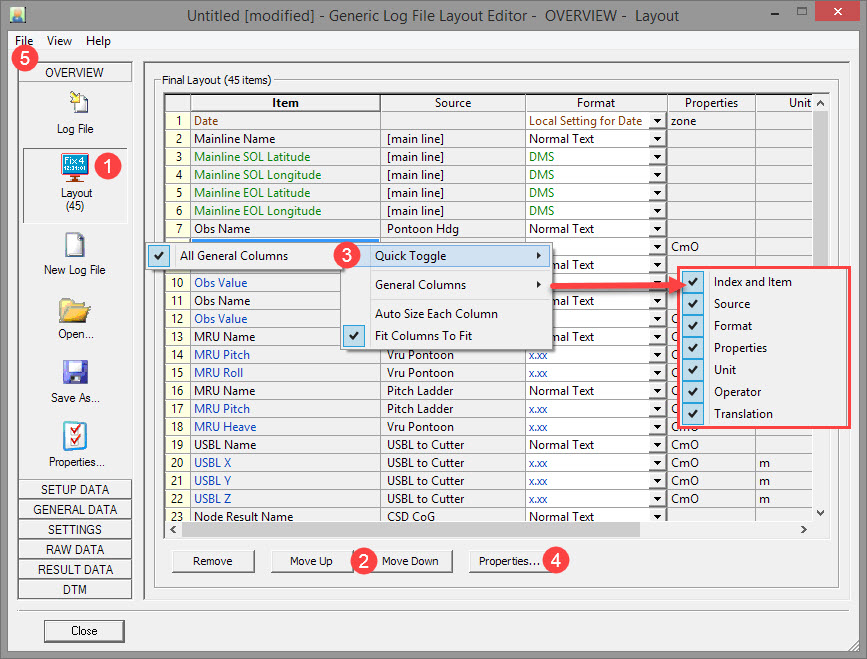


Right clicking anywhere in the table pops up a menu with options, Refer to .

-
-
either double clicking on an item in the Item column.
-
or Highlighting an item and pressing
-
In each case the definition page for that item is opened.
Some properties are directly editable in the layout table.

Saving the layout writes an XML file to the /Project Folder/Settings/Logfile.
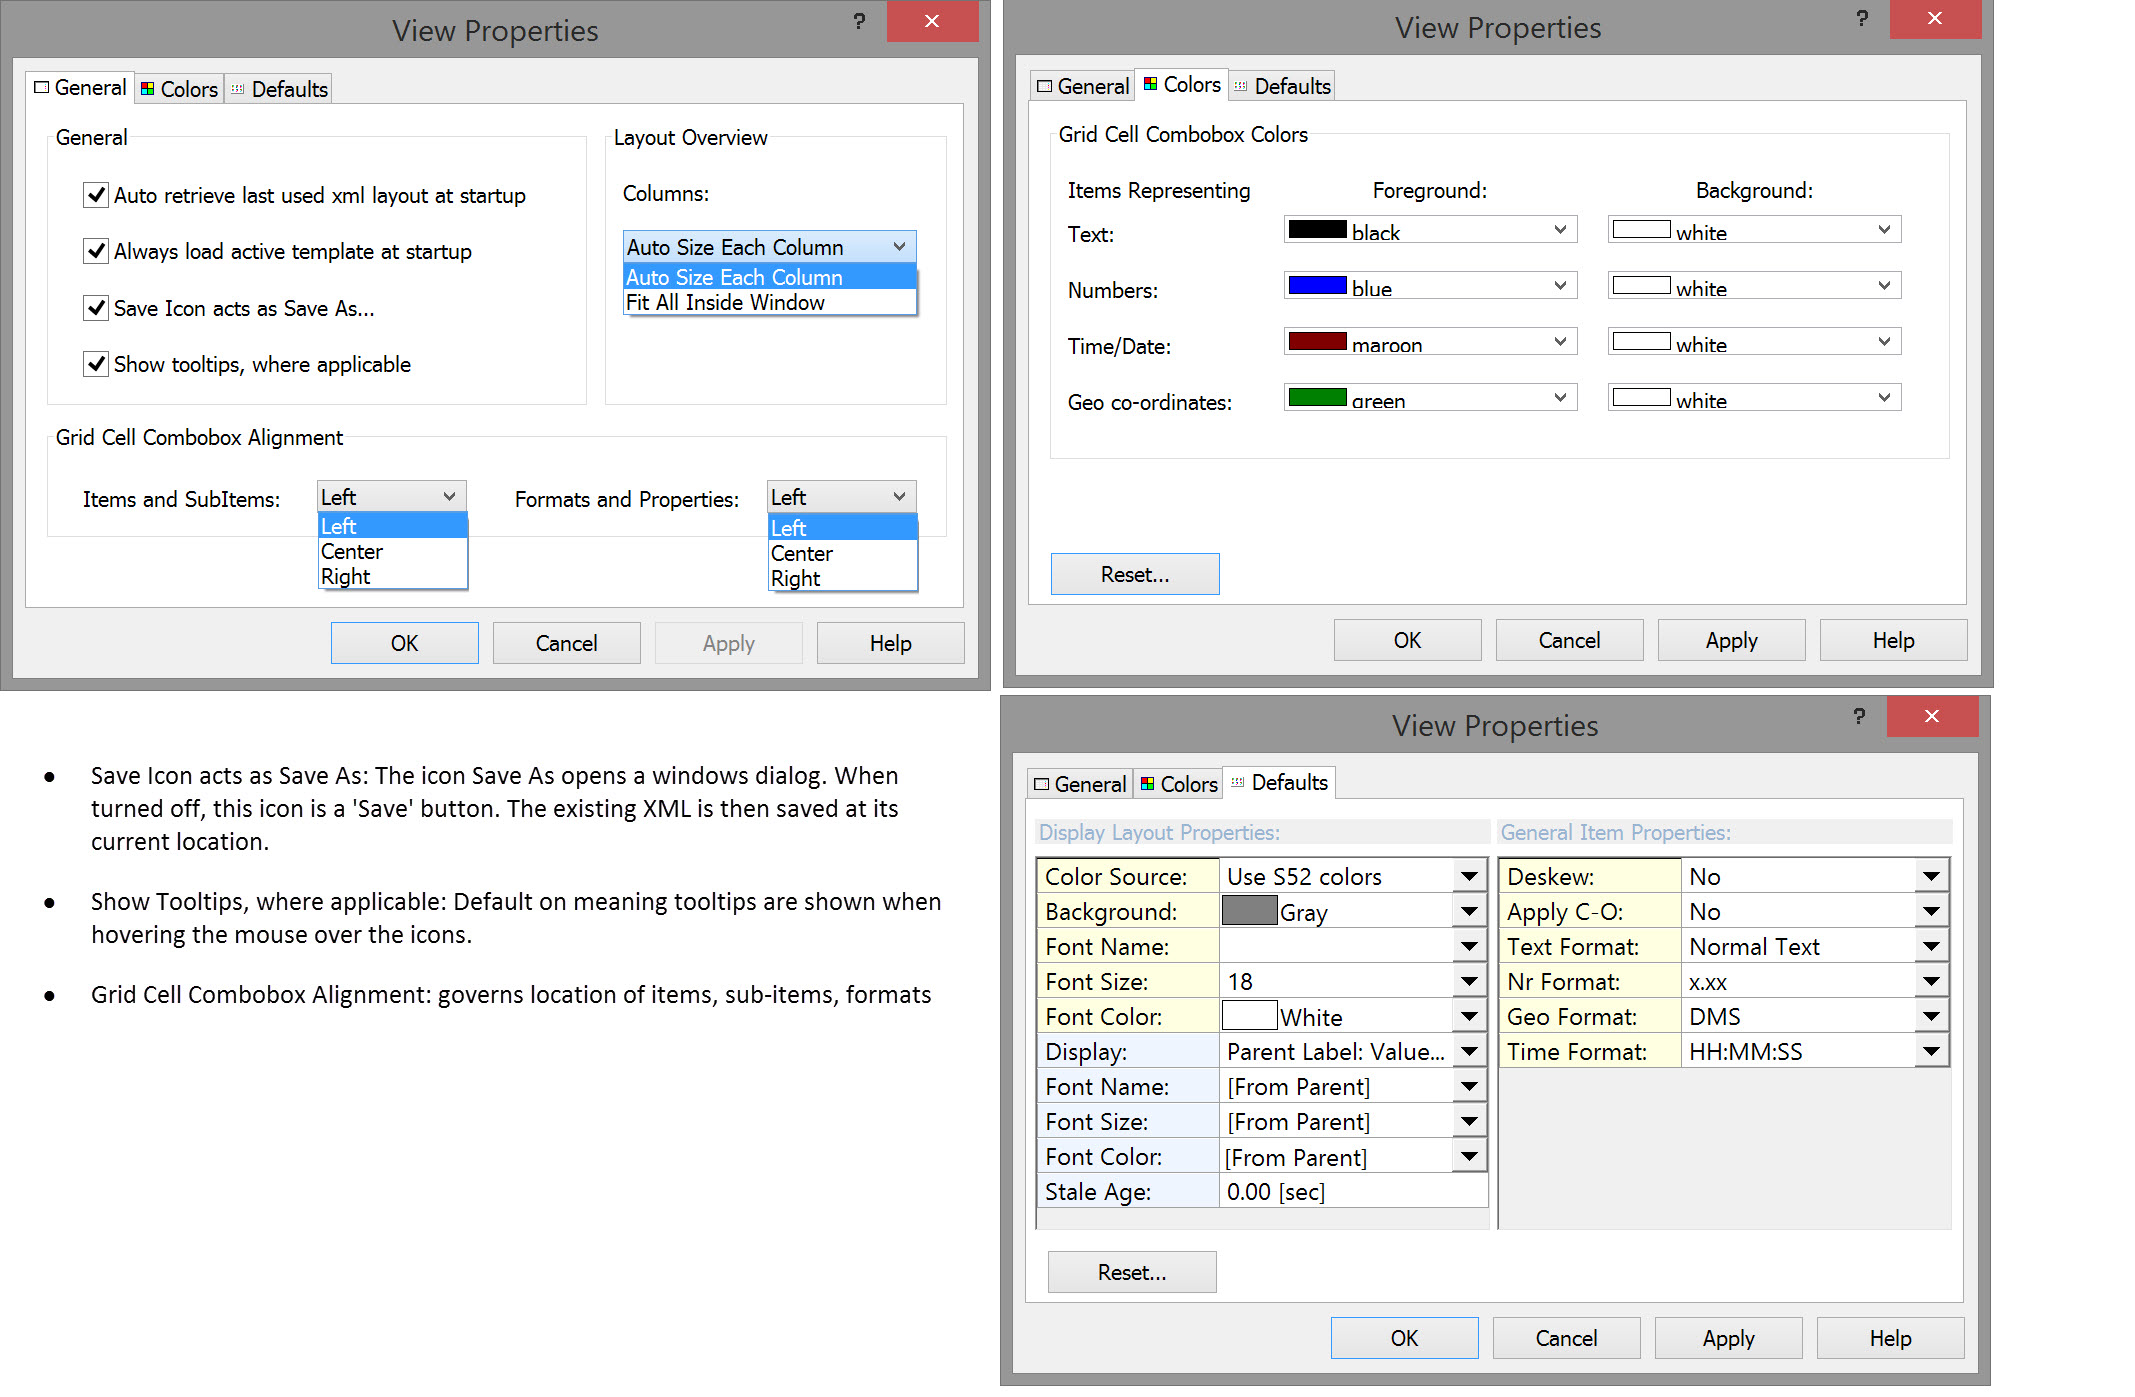
Properties Button
Click on the Overview tab and then the Properties button.
All parameters are fairly self explanatory. See notes in the image below.
Log File
Refer to .
Refer to .
Return to top of page.
Return to: CSD - Generic ASCII Data Logger