
Introduction
Grids are one of the primary object types in Fledermaus and are used to represent uniformly gridded surfaces. For example, a surface that represents Z = f(x, y) where x and y are sampled on a uniform grid. Grids in Fledermaus are dynamically streamed from the .statgrid/.dyngrid file. If the Grid is small it may be fully loaded in memory but for larger Grids more data is pulled in as you zoom in and move around the scene. The Grid object type in Fledermaus supports both Static and Dynamic Grids, although not all the features associated with Dynamic Grids in Qimera are supported. As of Fledermaus version 8.7.0 multilayer grids are now supported. Previously you could only have either a surface or a surface with an attached scalar layer. You can now have an arbitrary number of surface and scalar layers in a single grid object. All of the surface layers must have the same base resolution of the Grid. A single optional texture layer can be associated with the surface and have a different (usually higher) resolution.
Storage Format
In Fledermaus, the file extension for Grids is .statgrid for a Static Grid, and .dyngrid for a Dynamic Grid.
Properties
Along with the standard properties that all object share, the Grid object adds the populated X and Y bounds as well as the overall object bounds. Grid objects are always padding out to an even multiple of 128 cells in the rows and columns, and the populated range identifies the actual Grid bounds not counting any of the extra padding cells along the right and top edges. When you do things like exporting a Grid, only the populated area will be exported. The normal properties for the Grid object include:
|
Property Name |
Description |
|---|---|
|
Profile Config |
|
|
Column Count |
The total cell columns in the Grid padded to an even multiple of 128. |
|
Row Count |
The total cell rows in the Grid padded to an even multiple of 128. |
|
Populated Dimensions |
As above but without the padding included. |
|
Cell Size |
The base resolution of the Grid |
|
Is Geographic? |
Yes if the object's x and y coordinates are Longitude and Latitude in degrees. |
|
Encoded Z-Range |
The overall Z-Range of the Grid object |
In addition to the base properties the Grid also includes a set of illumination properties which show the values used to shade the Grid. These include:
|
Illumination Property Name |
Description |
|---|---|
|
Shaded Surface |
Which of the possible surfaces is illuminated ( one of Shallow, Average, Deep, CUBE ). |
|
Sun Azimuth |
The compass angle towards the sun in degrees. (0 = North, 90 = East, 180 = South, 270 = West) |
|
Sun Inclination |
The angle looking up towards the sun's position. |
|
Ambient Factor |
A basic background amount of light (0.20 is 20%) |
|
Specular Factor |
How much do you want to highlight the specular components (parts of the Grid facing the light source very closely.) |
|
Soft Shadow Factor |
How soft/hard are the shadows edges. |
|
Vertical Light Scale |
How much the Grid is vertically exaggerated for the purpose of lighting. |
|
Is Illum Dirty |
If this is true than the parameters shown here are out of date. |
There is an additional property specific to grids with multiple surface layers:
|
Property Name |
Description |
|---|---|
|
Layer ID |
Unique identifier for the selected surface layer. |
Attributes
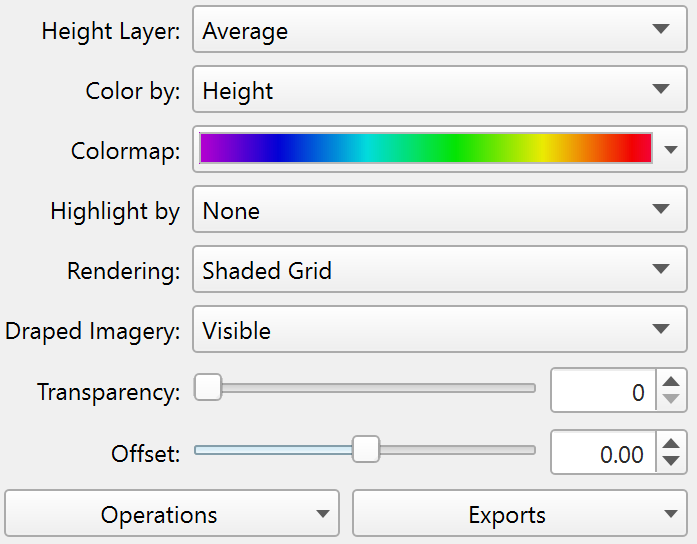
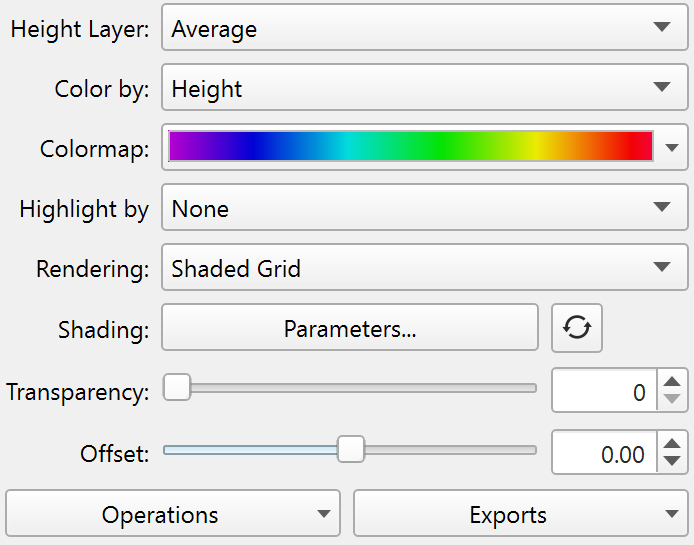
The attributes control how the Grid is displayed and includes the options shown below. Note that some options only show when the Grid has certain properties as shown in the two examples below. The Height Layer drop down will show which surface layer property is displayed. All grids contain at least an average surface but some may have shallow, average, deep and CUBE options which can be selected. The Draped Imagery drop down menu will only show if the Grid in question has imagery available to be draped onto the surface. Finally the Shading Parameters button is not shown when the shaded surface is covered by a draped imagery texture, or for individual layers in a multilayer grid.
|
|
|
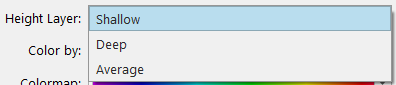
The Height Layer popup menu lets you select which grid height property you want to render for Grids that contain multiple surface properties. For example, if you have a dynamic grid you can select from the Shallow, Average, Deep and, if present, the CUBE grid.
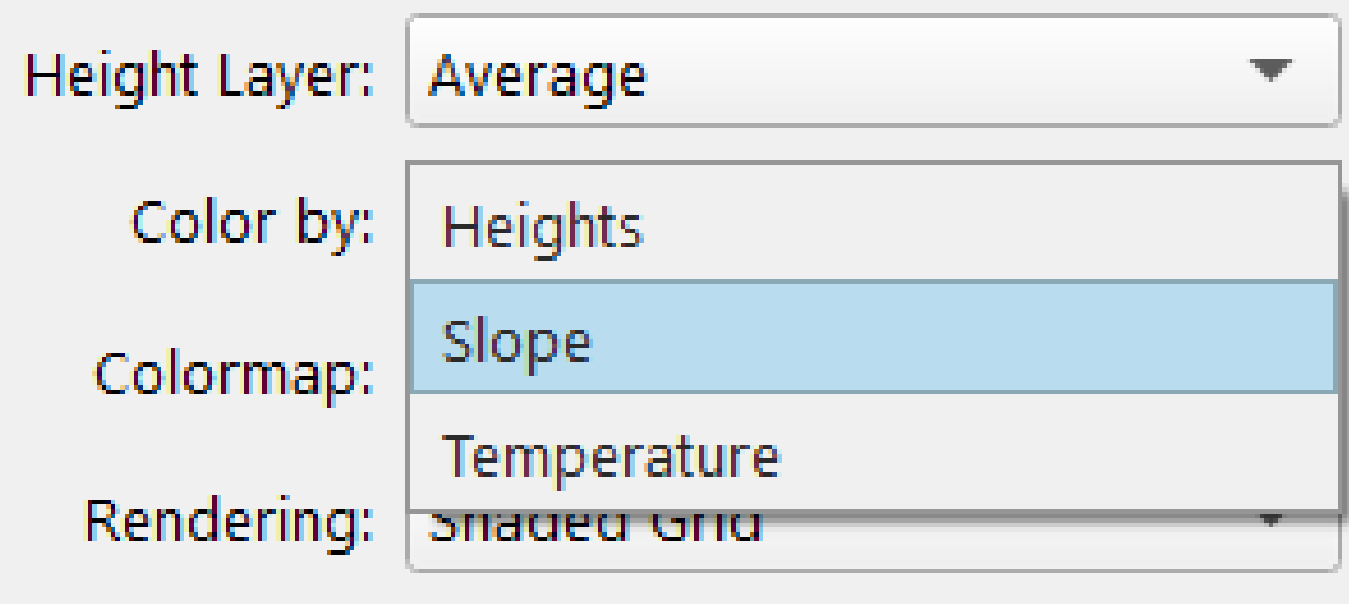
The Color by is normally Heights, but if the Grid object contain one or more scalar layers then these will also be shown as options to color the surface by. For example, if you have a grid with a height layer and two scalar layers called slope and temperature, the color by will have the option to color by the grid heights, slope scalar, or the temperature.
The Colormap option lets one choose which color map to use for the surface and the the widget itself shows the colors from the selected color map being used.
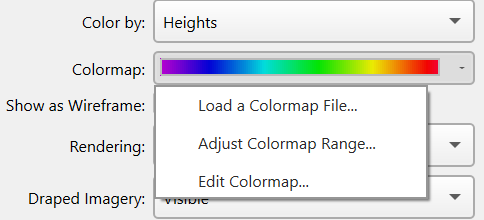
In addition to loading a new colormap file you can also adjust how the color map is applied to the surface. You can also choose to edit and/or create new colormaps via the Edit Colormap option.
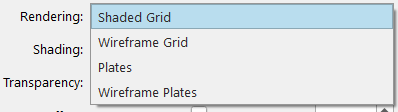
The Rendering dropdown is used to control how the Grid is displayed. The default is the Shaded Grid option which rendering the grid from cell center to cell center smoothly blending the colors across the Grid. The Wireframe Grid is the same as the Shaded Grid but doesn't fill in the triangles so you can see the surface as a wireframe. The Plates and Wireframe Plates are similar but they render each grid cell as a disjoint plate from edge to edge so you see the exact grid cell coverage and structure/size of the grid cell elements.
The Shading option lets you bring up the lighting control dialog to change the illumination used to shade the surface. Note that this option is hidden if the Draped Imagery option is set to Visible.
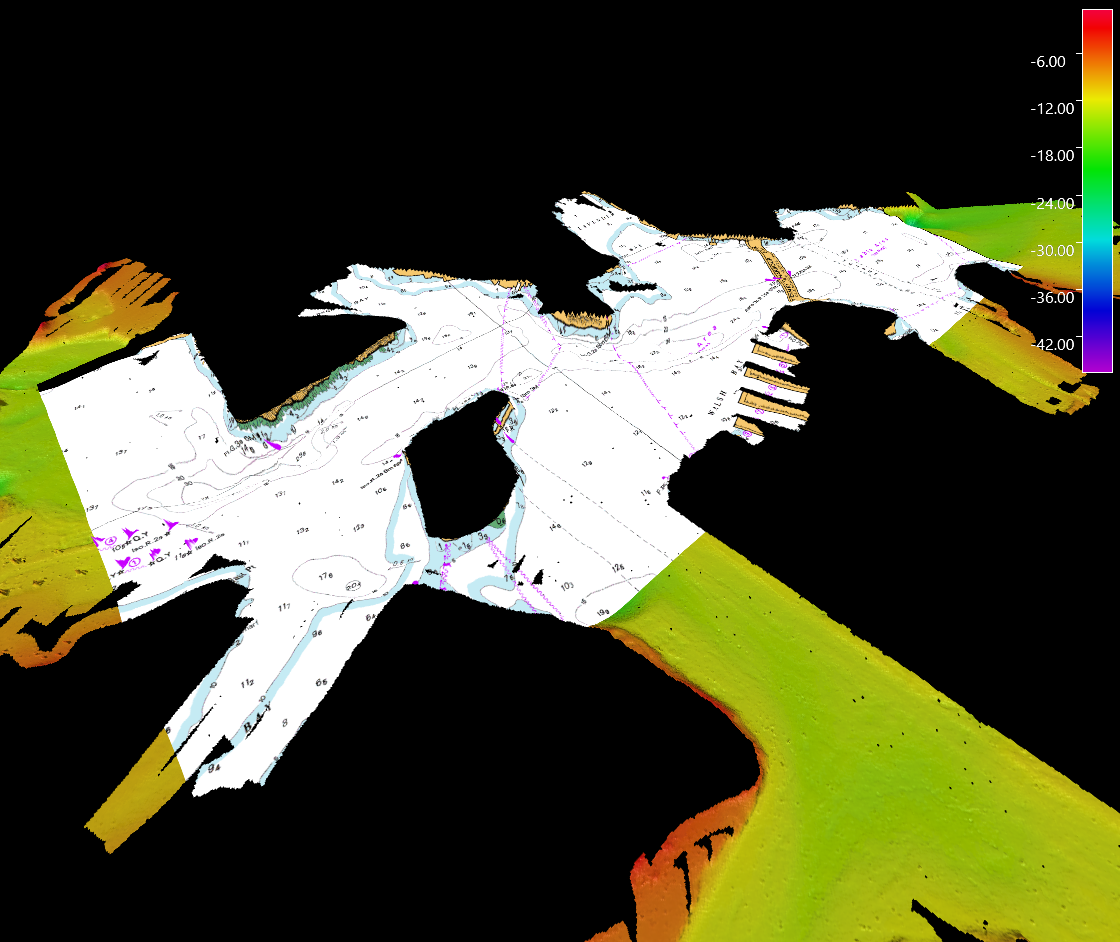
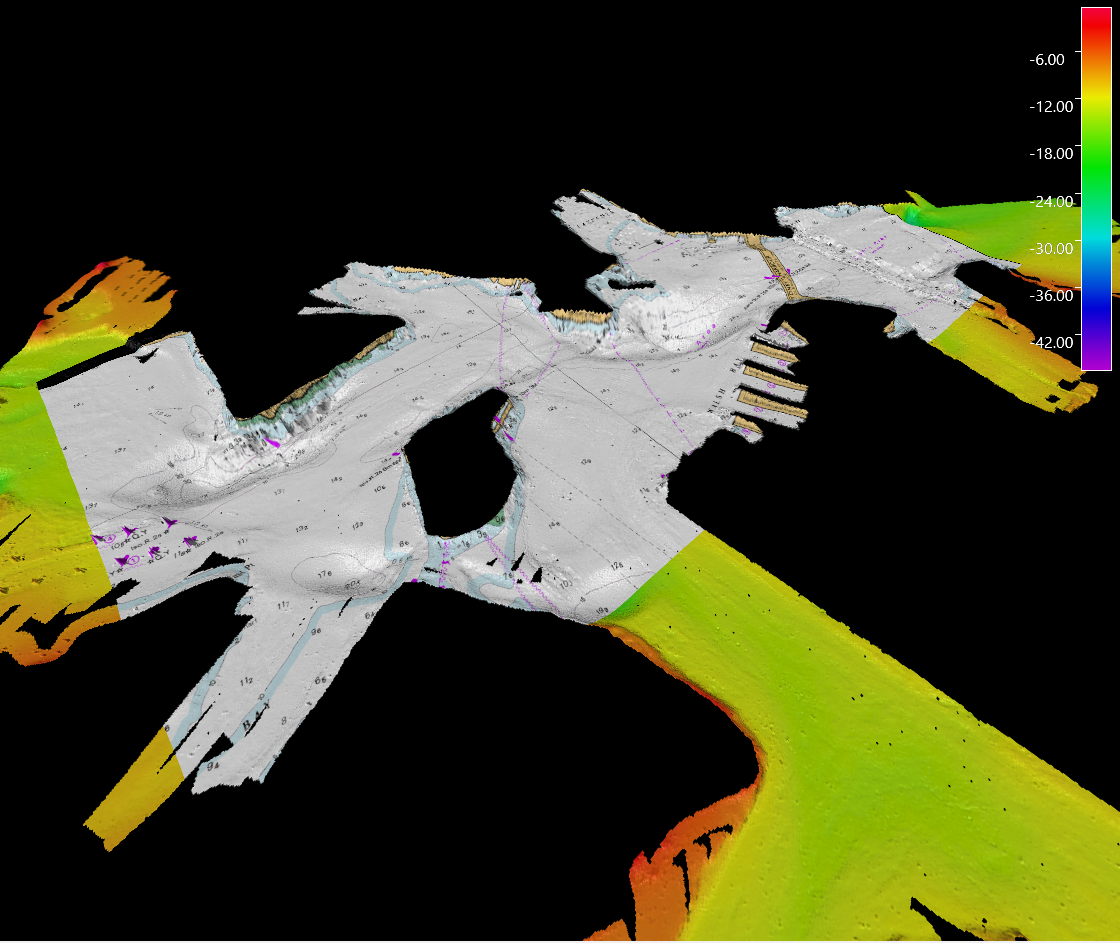
The Draped Imagery dropdown controls how any texture associated with the surface will be applied. When set to the default Visible state any texture available will be rendered. When set to Hidden no texture will be shown on the surface whether available or not. Finally the Visible with Shading option will apply the same lighting that the surface has to the colors of the texture when available. See the examples below to compare the Visible and Visible with Shading options.
|
|
|---|
The Transparency slider controls the overall opacity of the Grid, when set to 0% the Grid is fully opaque (the default) and when 100% transparent you will see nothing from the Grid. Values in between will blend the Grid with other objects behind it.
The Offset slider applies a basic vertical offset to move the Grid up or down by a small amount. This offset does not change the data in any way it is purely applied in the visual presentation. It can be very useful when you have Grids or other object exactly on the top of the surface and want to move it a little vertically to control which object appears on the bottom or top.
As well as right clicking on the object to access the Operations and Exports they are also available from the Operations and Exports drop down menus at the bottom of the attribute panel.
Operations
To see the operations available for the Grid object type right click the object's name and look in the Operations sub-menu or look at the Operations dropdown menu at the bottom left of the attribute panel. These operations include:
Change Object Coordinate System...
While this should be very rarely needed it can be used if necessary to change the coordinate system currently applied to the object. No projection is done here you are just telling it that this new coordinate system is what the object should have been in in the first place.
Reproject Object...
Generally there are better ways to handle (re)projection work but if you really just want to convert this Grid into a new projection this will work. The Reproject Object option will produce a new Grid by transforming the existing one into the new projection you have chosen then adds the result to the current scene.
Reproject Object To Scene...
If an object is current marked as Undisplayable in the Scene control dock this is normally because it is in a different projection than the scene is. As Grids don't dynamically auto-project if you want to see this object in the current scene's CRS than one can use this option. It will result in a new Grid being produced that can be displayed in the current Scene.
Show Histogram...
Computes a histogram of the height values for the Grid and displays the results. See here for details.
Show Spreadsheet...
Show a spreadsheet view of the Grid, showing the particular values of each bin. Only a limited area can be viewed at once but the area can be moved around the entire Grid. Click here for details.
Attach Scalar...
This option is used to attach an existing scalar object to the selected Grid. If necessary the scalar will be resampled to match the resolution of the Grid cells. Click here for details.
Compute Mask...
This option can be used to knock holes in the Grid based on other Grids or imagery objects. For example say you have a land dataset where a lake is filled in with zero heights and you also have a bathymetry Grid from a lake survey. One could use this option to knock out the lake cells from the land surface using the bathymetry Grid you have allowing the bathy surface to show through. Click here for details.
Contour...
Select the contour operation to produce contours for the selected Grids. Click here for details.
Create Dynamic Points…
This operations creates a series of dynamic points that follow a selected line on a particular Dynamic Grid. Click here for details.
Create Survey Area...
This operation creates a series of polygons that outline the area covered by a particular Grid. Click here for details.
Drape Image...
This option is used to drape images files as textures onto the surface. If the surface doesn't already have a texture the 1st image you drape will add one. You can drape additional images to build on an existing texture although if the images cover the same area than the last pixels added are the ones shown. You can also clear an existing texture when adding a new image. See here for detailed documentation on draping.
Detach Scalar...
If you have a Grid object with an attached scalar you can utilize this option to detach it from the Grid and make it a separate scalar object. Click here for details.
Starting v8.7.0 the Detach Scalar operation as been replaced with Extract Grid Layers.
Extract Area...
Use this operation to extract a sub-area from the selected Grid to make a new Grid with the given area. The area can be specified directly by coordinates or it can use selections that have been made on the Grid. Click here for details.
Extract Grid Layers…
If a surface has multiple layers the extract grid layers operation can be used to pull out any individual layers from the multilayer grid file into separate grid files for the selected layers. This operation launches the grid layer extraction dialog. Click here for details.
Grid Difference...
This options lets one compute Grid difference from the selected object to another Grid or plane and produce a difference Grid along with appropriate statistics. Click here for details.
IHO Uncertainty...
This is used to compute an uncertainty scalar for a Grid based on the standard IHO uncertainty algorithm which computes an uncertainty based on the depth of the surface elements. Click here for details.
Interpolate...
Does a basic interpolation of the Grid which can be used to fill in small holes based on the neighboring cell heights. When cells are filled by interpolation they are flagged as such so they can be differentiated from real cell data for certain other operations. Click here for details.
Merge...
The merge tool is a data fusion tool which allows one to merge multiple selected Grids into a single new Grid with a specified resolution and various option for how to merge overlapping cells from multiple Grids. This is a very handy tool if one needs to deliver a single final Grid built from separate individual ones. Click here for details.
Replace Value...
This operation can replace all depth values in a specified area and depth range of the Grid with a custom or no-data value. Click here for details.
Resample...
This operation provides a tool for resampling a Grid to a different resolution based on several methods. Click here for details.
Rugosity
Similar to the slope option but for computing surface rugosity. Click here for details.
Slope...
This is used to compute a slope scalar based on the heights in the Grid object. Click here for details.
Statistics...
This option computes a number of statistics based on the information contained within the Grid object and presents the results. Click here for details.
Exports
Export to ArcGIS...
Assuming you have the ESRI GIS Engine setup this tool lets you push data into ESRI geodata sets. The tool is described in detail here.
Export to Google Earth KML...
Exports the Grid to a Google Earth KML file which can be easily loaded into Google Earth. Click here for details.
Export to 3D PDF...
Exports a copy of the Grid as a 3D PDF file for use in Adobe Acrobat. There are limitations of the size of the file as Fledermaus can easily generate Grids much larger than the capability of PDF viewers so you may have to break the area up if it large. Click here for details.
Export to Image...
This exports the colored height data to various imagery formats. Click here for details.
Export Texture to Image...
If a Grid has an attached texture this option can be used to specifically save the texture component out to a variety of standard image formats. Click here for details.
Export to BAG file...
This will launch the Export BAG Surface Wizard. Click here for details.
Export to Surface...
This options supports exporting the Grid data itself to various 3rd party formats. Click here for details.
Return to Fledermaus Visual Objects
Return to Fledermaus Reference Manual