
Profile Display
The Profile Display provides a slice view of the dredger and the sounding grid displayed from four different angles (starboard, port, aft and front).
IMPORTANT: In order to display objects in the profile display a long profile or a cross profile through the CoG of the vessel is required. These are defined in the Database Setup program when creating object shapes.
The following directions assume a Profile Display has already been created. Refer to CSD - Online Displays for details about creating a display set and adding new displays.
Take the following steps to configure the Profile Display; only a few important settings will be discussed here. For more detailed information refer to the Online Help.


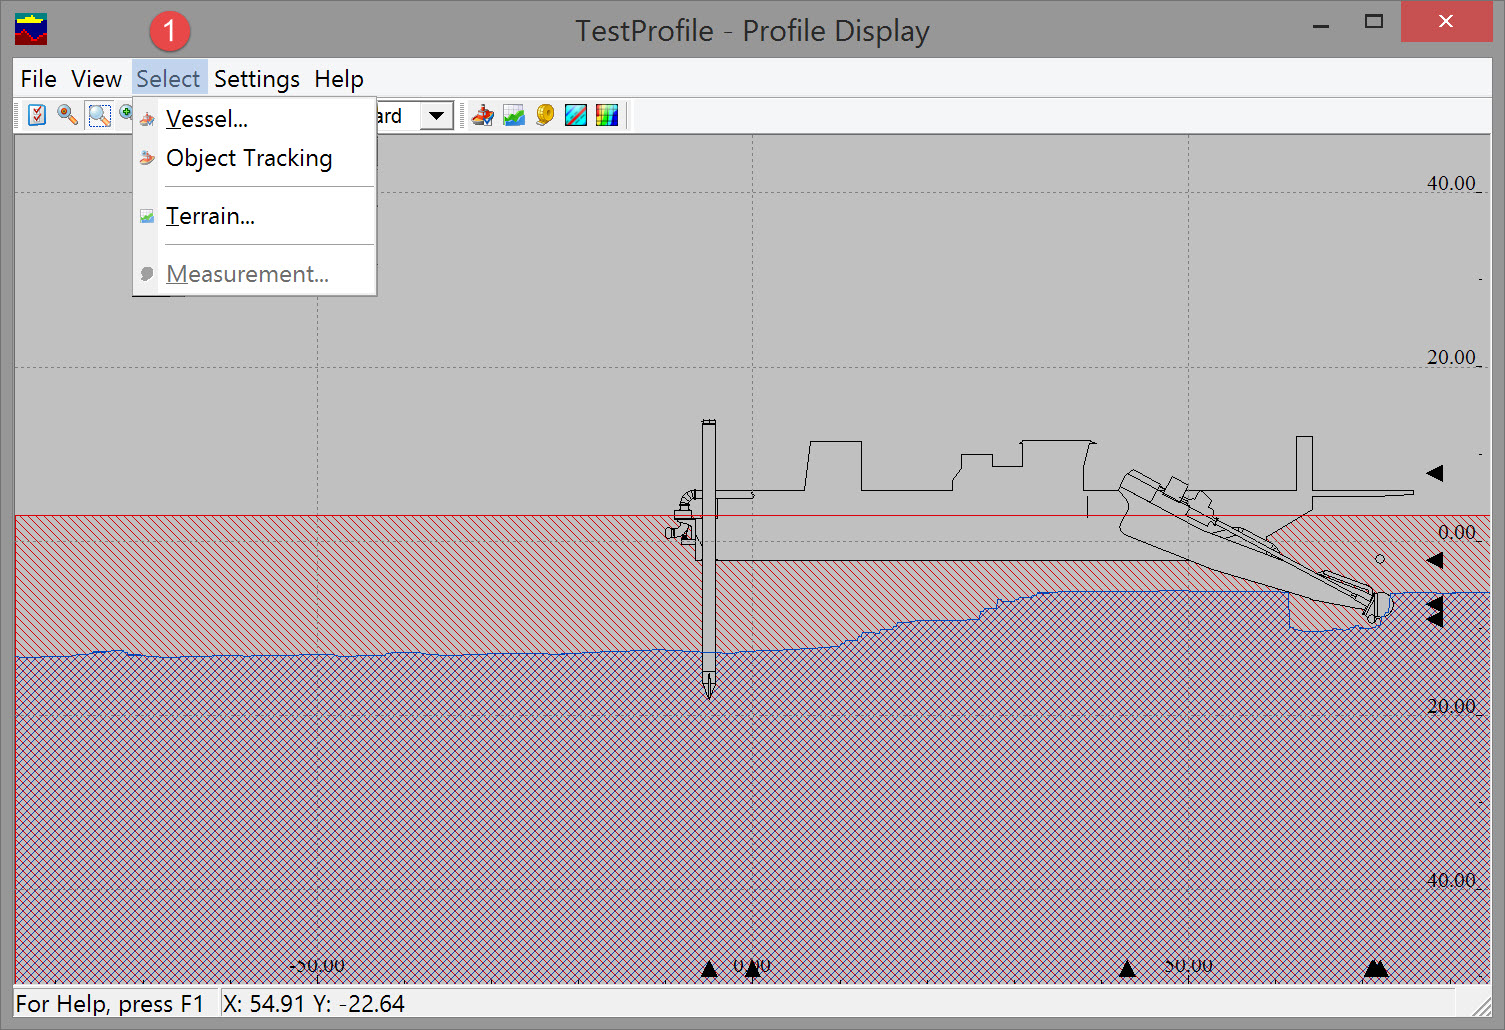
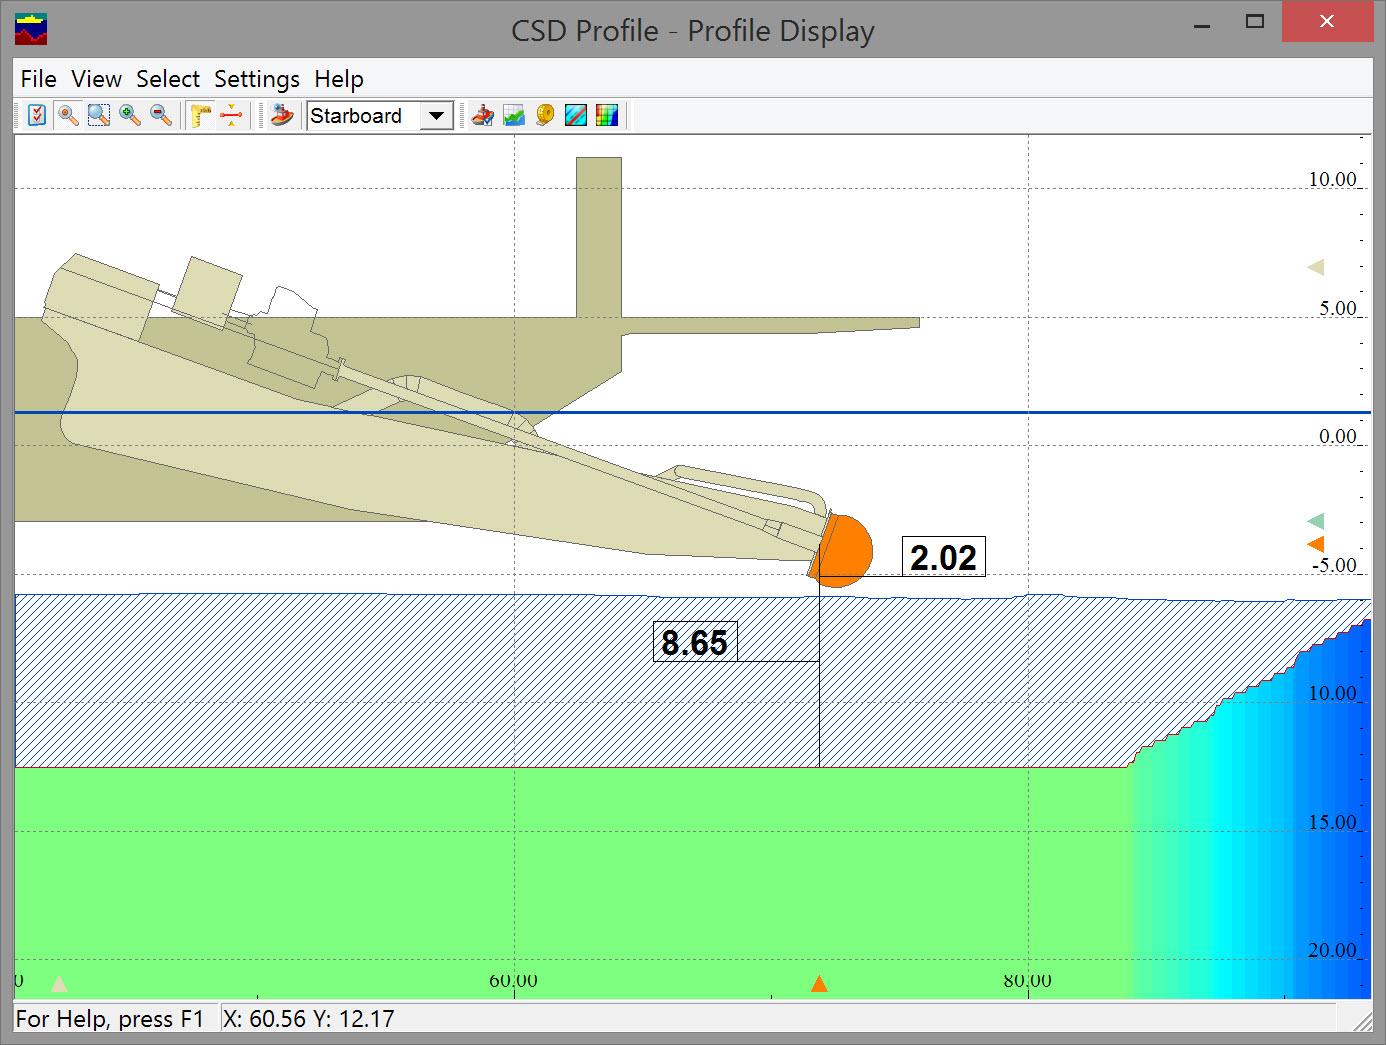
The initial view should look something like this:
Notes:
-
The dredger's position is offset because the display is centered on the CoG defined for the object. In this case it is located toward the stern in proximity to the spud pole. You can change the focus to the CoG of another object such as the ladder or cutter.
-
The first layer in the sounding grid is automatically loaded on creating the display; in this case the blue line with blue hatching below.
-
The Design layer is also loaded automatically. This is the red line with red hatching below it.
-
The black arrows at lower and right edges are pointers to the CoG of each defined object.
The display can be customized as follows:
View Properties - Profiles
Objects


Selecting any other option in the Select pull down menu also opens the View Properties dialog with the focus on a different page.
Selecting View Properties from the View menu opens the same dialog.
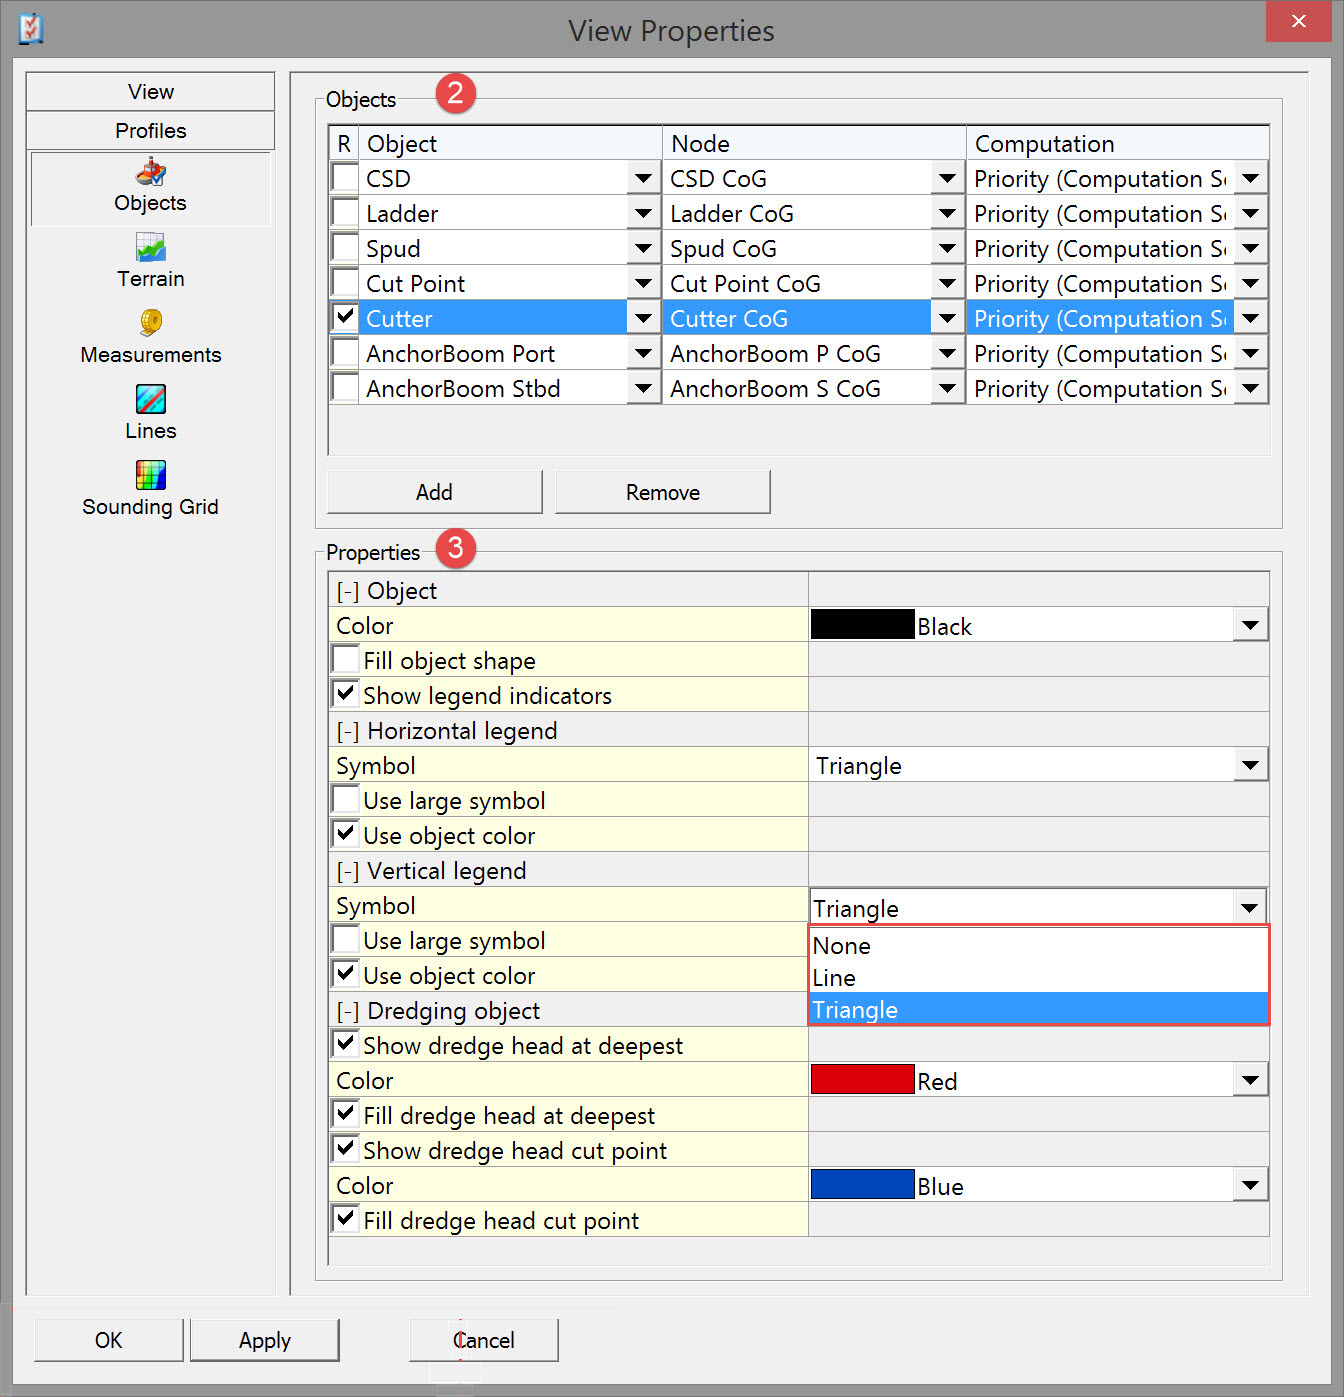

Choose a reference object, and the node on that object, on which to center the main window. Coordinates come from the computation selected.
Make selections and parameter value entries to set object properties. These can be set for any object that is currently highlighted.
|
Properties |
|
|---|---|
|
Object |
|
|
Color |
Select a color for the object highlighted in the panel above. |
|
Fill object shape |
Select if you want to fill in the object shape with its set color. |
|
Show legend indicators |
Small indicator symbols in the legend indicate the horizontal and vertical positions of the object in the Profile Display.
|
|
Horizontal legend |
|
|
Symbol |
The selected symbol is placed at the bottom of the display indicating the horizontal position of the object. |
|
Use large symbol |
For ease of recognition. |
|
Use object color |
Switched on : use the color as set for the object above. Switched off : select a color in the line below. |
|
Color |
Select a color for the legend indicator symbol. |
|
Vertical legend |
|
|
Symbol |
The selected symbol is placed at the right side of the display indicating the vertical position of the object. |
|
Use large symbol |
For ease of recognition. |
|
Use object color |
Switched on : use the color as set for the object above. Switched off : select a color in the line below. |
|
Color |
Select a color for the legend indicator symbol. |
|
Dredging Object |
This option is only visible when a dredging object is highlighted in the top panel of the screen. |
|
Show dredge head at deepest |
Choose to show the dredge head at its deepest point. |
|
Color |
Select a color for the dredge head at its deepest point, if activated. |
|
Fill dredge head at deepest |
Fill dredge head with the selected color at its deepest point. |
|
Show dredge head cutting point |
Show where the dredge head cuts the design. A dot is placed at the exact point. |
|
Color |
Select a color for the dredge head where it cuts the design. |
|
Fill dredge head cutting point |
Fill dredge head with the selected color at its cutting point. |
Press <Apply> to see the effects of changes without having to leave this menu.
Return to top of page.
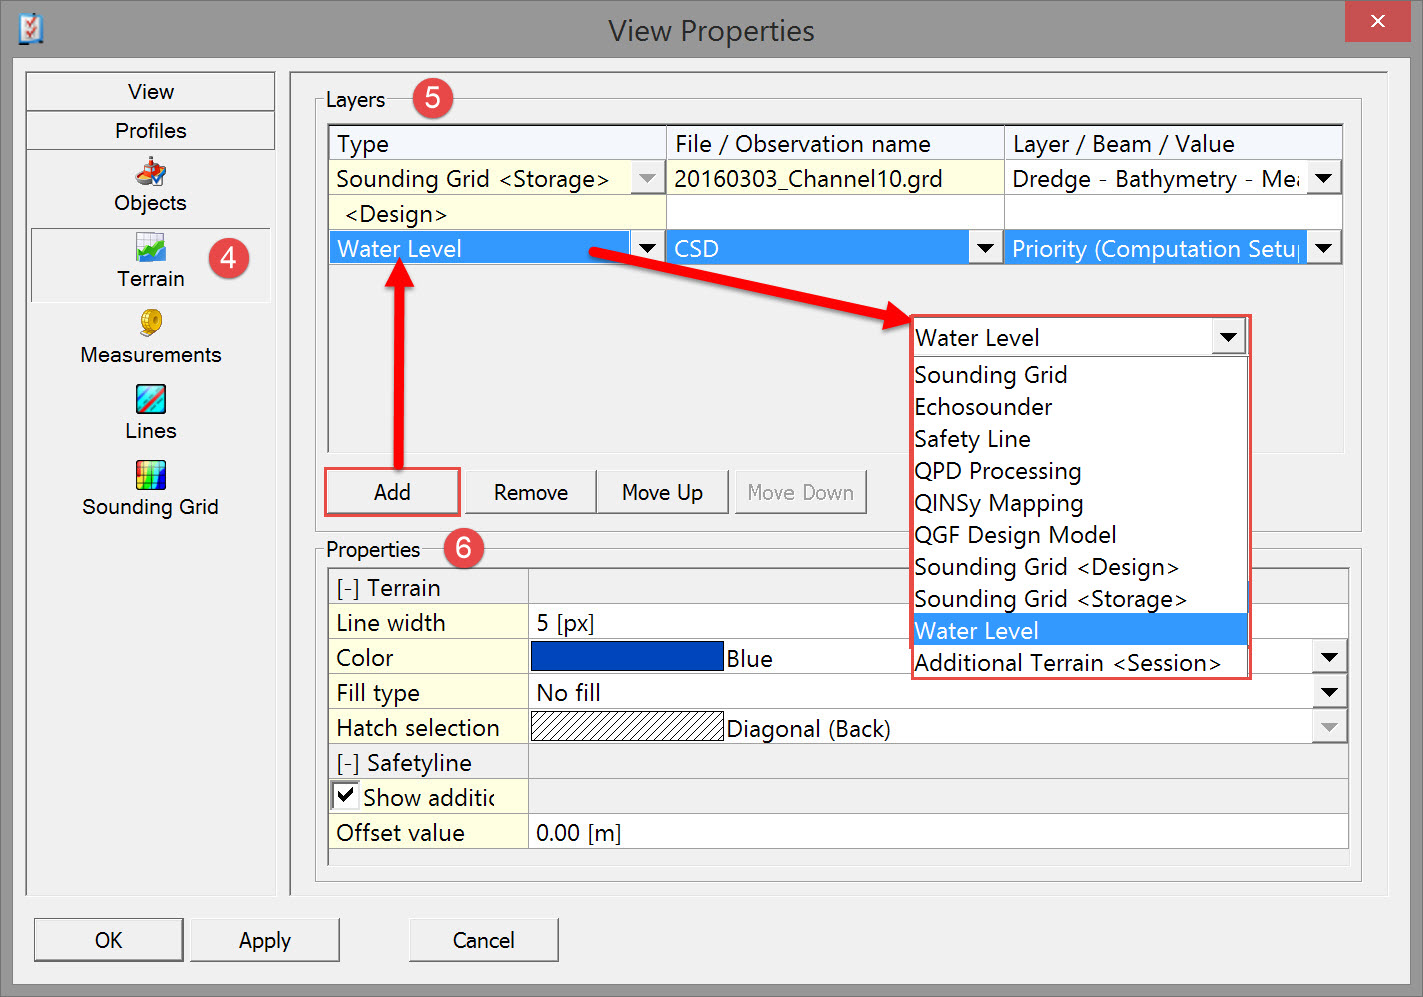
Terrain


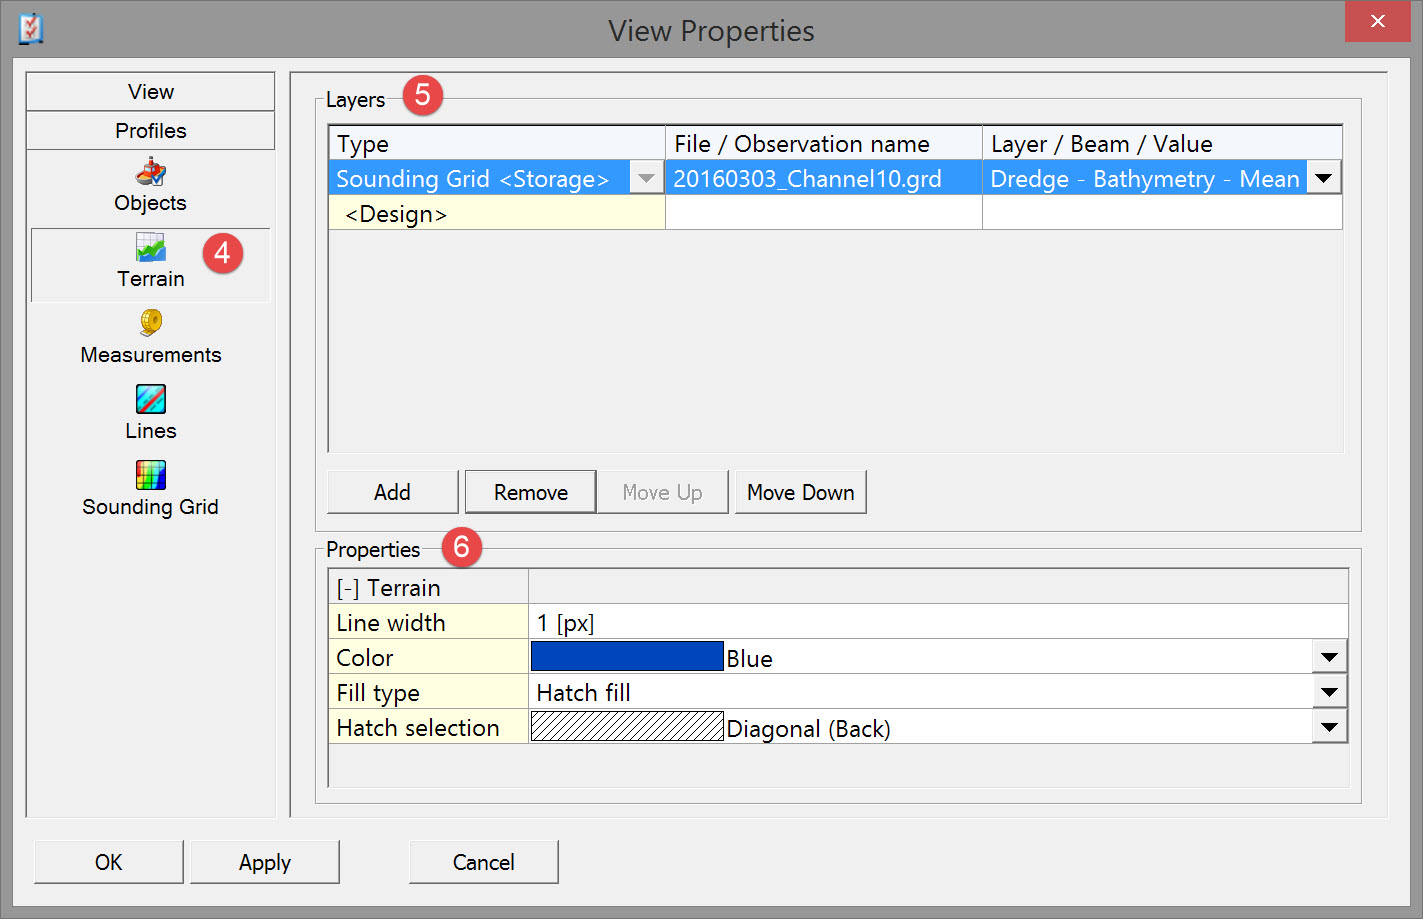

Use the 
|
Layers |
|
|---|---|
|
Type |
Sounding Grid - Select the sounding grid to use from the standard Windows browse dialog. Then select the correct layer in the next column.
Echosounder - Single observations from echosounders can be displayed in real-time. This enables you to analyze the depth readings in comparison to a previously created terrain.
Safety Line - It is possible to add a nominal safety line. A line is displayed at the manually entered depth (in survey units).
QPD Processing - Select *.qpd processed files. Multiple files can be selected. QINSy Mapping - Select a *.pro file. (This is the old format. It can still be used, but will be phased out. Use the *.qgf format instead.) It is only possible to select one file at a time, but you can add more. QGF Design Model - Select a *.qgf file. (This is the new format.) Sounding Grid <Storage> - If a sounding grid was selected in the 'Controller's Session Setup - Storage' it will automatically be shown here. Water Level - Mean Actual Water Level, i.e. water surface, is shown. Additional Terrain <Session> - A terrain from the Controller's Session Setup menu 'Additional Terrains' can be selected here. |
The terrains are displayed in the order in which they are added; the bottom one in the list is displayed on top of earlier entries.

|
Terrain |
|
|
Line width |
Enter a width in pixels. |
|
Color |
Select a color. |
|
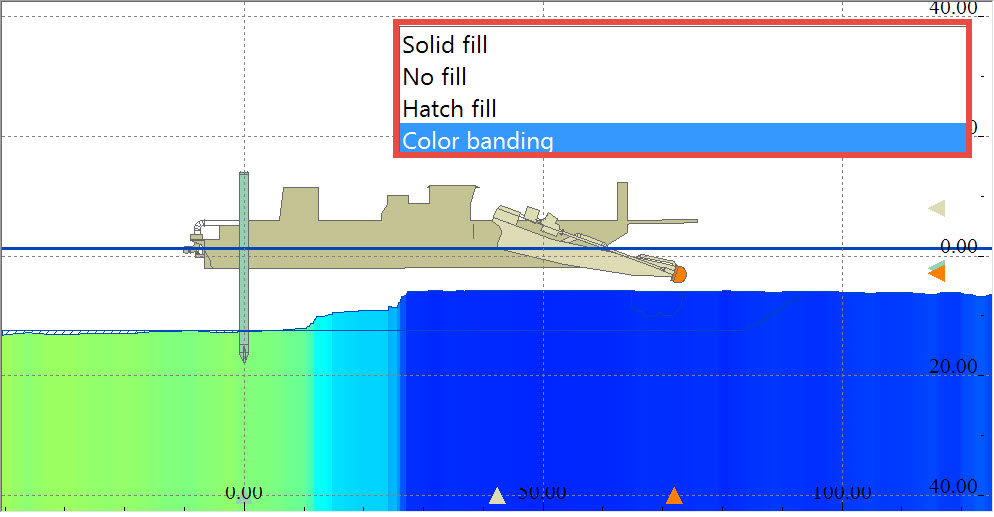
Fill type |
Choose a type:
|
|
Hatch selection |
This option is only available when the fill type was set to Hatch fill. |
|
Safetyline |
Not available for layer type Sounding Grid. |
|
Show additional safety line |
For each selected layer an additional safety line can be added. (Except for Sounding Grid.)
|
|
Offset value |
Enter the offset value in meters and the additional line will be shown offset from the selected layer.
|
|
Color Banding |
Only when the layer type Sounding Grid was selected will this option be available.
|
|
Active layer |
Select a layer. |
|
Active attribute |
Select which values to show. |
|
Reference layer |
Select a layer, if needed. |
|
Reference attribute |
Select which values to show. |
|
Mode |
Set which results to show: a difference layer or a cumulative layer. |
|
Echosounder |
Only when the layer types Echosounder or QPD Processing were selected will this option be available. |
|
Show starboard & port view |
Show starboard and port view of recorded data.
|
|
Use nadir beam |
Use the beam in the middle of the array to show depths from when using a multibeam echosounder.
|
|
Time span |
Define how much echosounder data should be shown in the Profile Display (in seconds). |
Return to top of page.
Measurements
Measurements are calculated from a node to a profile; they are not raw measurements.


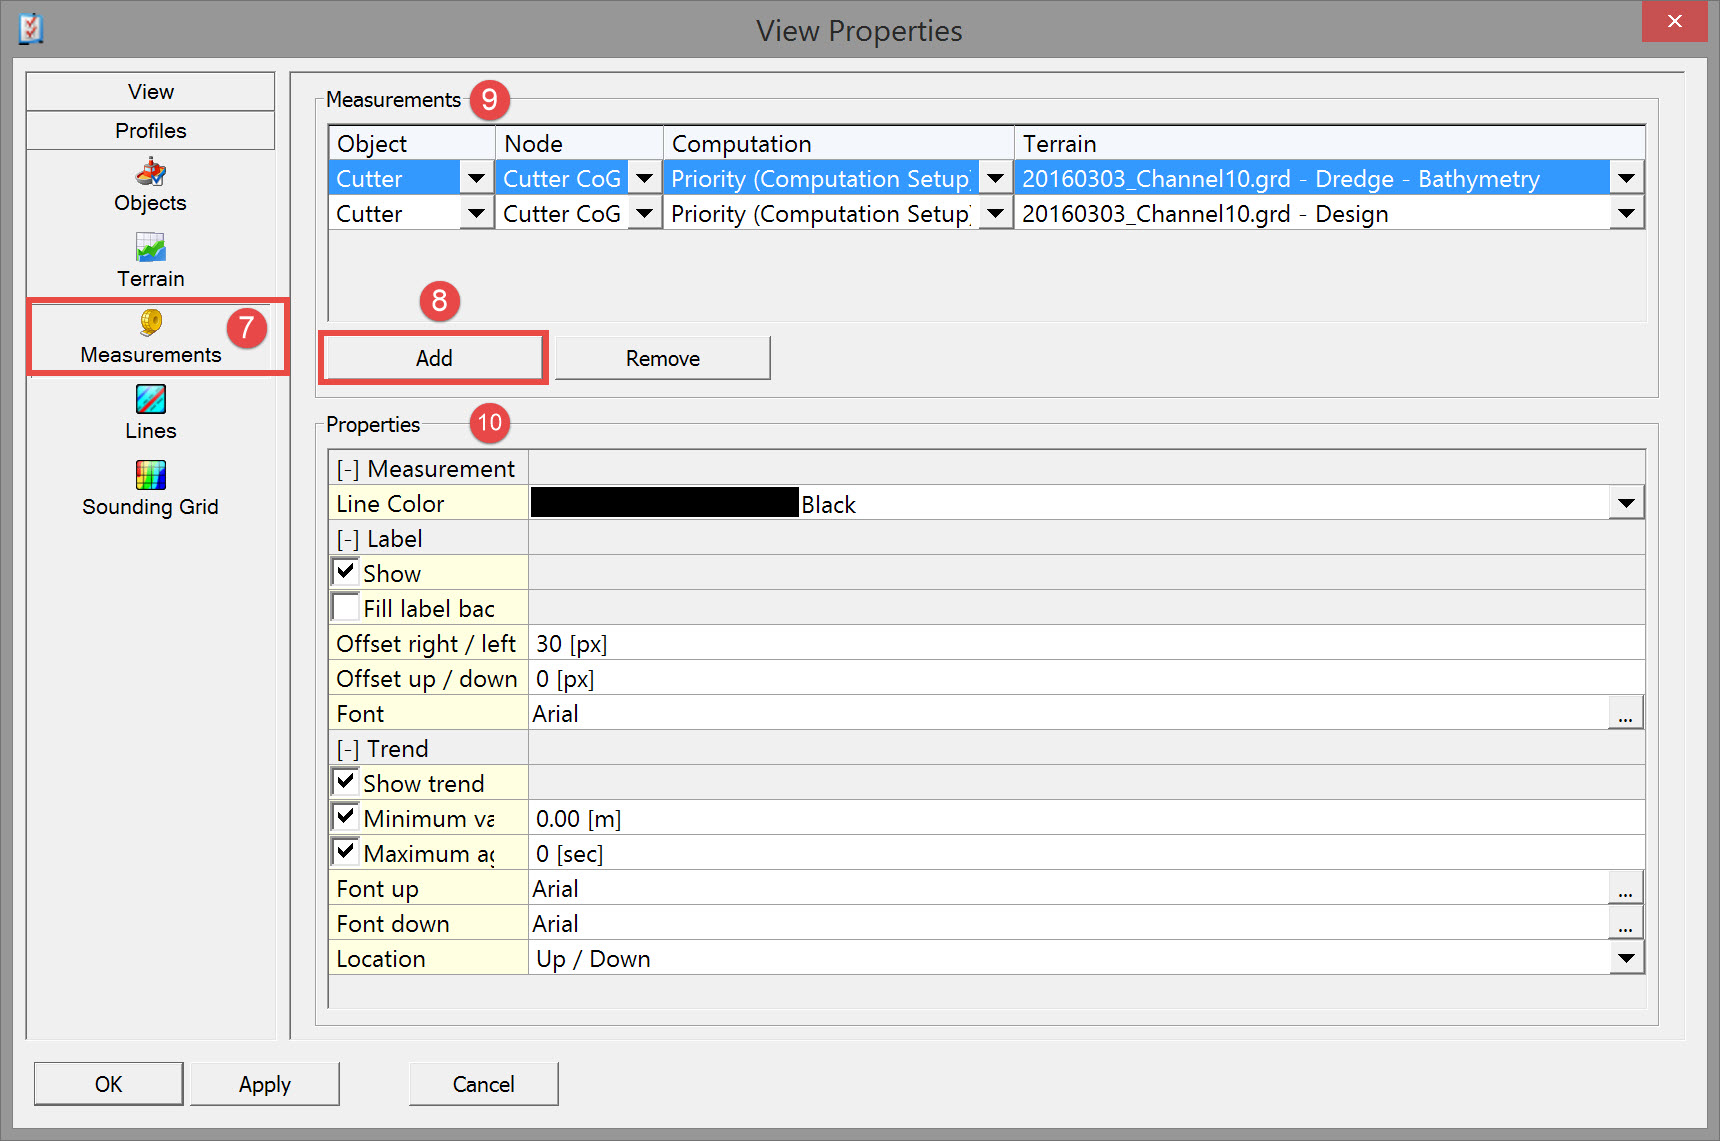


If a mapping file is selected as terrain under the Terrain menu, the active layer is set there. Only that layer is displayed here.
If a different layer is required, set it under Terrain again.
A mapping file will slow down display performance.

|
Measurement |
|
|
Line Color |
Select the color to use for the measurement line drawn from node to terrain. |
|
Label |
|
|
Show |
When you choose to show the labels the next menu items appear : |
|
Fill label background |
The label is filled and the text becomes white. |
|
Offset right / left |
When no Offsets are entered, the label is drawn halfway down the measurement line (in vertical and horizontal direction).
|
|
Offset up / down |
To change the label location use an offset: -ve moves the label down, +ve moves it up. |
|
Font |
The font of the label (font, font style, size and color) can be changed using the browse button 
. |
|
Trend |
|
|
Show trend |
This option shows the trend of a measurement and is typically used during a bundle tow.
|
|
Minimum value |
If enabled, define a minimum value (in height units per second) under which a (positive or negative) trend value is not shown.
|
|
Maximum age |
If enabled, define the maximum time (in seconds) that a trend value remains visible if it is not updated for some time.
|
|
Font up |
Define the font (font, font style, size and color) of the speed value when the bundle is moving up. |
|
Font down |
Define the font of the speed value when the bundle is moving down. |
|
Location |
The location of the trend label can be selected.
|
Use the <Apply> button to see the effects of changes in the Profile Display without leaving this menu.
Return to top of page.
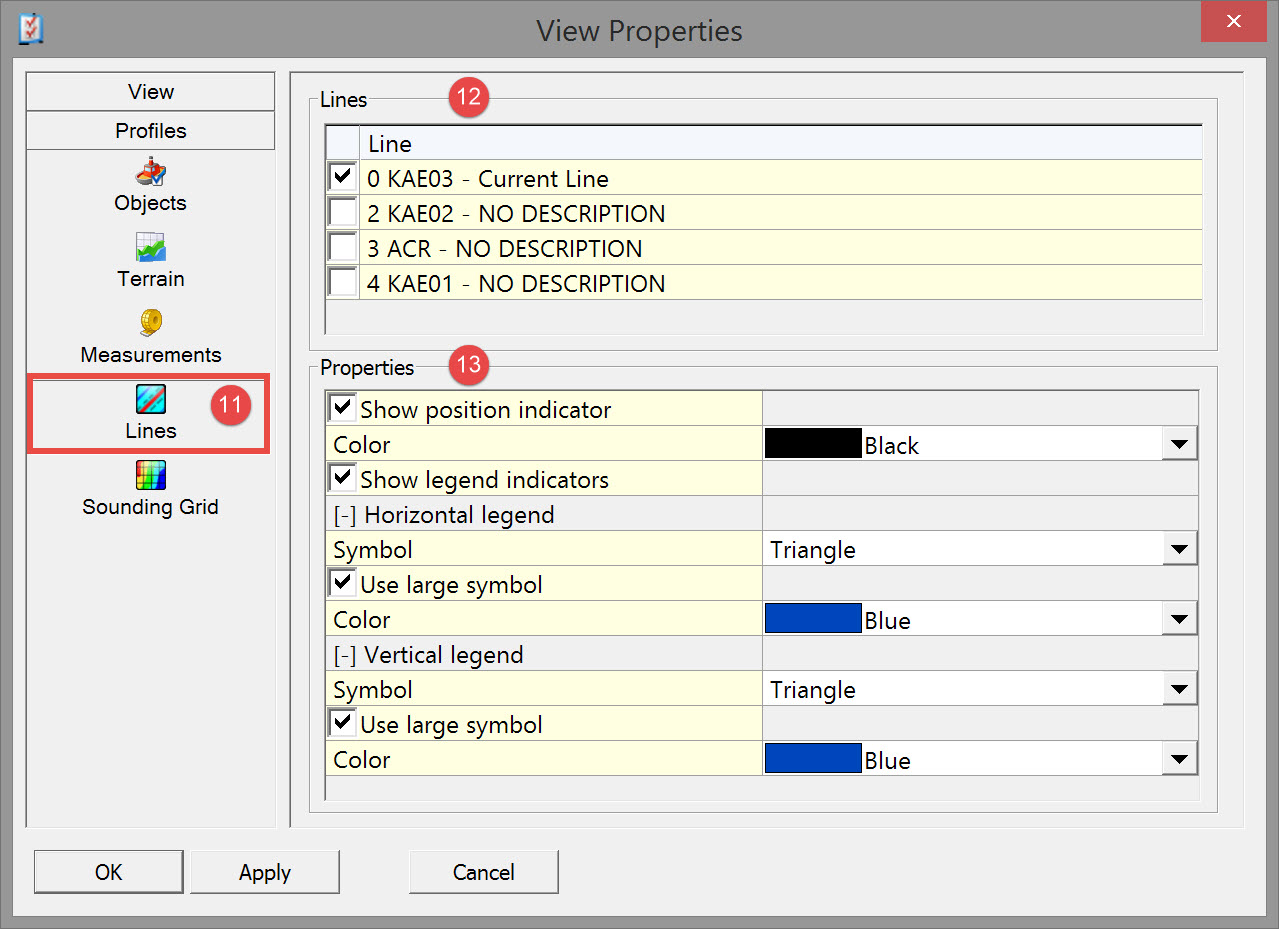
Lines




|
Properties |
|
|---|---|
|
Show position indicator |
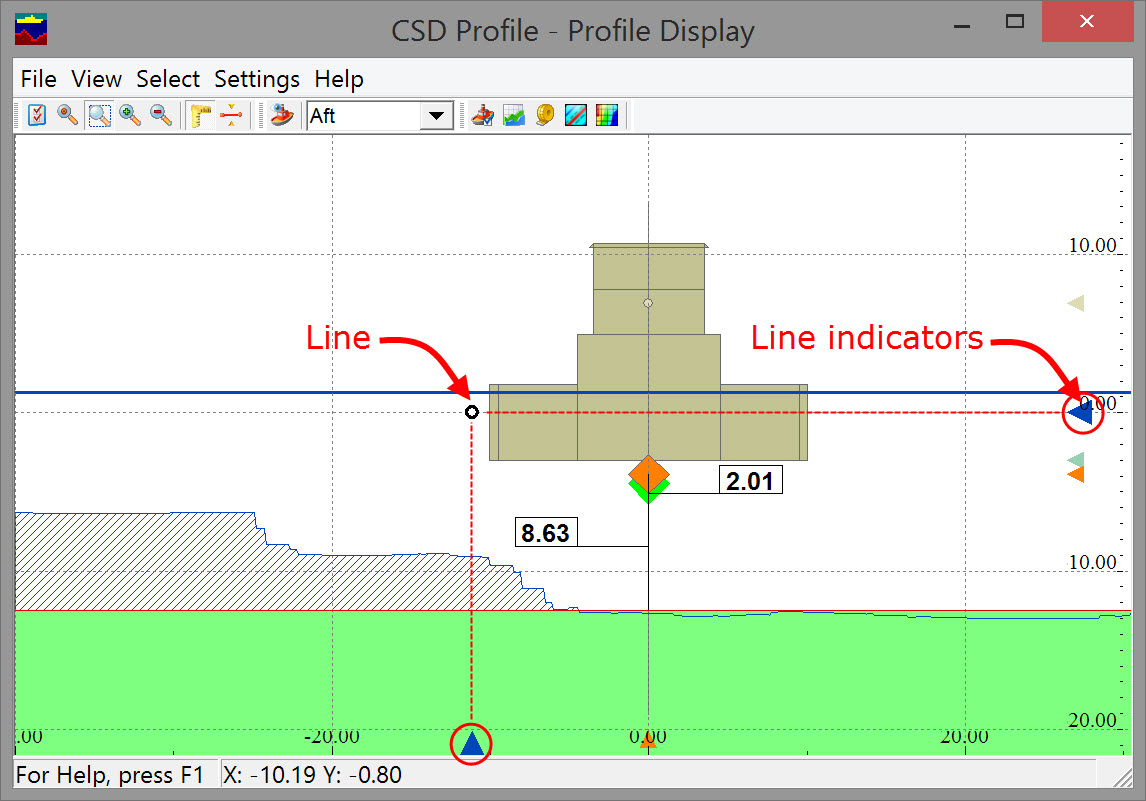
This option shows the position of the selected line as an open dot.
|
|
Show legend indicators |
Indicator symbols in the legend show the position of the line.
|
|
Horizontal legend |
|
|
Symbol |
Select a symbol from the drop down menu.
|
|
Use large symbol |
Use this for easier recognition. Only available when Triangle symbol was selected. |
|
Color |
Select a color for the symbol. |
|
Vertical legend |
|
|
Symbol |
Select a symbol from the drop down menu.
|
|
Use large symbol |
Use this for easier recognition. Only available when Triangle symbol was selected. |
|
Color |
Select a color for the symbol. |
Press <Apply> to see the effects of changes without having to leave this menu.
A line will be shown in the display as a open dot. When it has not been given a height, it will be shown at 0 meters.
Return to top of page
Sounding Grid
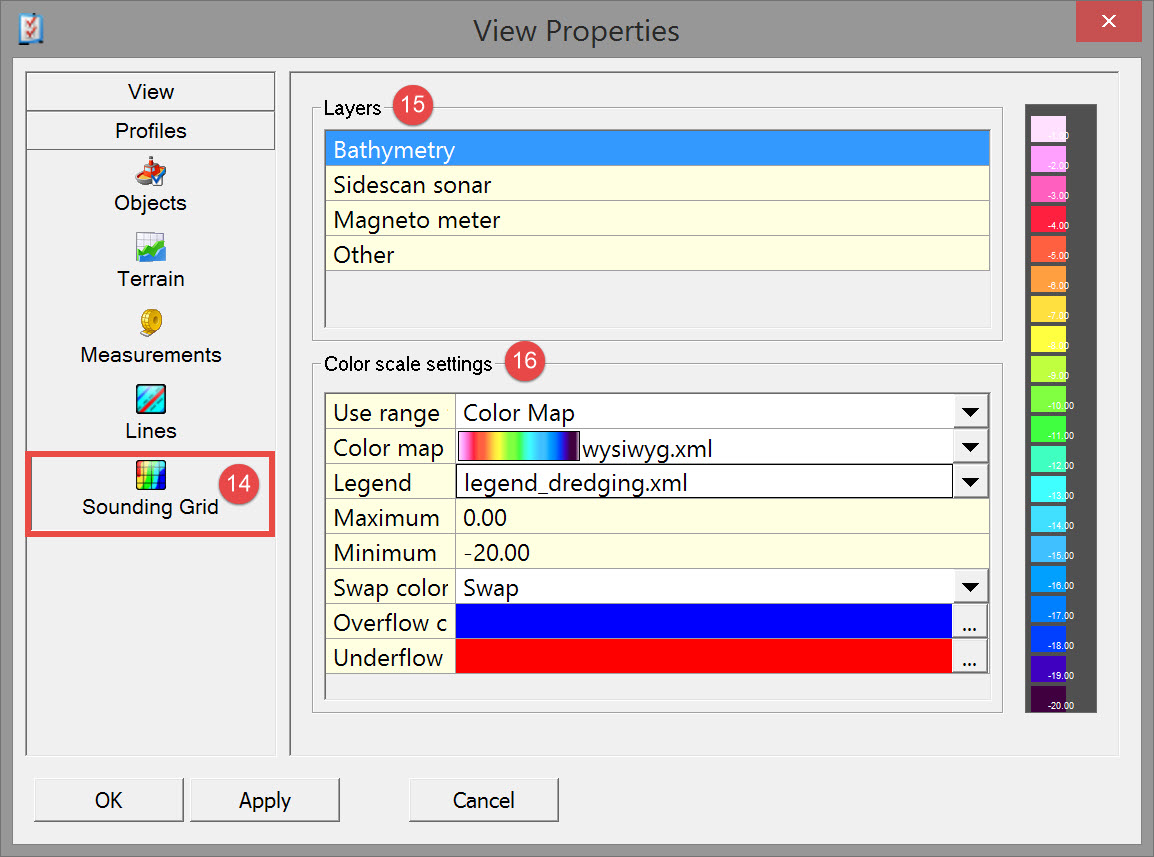
If a sounding grid is used as terrain, enter parameter values and make selections to determine how to show it.




|
Color scale settings |
|
|---|---|
|
Use range from |
Project Settings - Defined in the Console's Global Settings.
|
|
Color map |
Can only be selected if either User Defined or Color Map were chosen in the previous line. |
|
Legend |
Can only be selected if either User Defined or Color Map were chosen in the first line. |
|
Maximum and Minimum |
Are set automatically when Project Settings was selected. Otherwise they can be entered manually. |
|
Swap color map |
The colors are used in the opposite way. See color range bar on the right. |
|
Overflow and Underflow Color |
Choose the colors to use when data falls outside the entered maximum and minimum ranges.
button to modify these colors. |
Press <Apply> to see the effects of changes without having to leave this menu.
Return to top of page.
Return to CSD - Online Displays.
View Properties - View
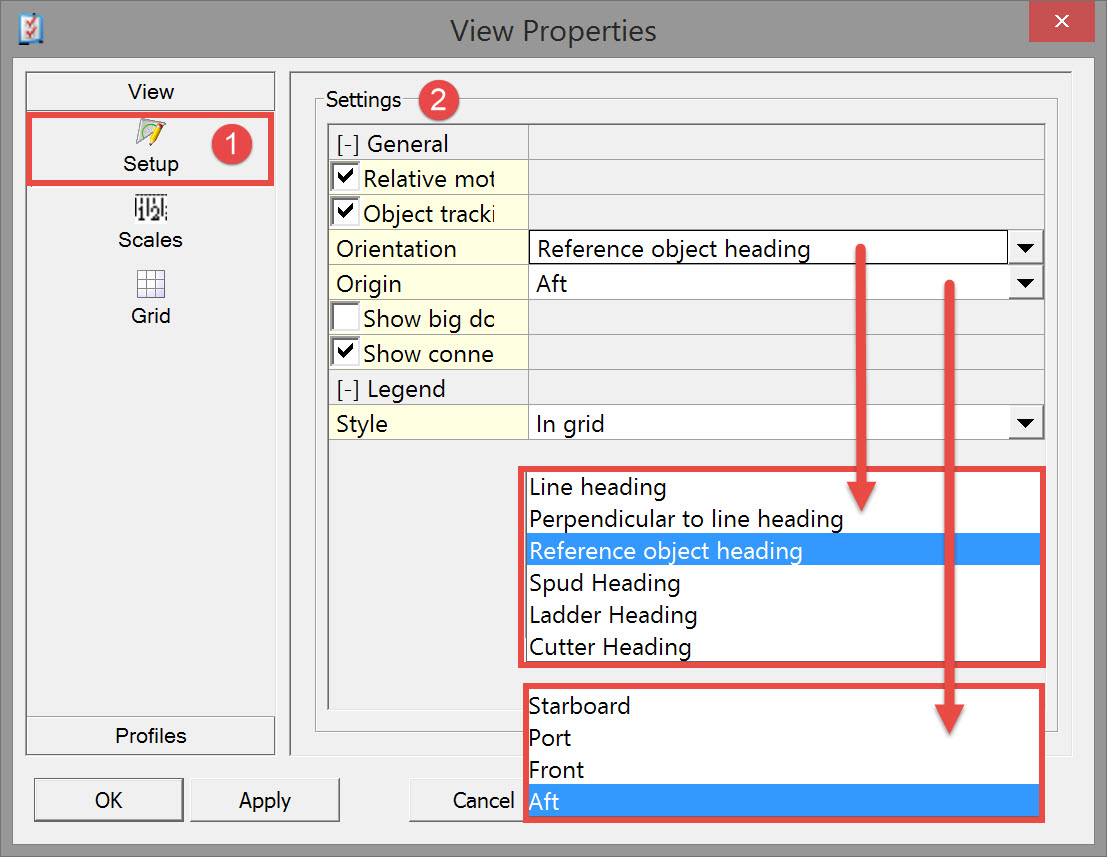
Setup


|
General |
|
|
Relative motion |
When Relative motion is on, the object remains in the center of the display; only the terrain is moved.
|
|
Object tracking |
Option only available when Relative motion has been activated.

in the toolbar can be used at all times while on-line.
|
|
Orientation |
The object can be viewed relative to a line heading or to the heading of any of the calculated objects/nodes. |
|
Origin |
Select which view of the object is displayed in the main panel. The view is projected onto the line if Orientation was set relative to a line heading. |
|
Show big dots |
The nodes are shown as big dots for easier identification. |
|
Show connected lines |
The data points from the echosounder are connected with a line. |
|
Legend |
|
|
Style |
By default the legend is drawn outside the grid. |
|
Legend |
Select a color for the legend. (Only available when drawn outside the grid.) |
Press <Apply> to see the effects of changes without having to leave this menu.
Scales


|
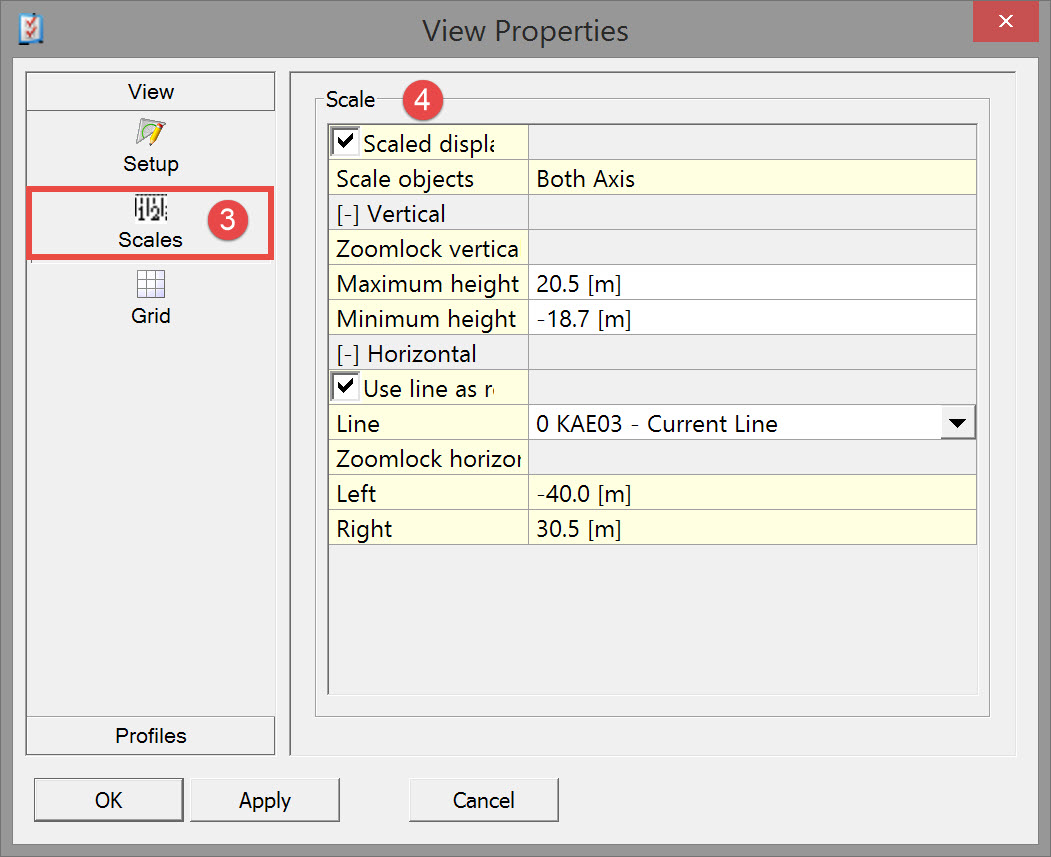
Scaled display |
When enabled this option scales the object according to the scales of both the vertical and the horizontal legends. (Does not maintain the aspect ratio of the object).
|
|
Scale objects |
When Scaled display is disabled this can be used to scale objects on one axis or both axes:
|
|
Vertical |
|
|
Zoomlock vertical range |
Lock the vertical range so it will not change when zooming in or out. |
|
Maximum height |
This is the top of the display. |
|
Minimum height |
This is the bottom of the display. |
|
Horizontal |
|
|
Use line as reference |
Used to show the object relative to a line. KP values will be shown on the horizontal axis instead of distances in survey units. |
|
Line |
When 'Use line as reference' is activated, choose an existing line from the drop down menu.
|
|
Zoomlock horizontal range |
Lock the horizontal range so it will not change when zooming in or out. |
|
Left |
The range shown to the left of the center of the display. |
|
Right |
The range shown to the right of the center of the display. |
Press <Apply> to see the effects of changes without having to leave this menu.
Grid

|
General |
|
|
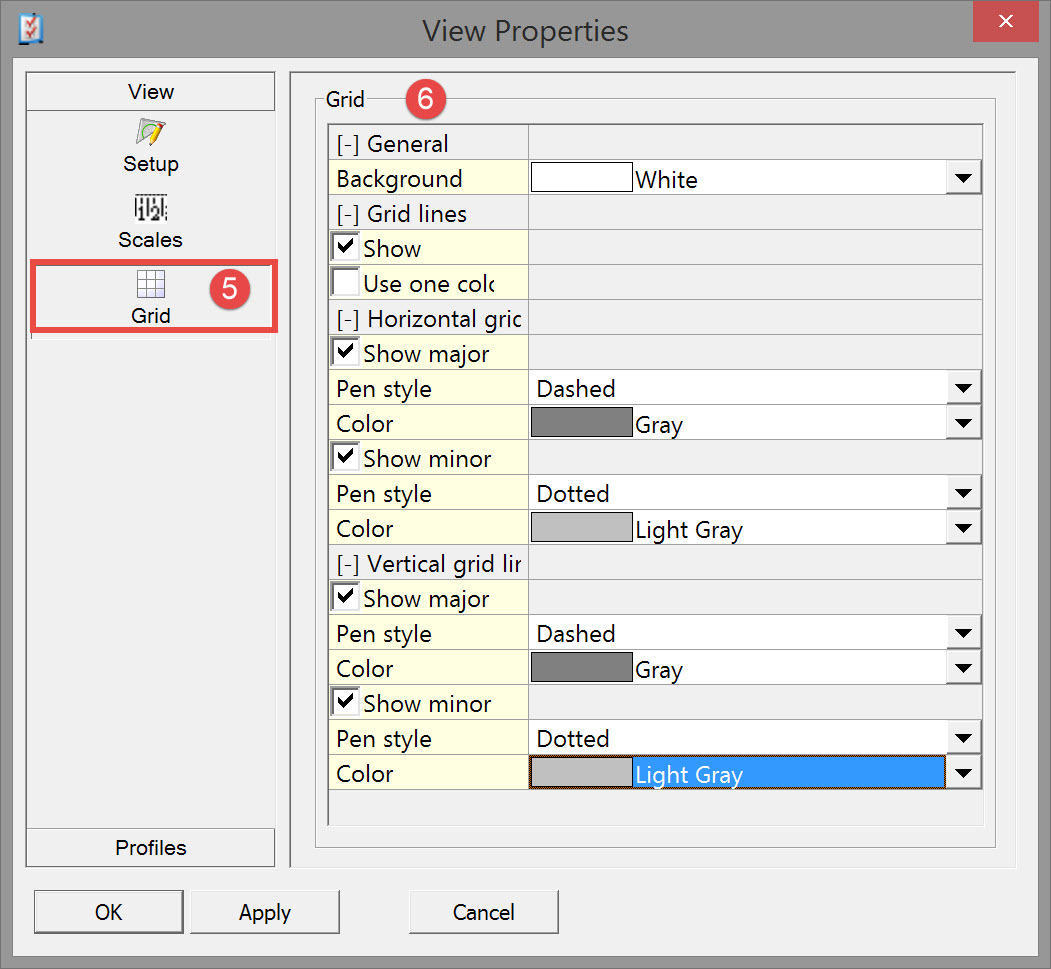
Background |
Select a color for the background of the display. |
|
Grid lines |
|
|
Show |
Uncheck to see no grid lines. When checked the following lines are shown: |
|
Use one color |
When checked all grid lines (Horizontal, Vertical, major and minor) are drawn in the same color.
|
|
Color |
Select a color for the grid lines. Only available when 'Use one color' was enabled. |
|
Horizontal grid lines |
|
|
Show major |
When checked, the major horizontal lines of the display grid will show. A pen style can be selected on the next line : |
|
Pen style |
Select a style for the major grid lines. |
|
Color |
Select a color for the major grid lines. Only available when 'Use one color' was disabled. |
|
Show minor |
When checked, the minor horizontal lines of the display grid will show. A pen style can be selected on the next line : |
|
Pen style |
Select a style for the minor grid lines. |
|
Color |
Select a color for the minor grid lines. Only available when 'Use one color' was disabled. |
|
Vertical grid lines |
|
|
Show major |
When checked, the major vertical lines of the display grid will show. A pen style can be selected on the next line : |
|
Pen style |
Select a style for the major grid lines. |
|
Color |
Select a color for the major grid lines. Only available when 'Use one color' was disabled. |
|
Show minor |
When checked, the minor vertical lines of the display grid will show. A pen style can be selected on the next line : |
|
Pen style |
Select a style for the minor grid lines. |
|
Color |
Select a color for the minor grid lines. Only available when 'Use one color' was disabled. |
Press <Apply> to see the effects of changes without having to leave this menu.
Settings
Orientation
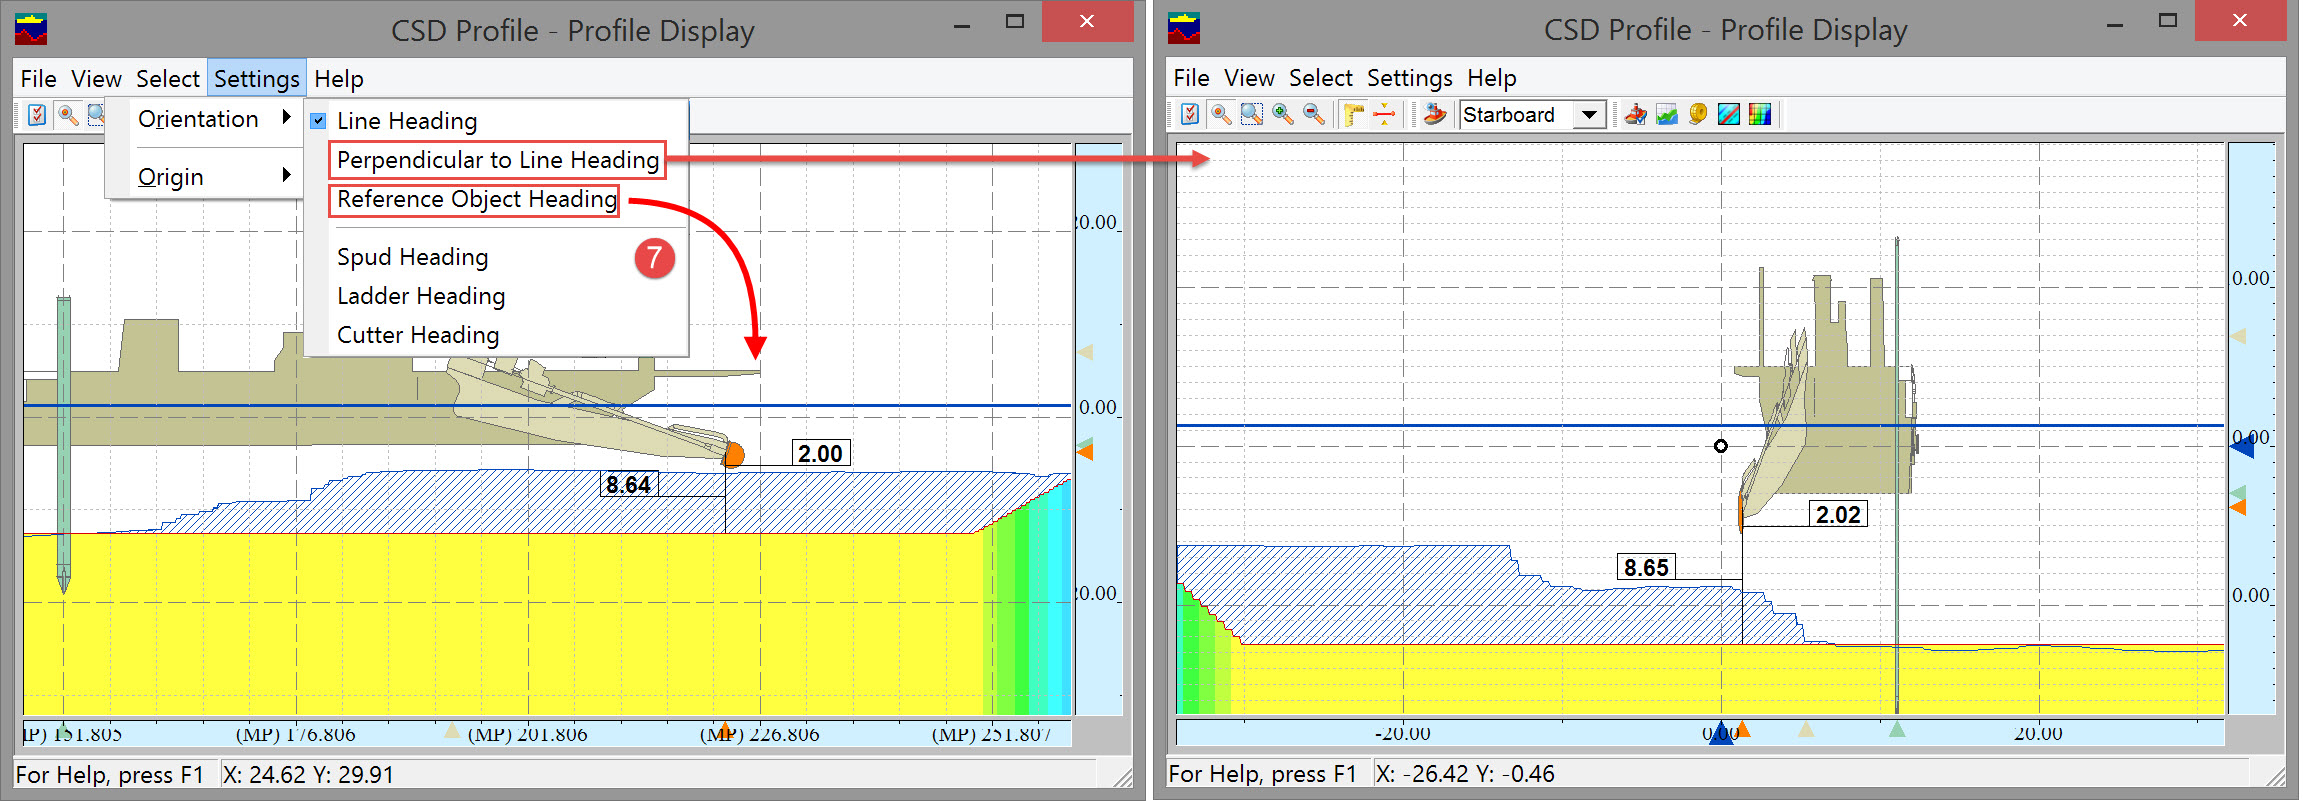
Origin
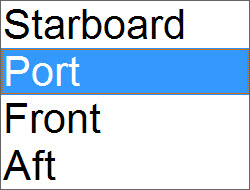
Choose the perspective with which you want to view the dredger:
Return to: top of page
Return to: CSD - Online Displays