
Timeplot Display
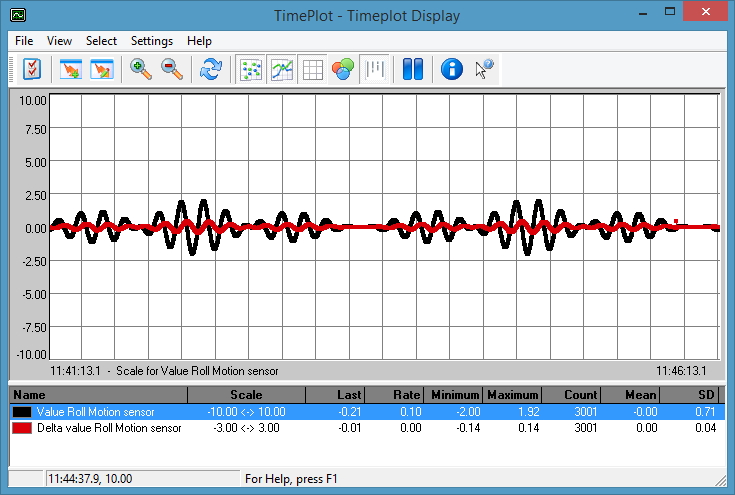
The Timeplot Display shows raw observation or computed data over a user specified period of time. Observations are displayed scrolling from right to left in a time series pane, with a numerical pane below showing last, maximum, minimum, count, mean and SD values (the statistics of the plot view).
Multiple observations of different type can be displayed in one screen, each with its own associated vertical scale and midpoint value, i.e. various scales exist simultaneously. Click on an observation in the lower pane to see what its vertical scale and mid value are set at.
A fix number can also be displayed.
Take the following steps to create and configure a Timeplot Display:


This opens the Display Manager.

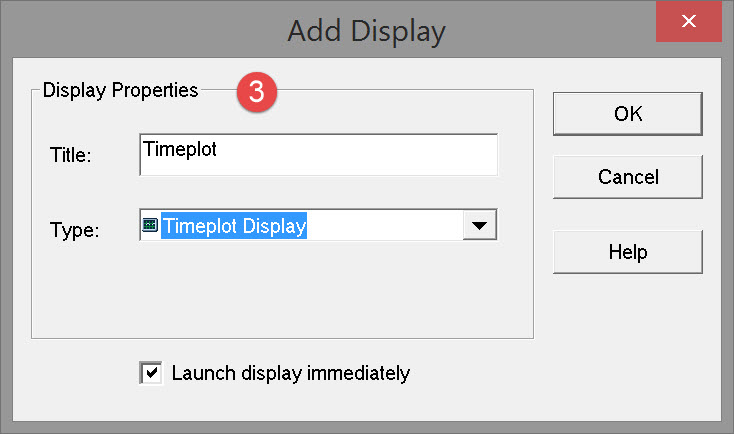

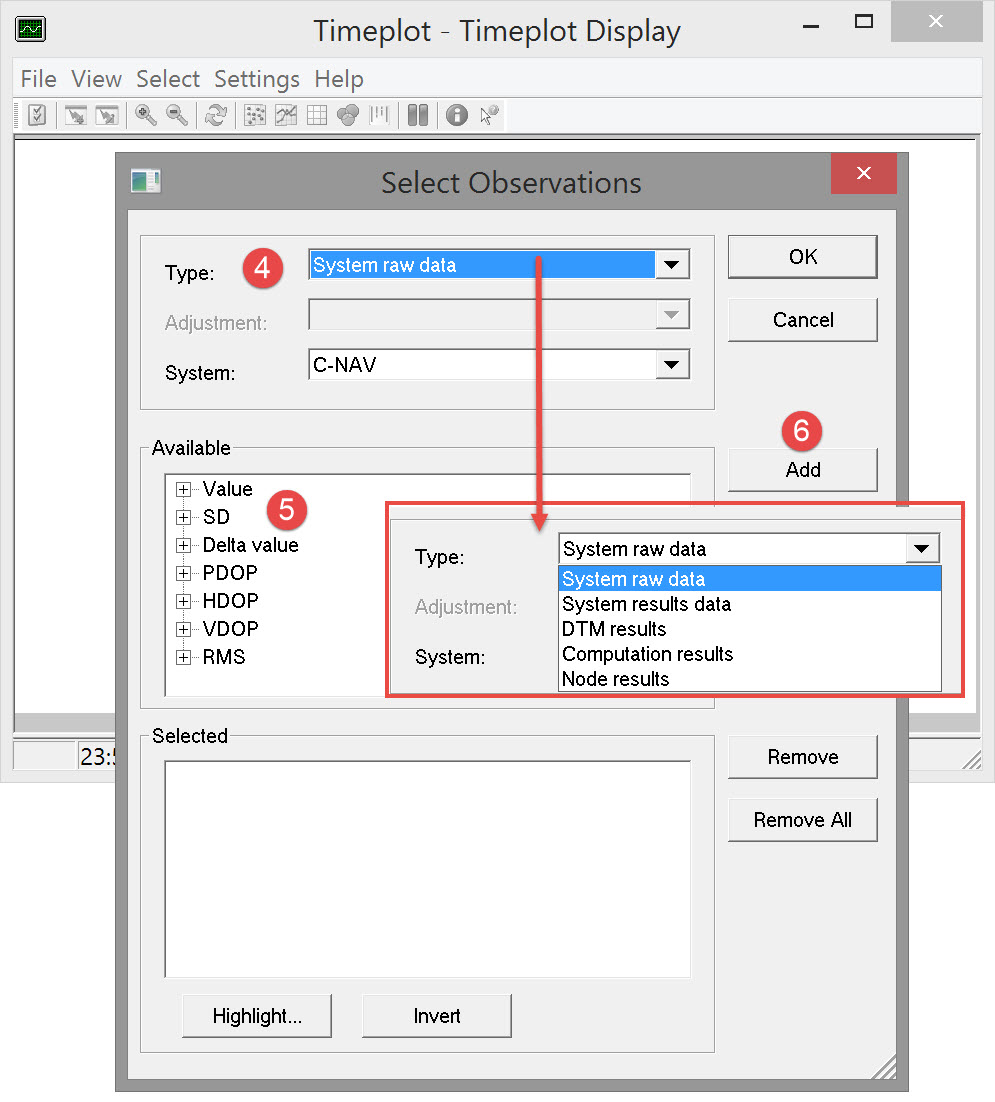
Pressing OK opens the Select Observations dialog on top of an empty Timeplot dialog:

-
-
System raw data: Raw observation values from any one or more of the systems defined in the template database.
-
System results data: Computed system observations.
-
DTM result data: Computed echosounder results (primarily multibeam).
-
Computation results data: Results from the position calculation.
-
Node result: Computed node positions.
-
For dredging the observations likely of interest are:
-
-
System Raw Data: Dredging Sensors. For example mixture velocity, mixture density, volume, weight, hopper level, status and flag.
-
System Raw Data: Draft Sensors, motion sensors, pseudo-USBL, gyro and tide.
-
System Results Data: computed tide result.
-


|
Highlight every nth observation in the list. When < Remove > is pressed, these observations are deleted.
|
|
|
The previously highlighted items are deselected. |
Repeat these steps to add observations. Multiple observations from different types may be added to the selection list.
Click here to see a listing of parameters associated with each observation type...
|
System raw data |
|
|---|---|
|
Value |
Show the actual received raw values. |
|
Quality indicator |
Show the quality of the received data. |
|
Delta value |
Show the difference between two consecutive system observations.
|
|
System results data |
|
|---|---|
|
Status |
Show status. |
|
Residual |
Show residual. |
|
W-test |
Show W-test. |
|
A priori SD |
Show a priori standard deviation. |
|
MDE |
Show Marginally Detectable Error. |
|
Ext Rel (2D) |
Show external reliability. |
|
Age |
Show age. |
|
DTM results |
|
|---|---|
|
Across distance from TD |
Show across distance from transducer head. |
|
Along distance from TD |
Show along distance from transducer head. |
|
Easting |
Show Easting local coordinates. |
|
Northing |
Show Northing local coordinates. |
|
Height |
Show beam which is corrected for sound velocity and motion. |
|
Horizontal TPE |
Show the trend of the horizontal TPE (Total propagated error or uncertainty) values for a selected beam. |
|
Vertical TPE |
Show the trend of the vertical TPE (Total propagated error or uncertainty) values for a selected beam. |
|
Computation results |
|
|---|---|
|
F-test value |
Show value for F-test. |
|
F-Test limit |
Show limit for F-Test. |
|
Number of iterations |
Show number of iterations. |
|
Number of observations |
Show number of observations. |
|
Number of unknowns |
Show number of unknowns. |
|
Number of rejections |
Show number of rejections. |
Node results
|
|
|---|---|
|
Easting/Northing/Height |
Show Easting/Northing/Height in local coordinates for the selected node. |
|
Latitude/Longitude |
Show Latitude/Longitude in local coordinates for the selected node. |
|
SOG/COG |
Show the Speed/Course Over Ground of the selected node. |
|
Heading |
Show the heading of the object upon which the selected node is located. |
|
Pitch/Roll |
Show the pitch/roll of the object upon which the selected node is located. |
|
2D Distance Raw-Filtered |
Show the 2D distance between the raw and the filtered observation of the selected node. |
|
Height Diff Raw-Filtered |
Show the height difference between the raw and the filtered observation of the selected node. |
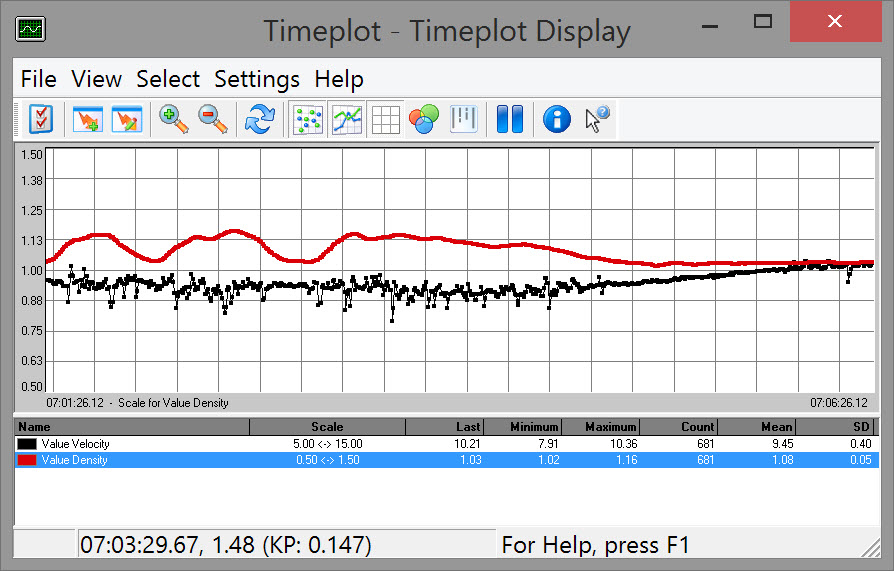
Select “OK” to complete the selection. The Timeplot dialog lists the chosen observations:
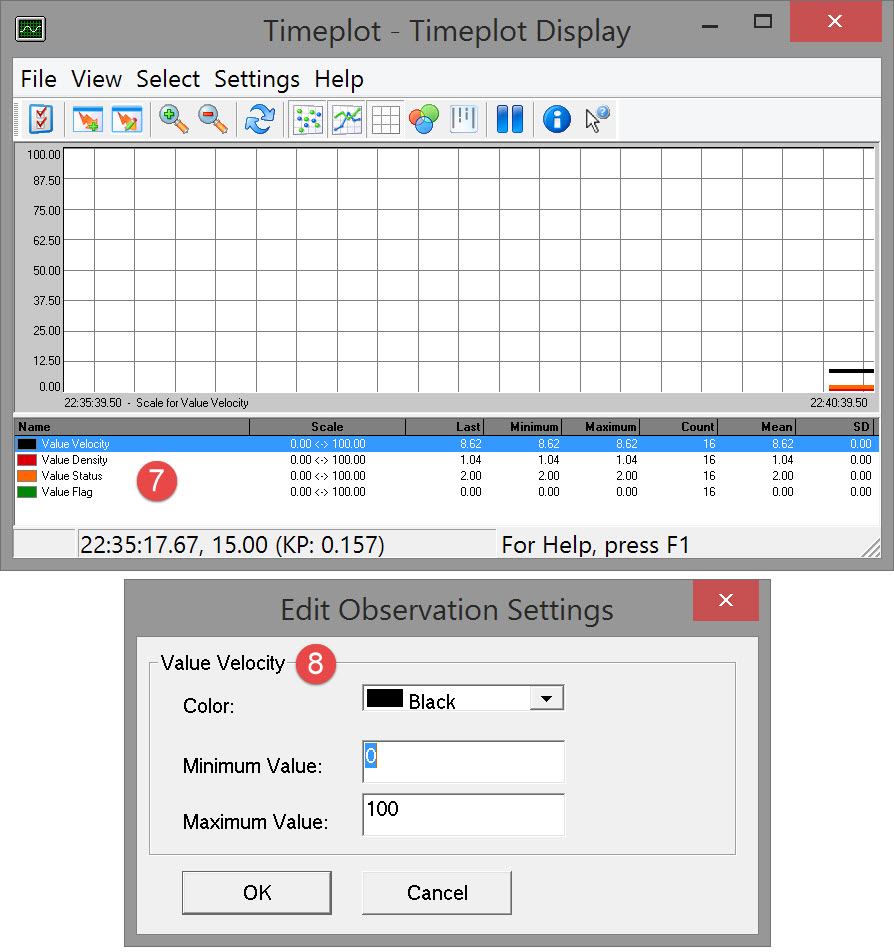
The values start to scroll from right to left. Initially vertical scales take on default values which in most cases need modification. Default colors may also need changing.


|
Button |
Description |
|---|---|

|
Opens the Select Observations dialog where changes are made to add and remove observations. |

|
Opens the Observation Settings dialog. Click on an observation and press Edit. |

|
Opens the View Properties dialog. All parameters are fairly self explanatory. If not, expand the link below. |
Return to: top of page
Return to: CSD - Online Displays