The Line Database Manager (LDM) is used to create survey lines, routes (polylines) and points for use in planning, conducting and processing a survey. These entities can also be imported from various formats. Once created they can be exported to various formats.
Line Database Manager - Program Status
Read more...
At time of writing (Apr. 2015) two versions of the program are accessible from two locations:
-
Newer: The Line Tools Ribbon Tab in the Processing Manager (newer functionality using in-house developed format QGF).
-
Original: The icon

All point, line and route data was originally stored in a *.PRO file, which is the native format for Terramodel. This is still the case when starting the utility directly from the Console.
When creating line files in the Processing Manager, data is stored in the newer QPS developed format (*.QGF file).
During the transition period away from PRO to QGF any existing *.PRO files are automatically converted to equivalent *.QGF files, meaning both files co-exist side by side.
A *.QGF file is automatically updated when changes are made in a *PRO file.
Creating line files from the Processing Manager offers the advantage of background geographical information, e.g. ENCs, DXF, Geotiff, KML.
Being much older, the original program does not provide this contextual benefit.
This Howto concentrates on using the Line Tools in the Processing Manager.
However, both share almost identical functionality so that this Help is easily adaptable to the older program. Note that the older program has its own help pages too.
Currently (Apr. 2016) the original LDM is still needed to generate DTM links.
Tools in the online Navigation Display provide interaction with Line Database files - please refer to Online Help pages.


Create a New Line File
Before any points, lines and/or polylines can be created, a Line Database File must exist.
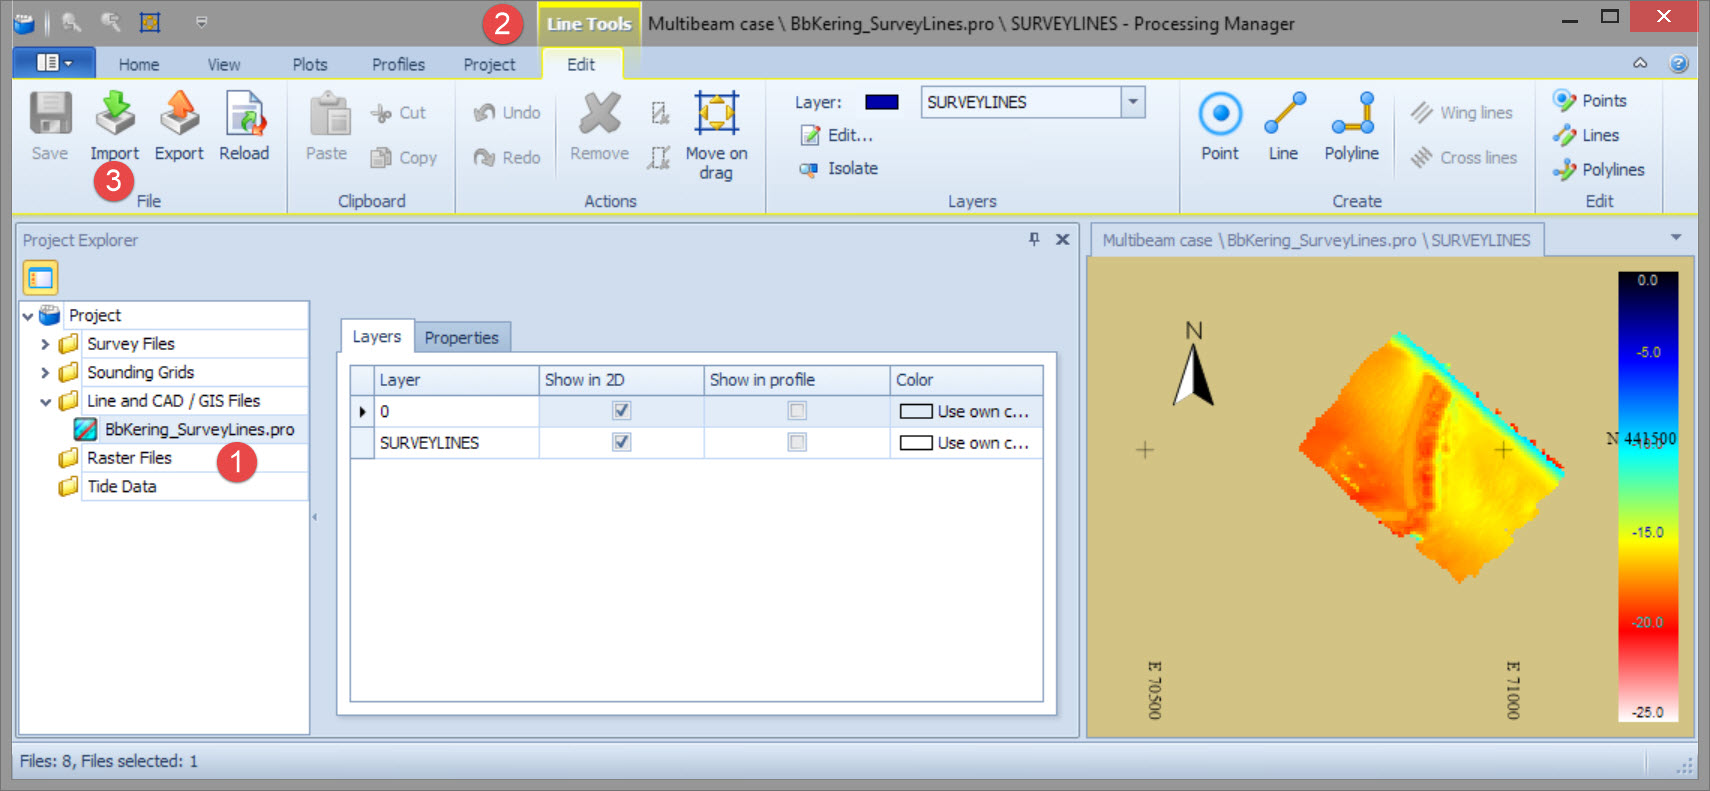
In the Processing Manager:

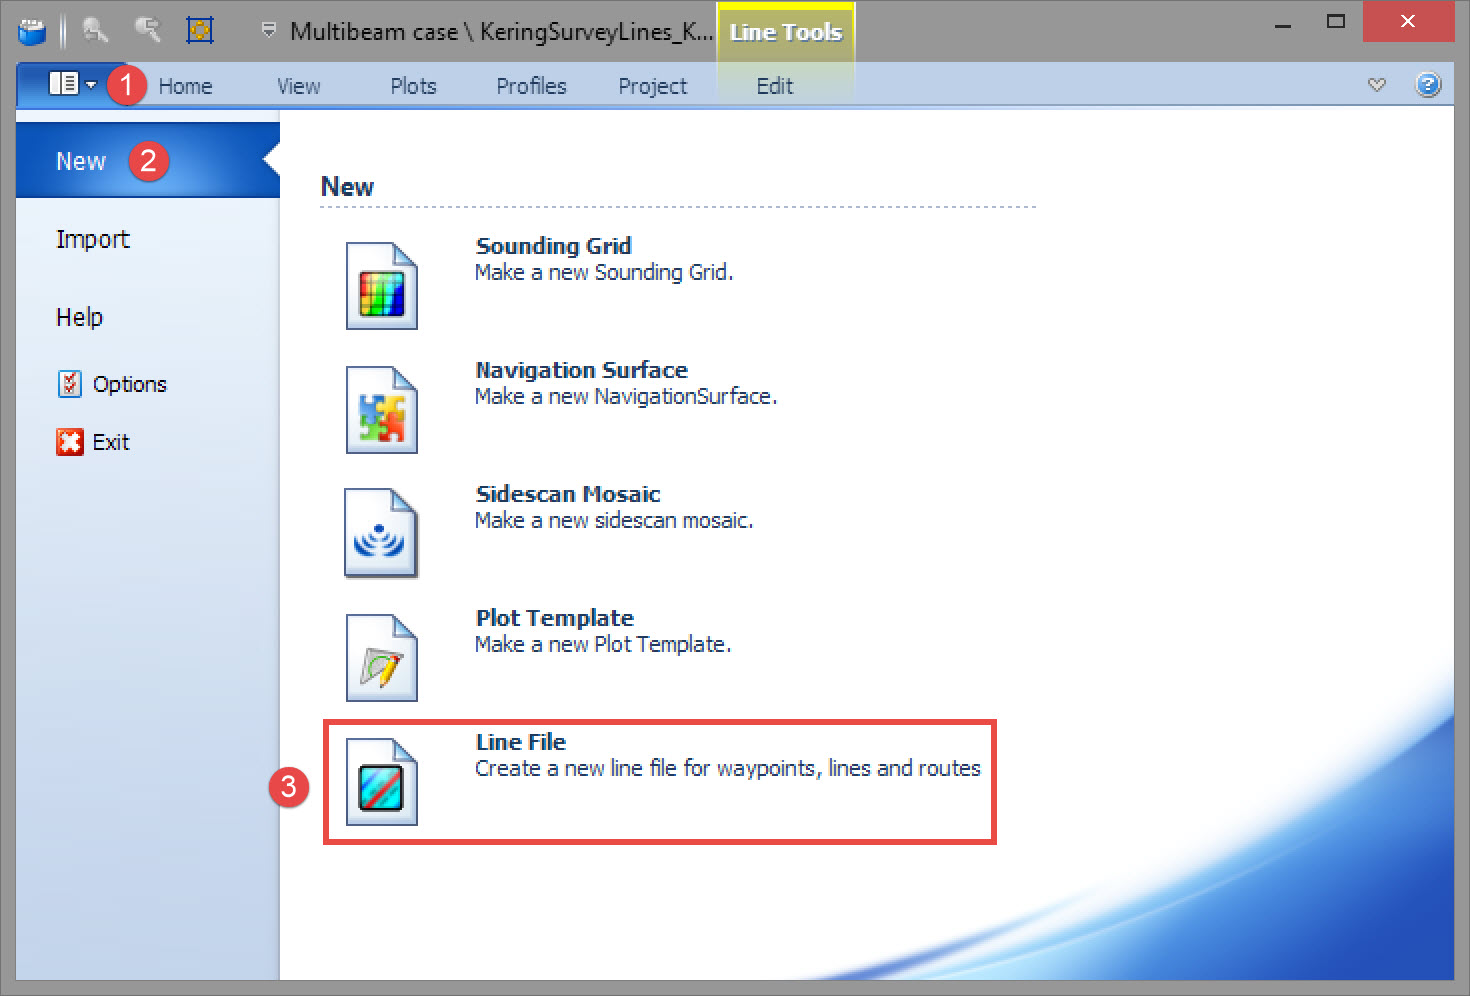


Enter a file name. Click on Save.
The new Line File is stored under the current project in the folder \LineData (unless a specific common files folder is set in the Console).
The new line file is listed in the Project Explorer window.
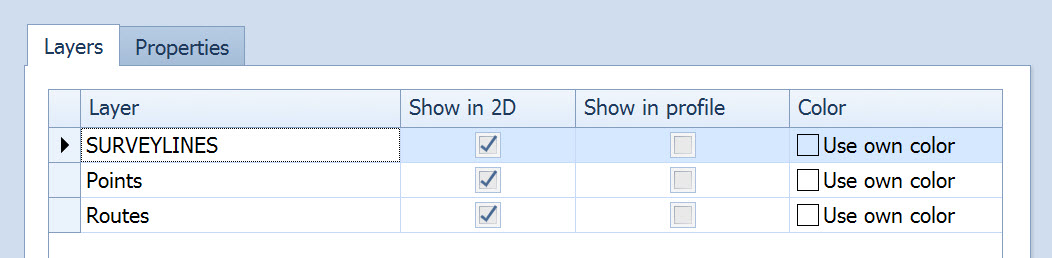
A SURVEYLINES layer is automatically created. This name may be changed and additional layers generated.
Clicking on the line file name and then the Edit tab opens the Line Tools ribbon.
Press the Edit tab under the Line Tools tab to activate the Line Planning tools:

The Line Tools tab only becomes active when a Line Database (listed under Line and CAD / GIS Files) is selected in Project Explorer window.
Return to top of page.
Add Layers
To organize points, lines and routes used, perhaps, for different purposes, it is useful to add layers to the single layer created in the new *.qgf file.

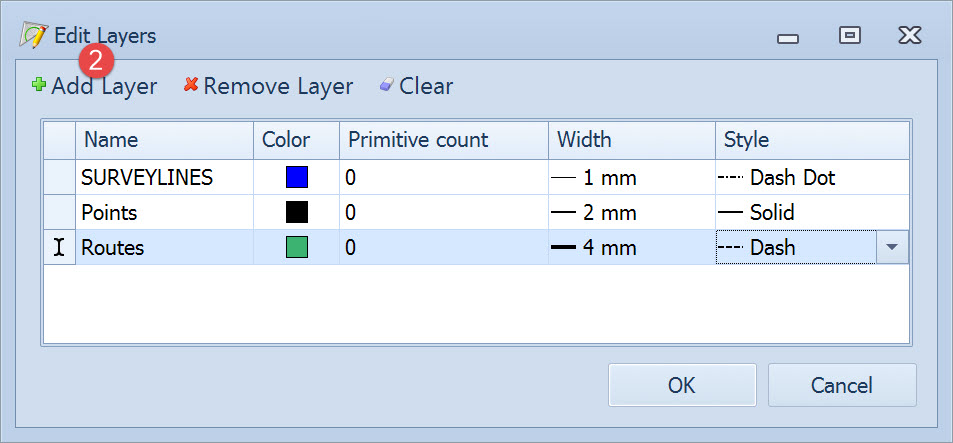

Set colors, pen widths and line style. Primitive Count refers to the number of elements in each layer.
Return to top of page.
Create Point, Line, Polyline and Area Objects
Point, line, route and/or area data now needs to be added.
Make sure the focus is on the line database created and on the layer in which the objects are to be added.


For a Point, click once with the left mouse button, then click the right mouse button to end the drawing mode.
To create a point with a radius, hold down the CTRL button.
For a Line, click two points with the left mouse button, then click the right mouse button to end the drawing mode.
For a Polyline (route), click multiple points with the left mouse button, then click the right mouse button to end the drawing mode.
For an Area click the vertex points of the area with the left mouse button, then click the right mouse button to end the drawing mode.
Make sure to click on or near the first point to create a closed boundary. In the plan view the figure then fills with a default grey color.
The Shift button can also be used when closing the area boundary. This will automatically invoke the extra options for defining an area.

If not activated, the boundary of the area is stored as a polyline and it cannot be filled with a color.
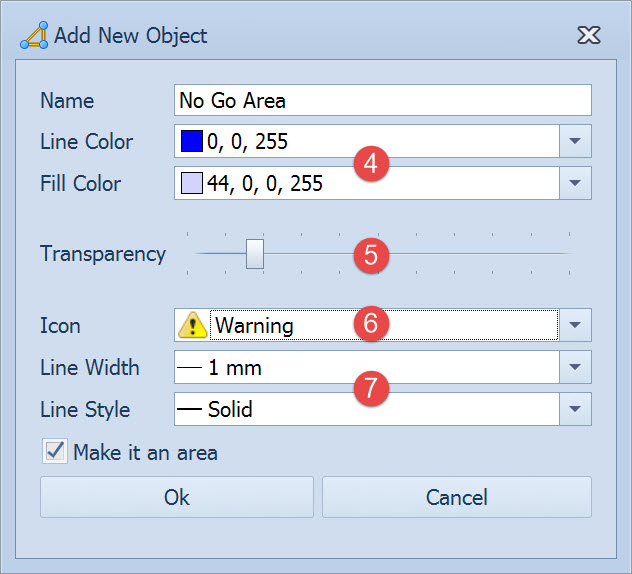


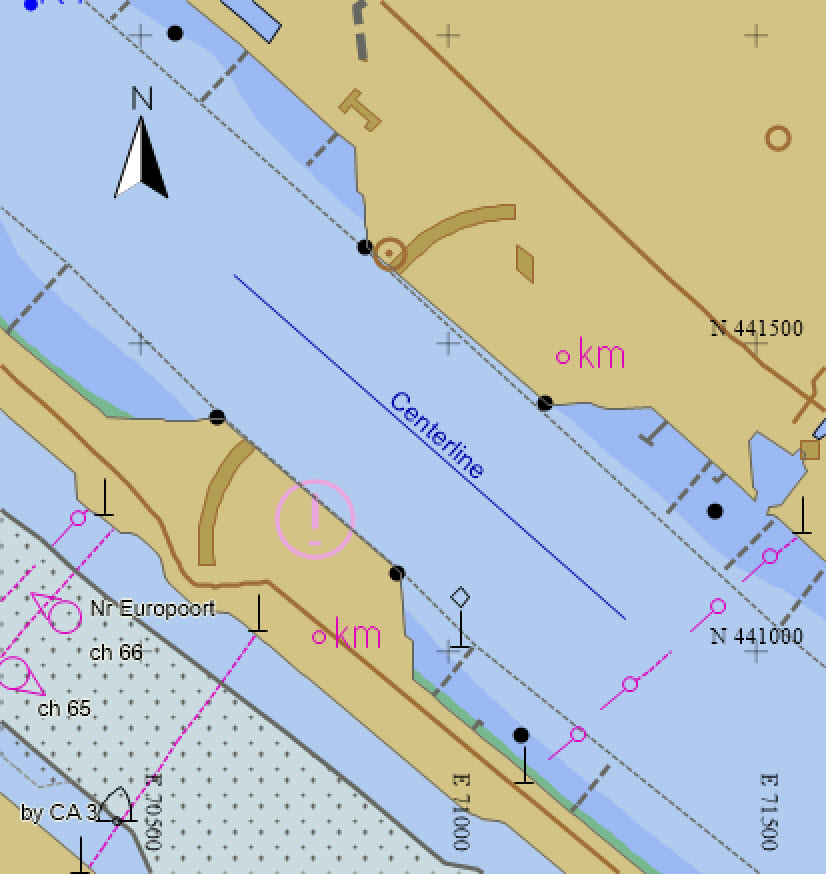
Avoidance objects can be created in the Line Database Manager.
To define an entire area make sure the last polyline point is identical to the first (i.e. is a closed polygon). Then it is automatically recognized as an area. Note that only a 2D check is carried out on area's.
3D Checks are carried out only on polylines that are NOT closed; of course the height should be filled in properly in the Line Database Manager.
In dredging work, the deepest point of the dredge head model is used to calculate the clearance between dredge head and avoidance object.
Return to top of page.
Generate Wing Lines
Wing lines are simply lines generated parallel to a single baseline or polyline. Creating wing lines requires that a line or polyline be defined first.
Before generating any wing lines, make sure to select the layer on which they must be stored.
Single Line
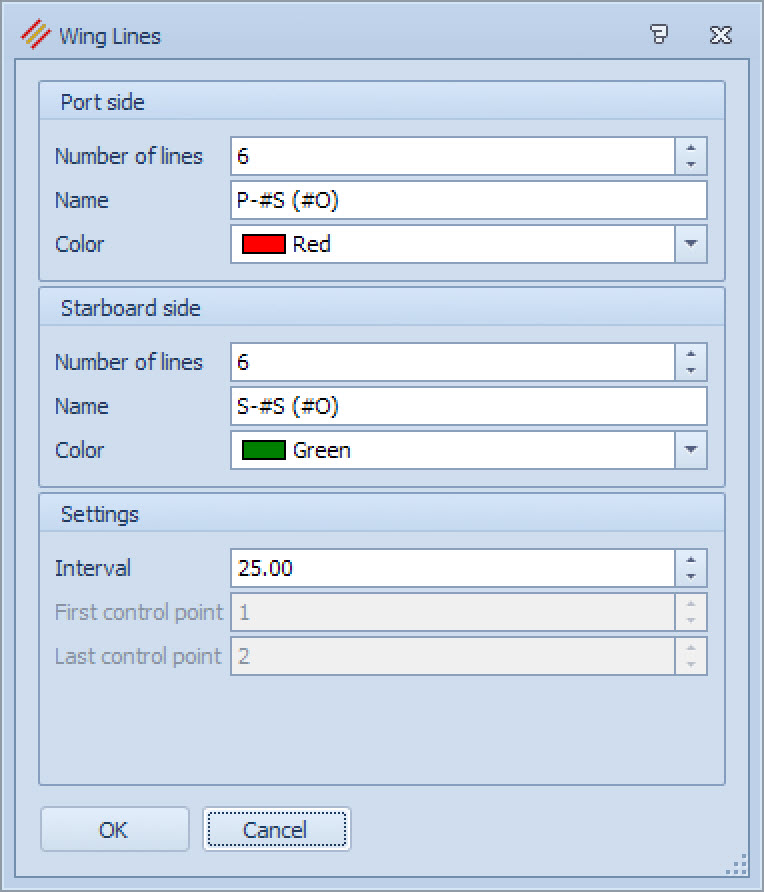

Use the Up/Down arrows to increase/decrease the displayed value by 1 (5m for wingline interval).
The naming convention is:
#S: Sequence number
#N: Name of along line
#O: Absolute offtrack
#o: Offtrack
All other text can be added optionally
Press OK to start the creation of the wing lines.


Return to top of page.
Polyline/Route
The 'Wing lines' (and 'Cross lines') commands become active.
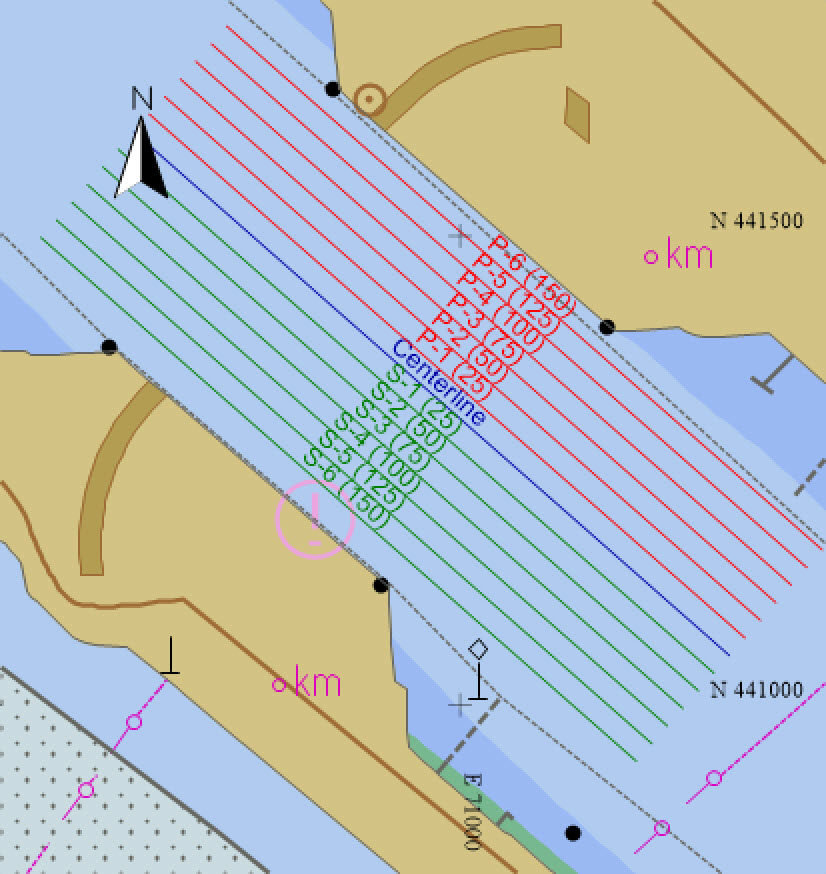
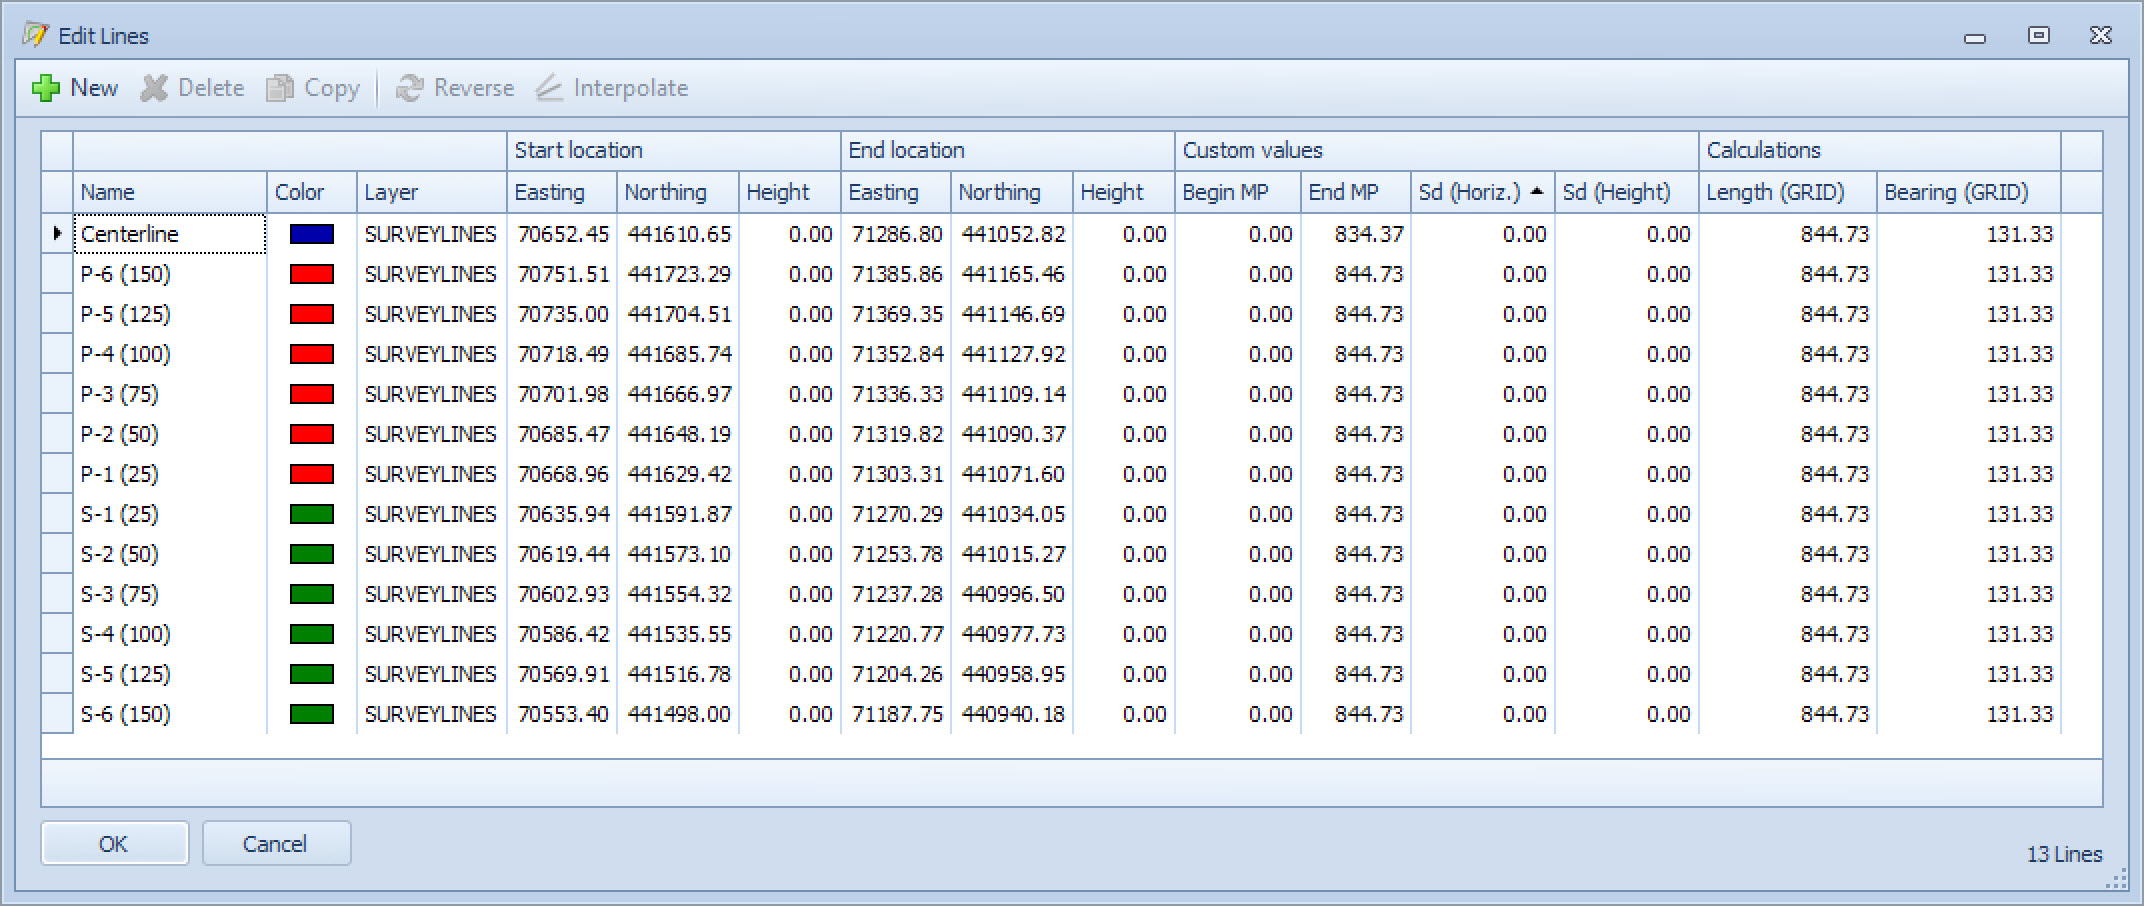
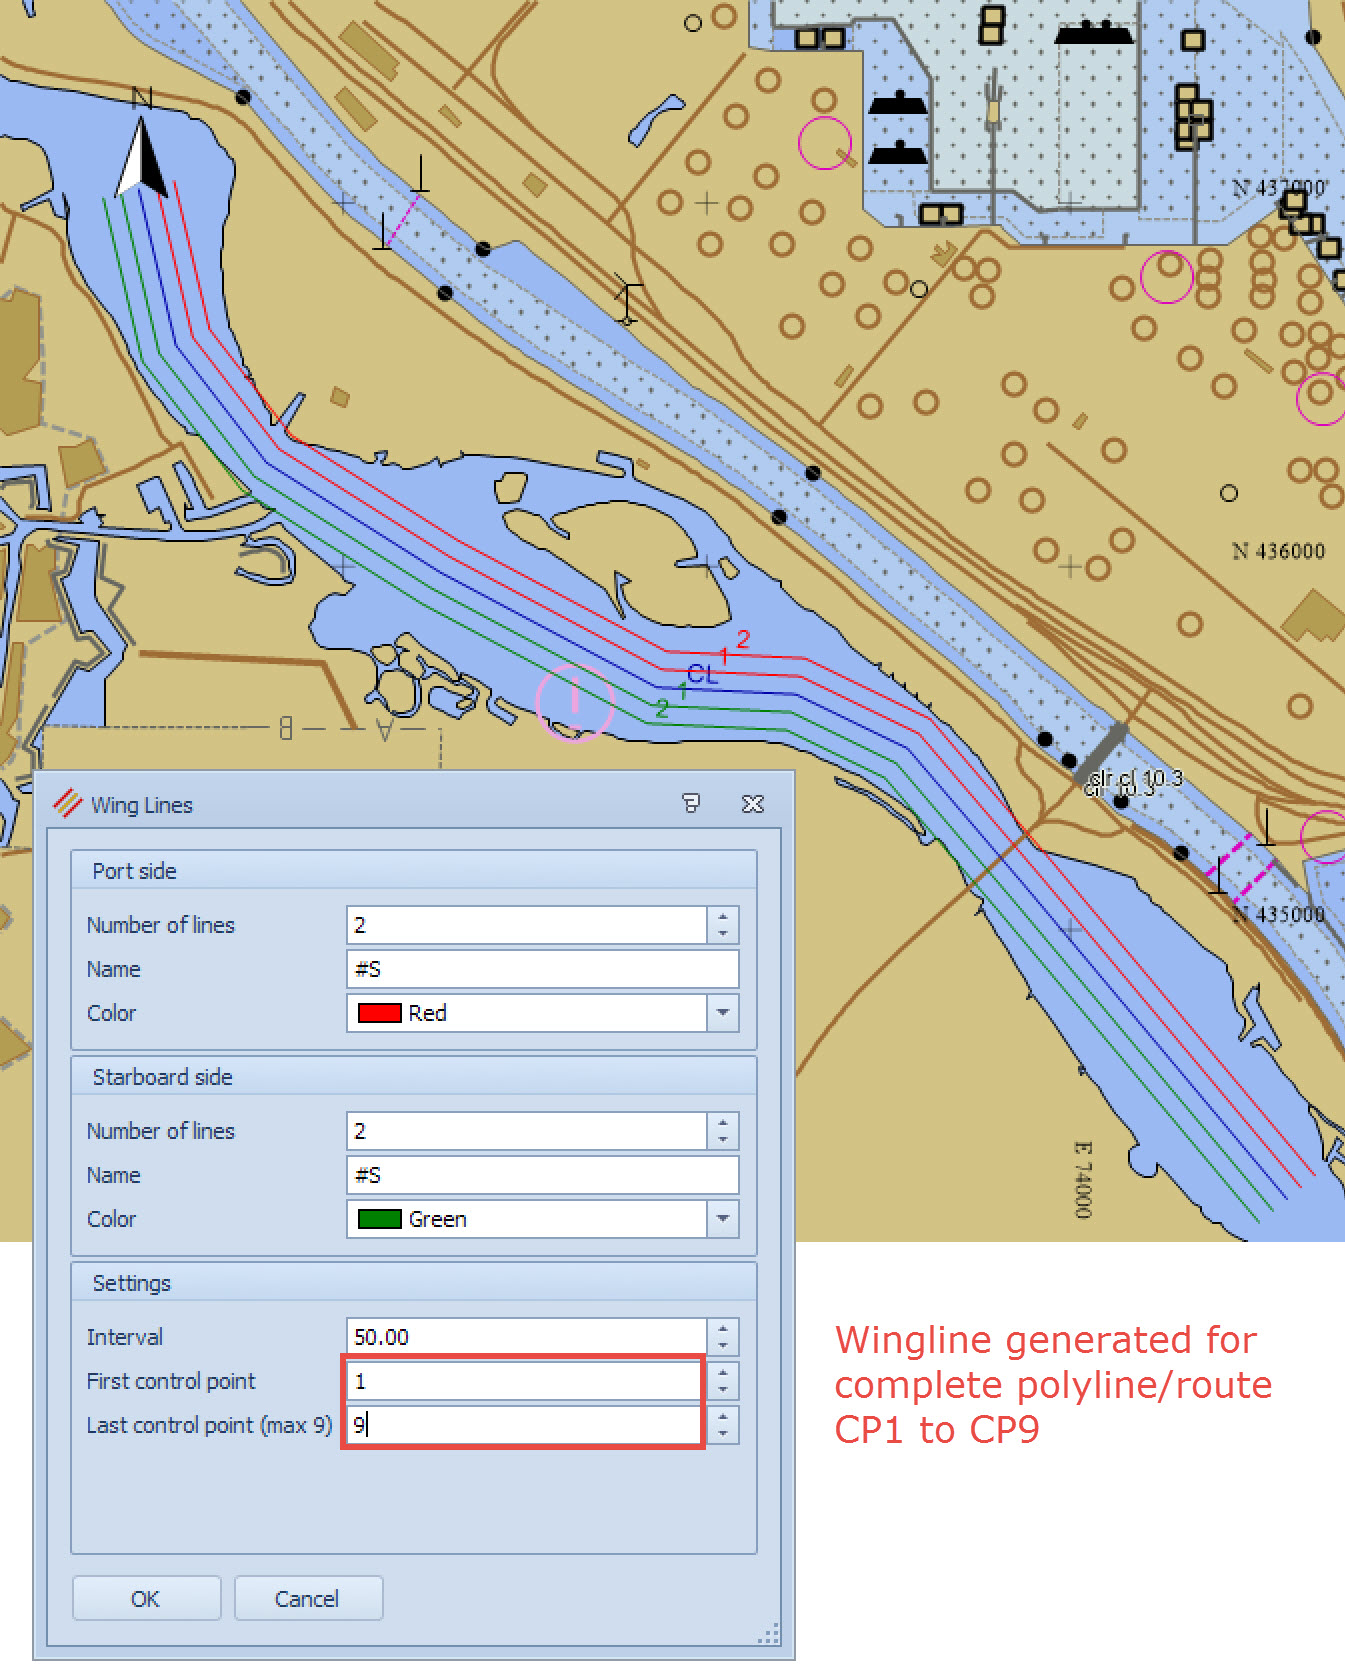
This image shows the settings and result when generating wing lines for the entire polyline/route:
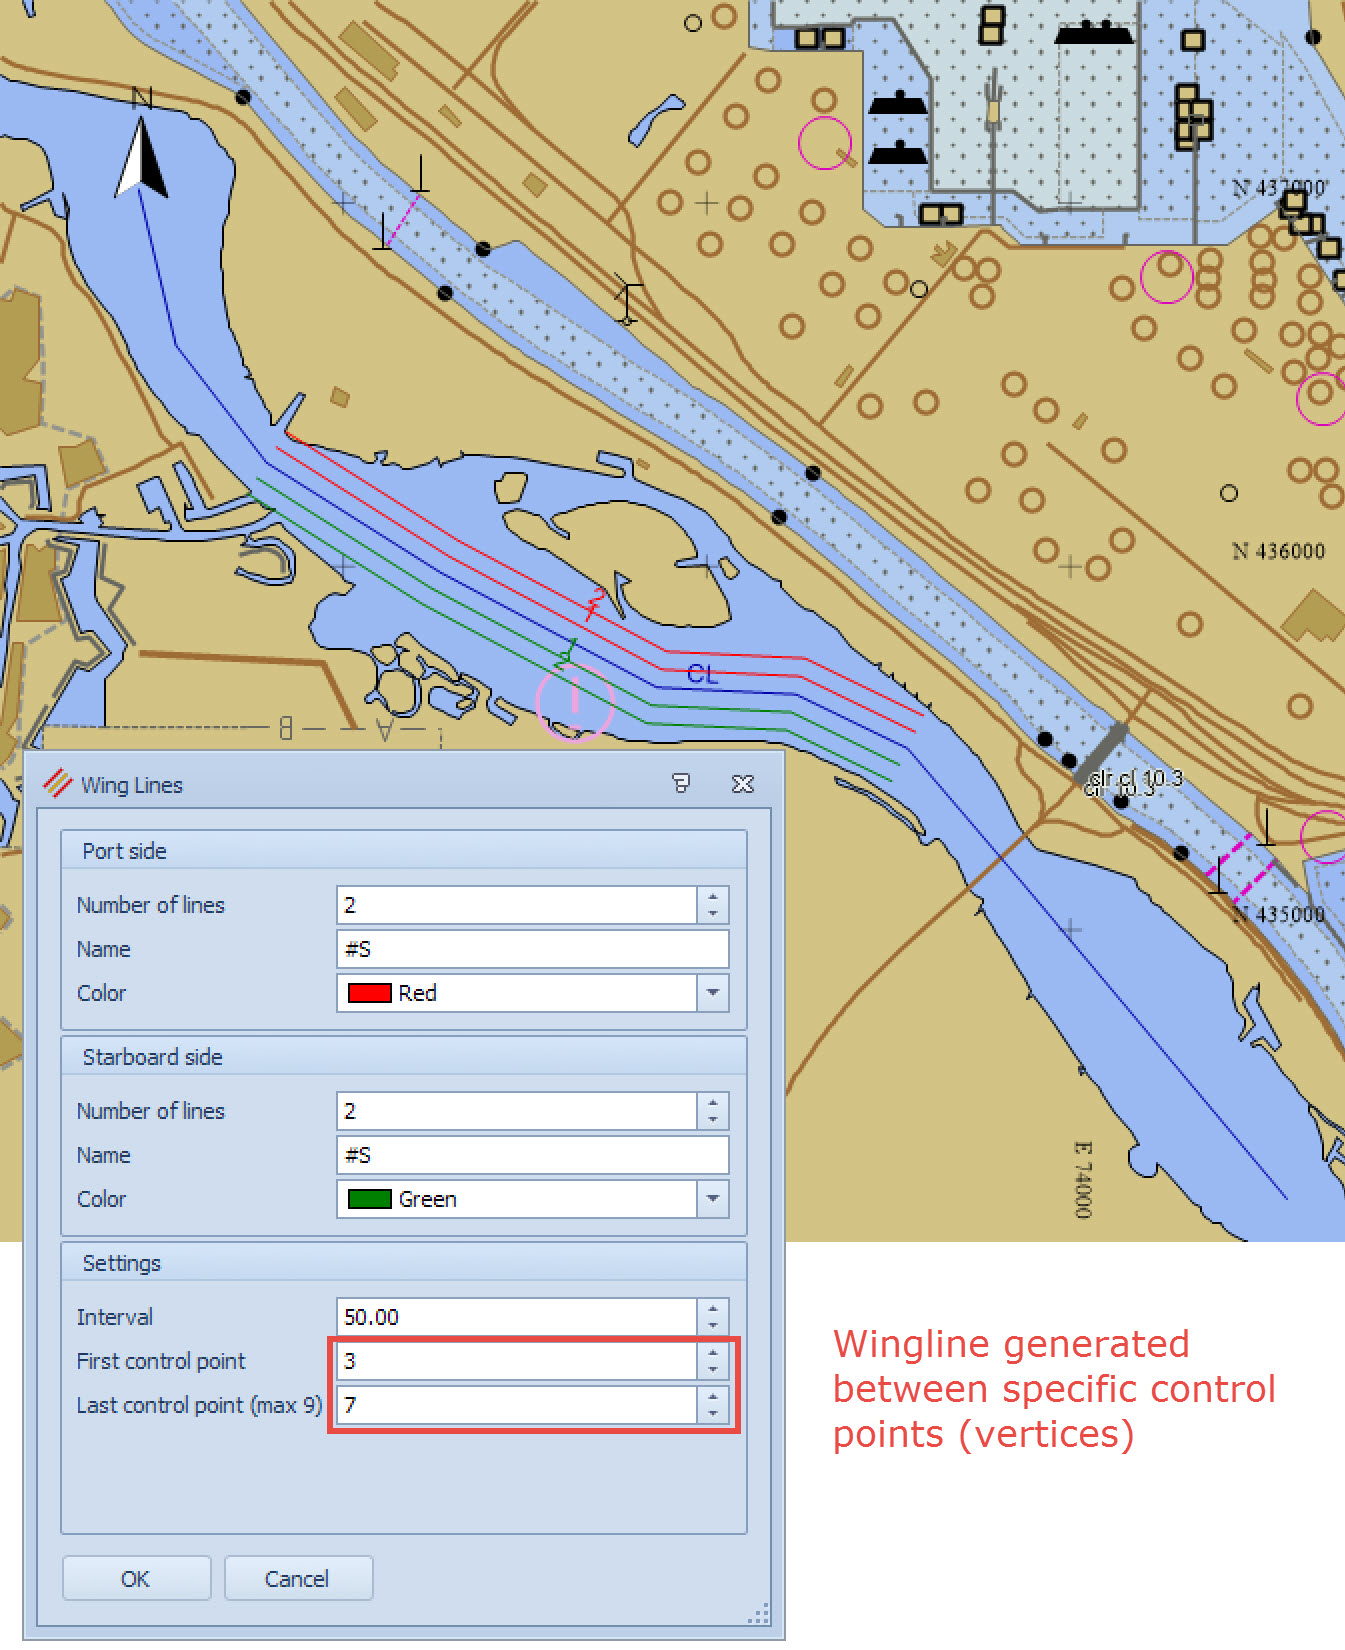
This image shows the settings and result when generating wing lines for the a portion of the polyline/route:
Click on
Wing line generation also works for polylines/routes with curves.
Return to top of page.
Generate Cross Lines
Cross lines are simply lines generated at an angle to a single baseline or polyline. Creating cross lines requires that a line or polyline be defined first.
Before generating any cross lines, make sure to select the layer on which they must be stored.
Single Line
The 'Cross lines' (and 'Wing lines') commands become active.
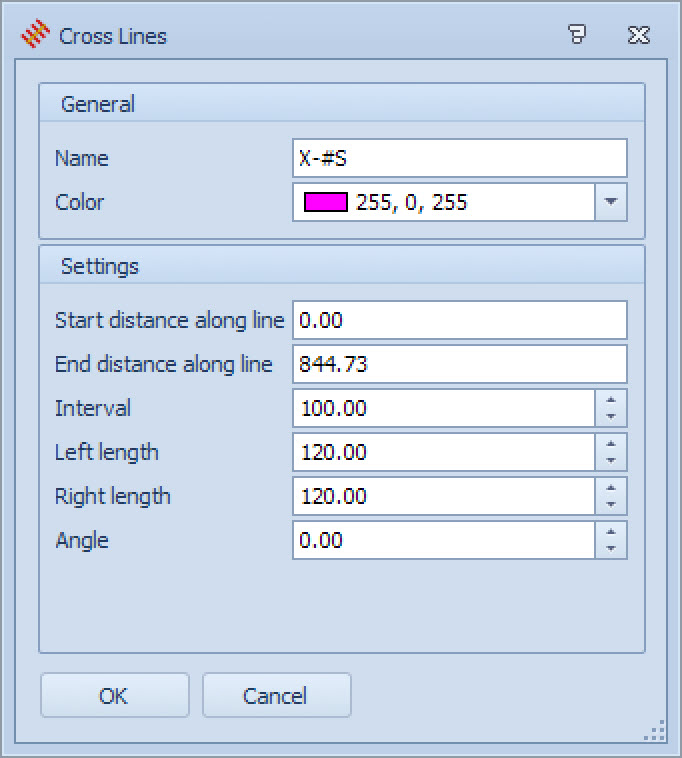
The naming convention for the cross lines:
#S: Sequence number
#N: Name of along line
#K: Station number (KP)
#M: Station number (MP)
#U: Station and offset (USA)
All other text can be added optionally.
Entering an angle rotates cross line bearings so they are no longer perpendicular.
This image shows the settings and result when generating wing lines for the entire polyline/route:
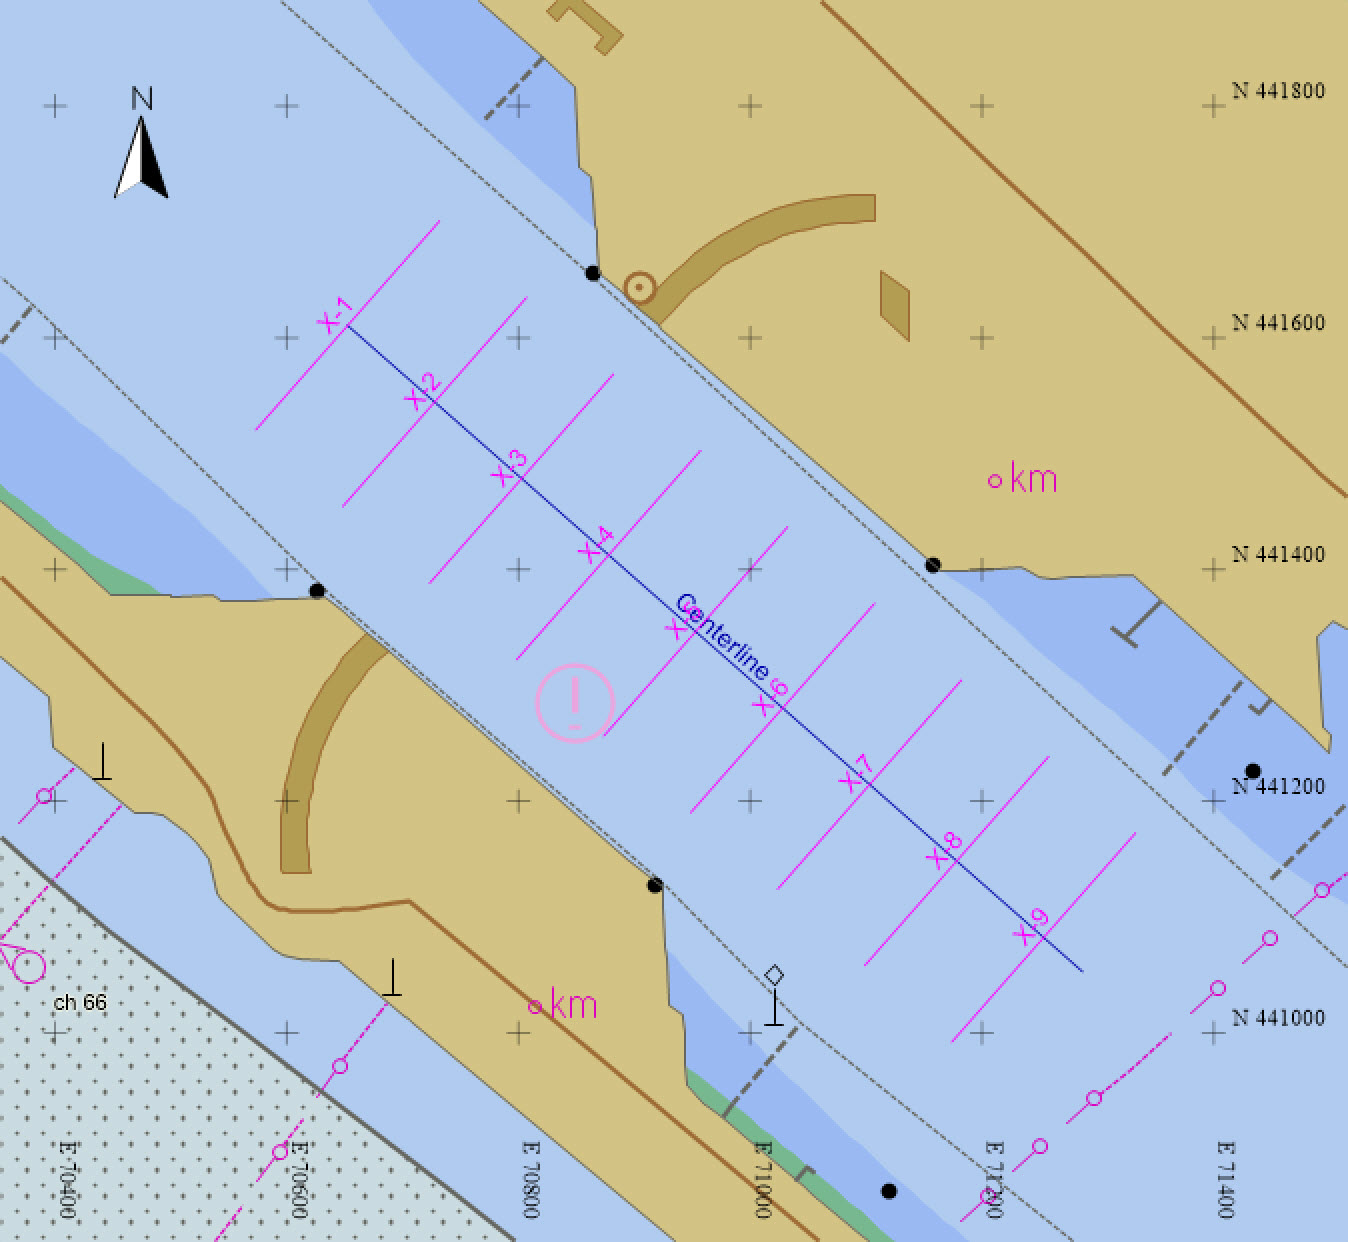
Press OK to start the creation of the cross lines.
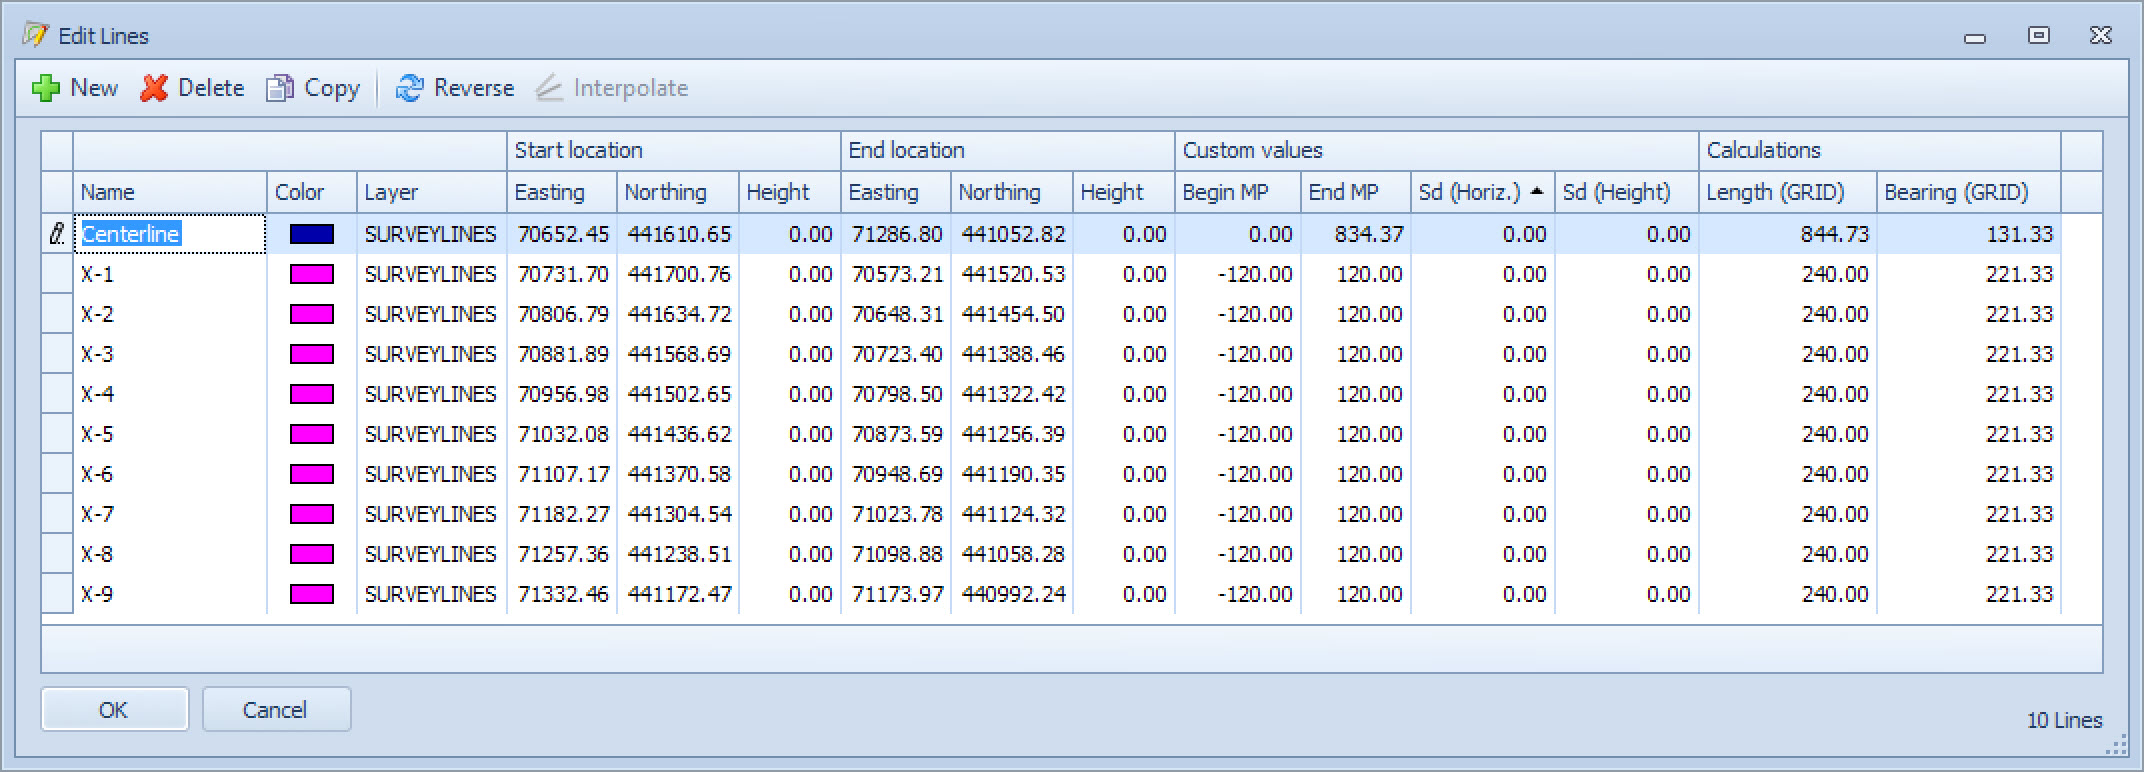
Click on
Return to top of page.
Polyline/Route
The 'Cross lines' (and 'Wing lines') commands become active.
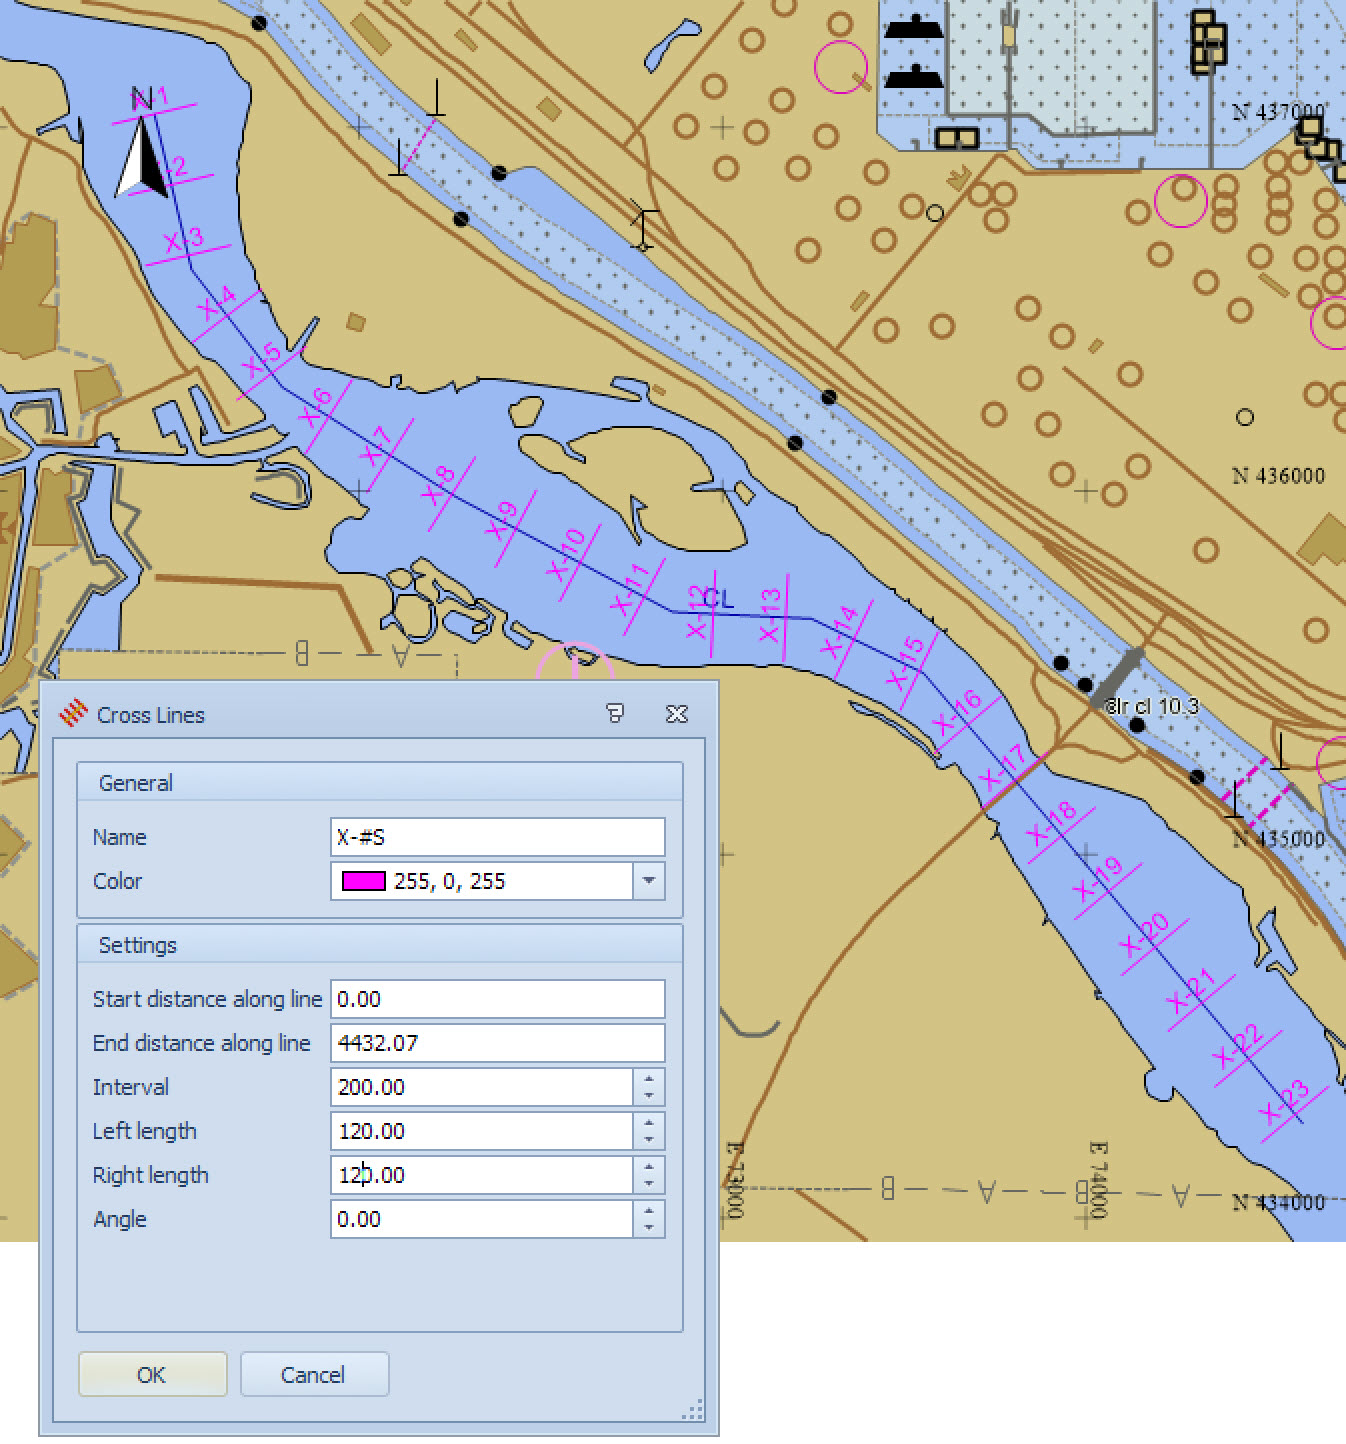
Return to top of page.
Import Data to New Line Database


Supported File Formats
The following formats are supported:

|
Supported formats |
|
|---|---|
|
DXF (Text) File |
AutoCAD DXF File. Notice that two dimensional defined lines will be imported as pline objects. To convert them to routes after importing use the 'Edit Other Objects' option. DXF versions 2.5 through 2014 are supported. |
|
DXF (Binary) File |
AutoCAD DXF File. Notice that two dimensional defined lines will be imported as pline objects. To convert them to routes after importing use the 'Edit Other Objects' option.
|
|
DWG File |
AutoCAD DWG File. Notice that two dimensional defined lines will be imported as polyline objects. To convert them to routes after importing use the 'Edit Other Objects' option.
|
|
ASCII (X/Y/Z) File |
File contains grid co-ordinates (easting, northing, height or x,y and z). Fields can be in fixed columns, or comma, tab or space separated.
|
|
ASCII (Lat/Lon) File |
File contains geo co-ordinates (latitude, longitude, height). The user will be asked for geodetic parameters to convert from geo to grid.
|
|
KML |
KML is a file format used to display geographic data in an Earth browser such as Google Earth, Google Maps, and Google Maps for Mobile. KML uses a tag-based structure with nested elements and attributes and is based on the XML standard. All tags are case-sensitive and must appear exactly as they are listed in the KML Reference . The Reference indicates which tags are optional. Within a given element, tags must appear in the order shown in the Reference. |
Return to top of page.
Import ASCII (X/Y/Z) Wizard
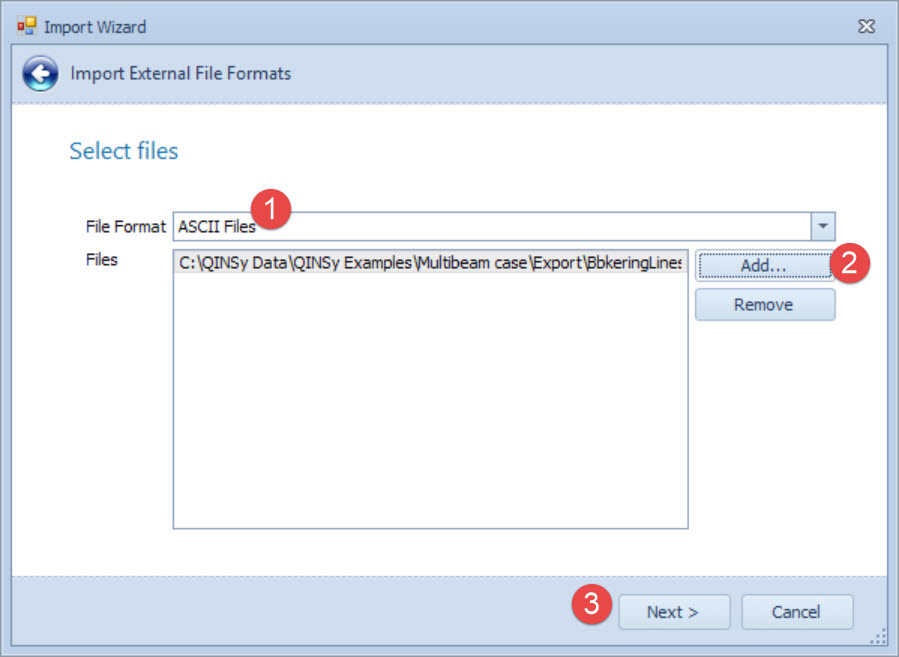
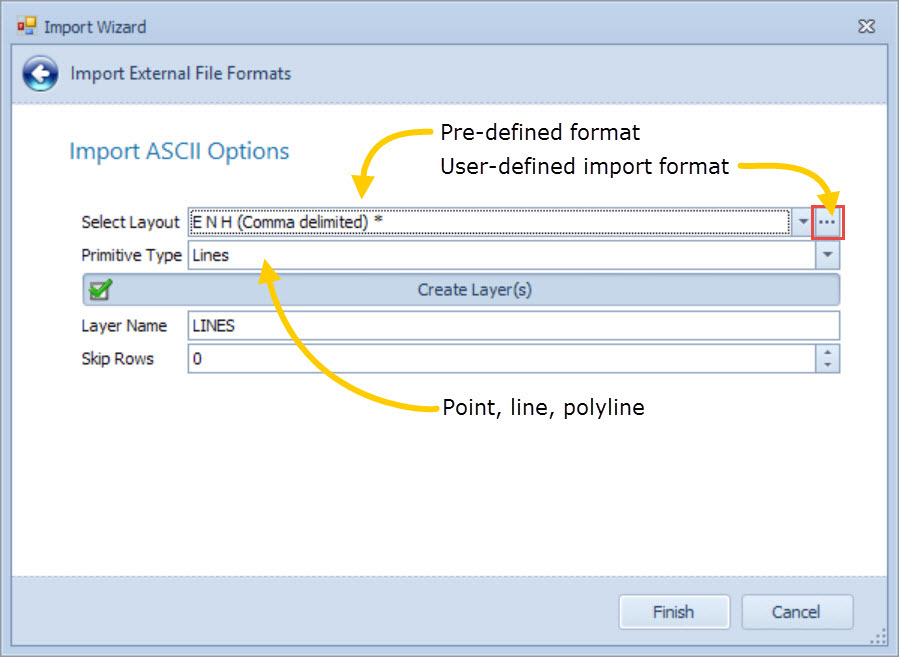
Two predefined layouts are available: E N H (Comma delimited) and E N H (Tab delimited). If data in the ASCII file has a different layout, there is an option to create a new user defined import layout; select 'New Format' from the drop down list or click on 
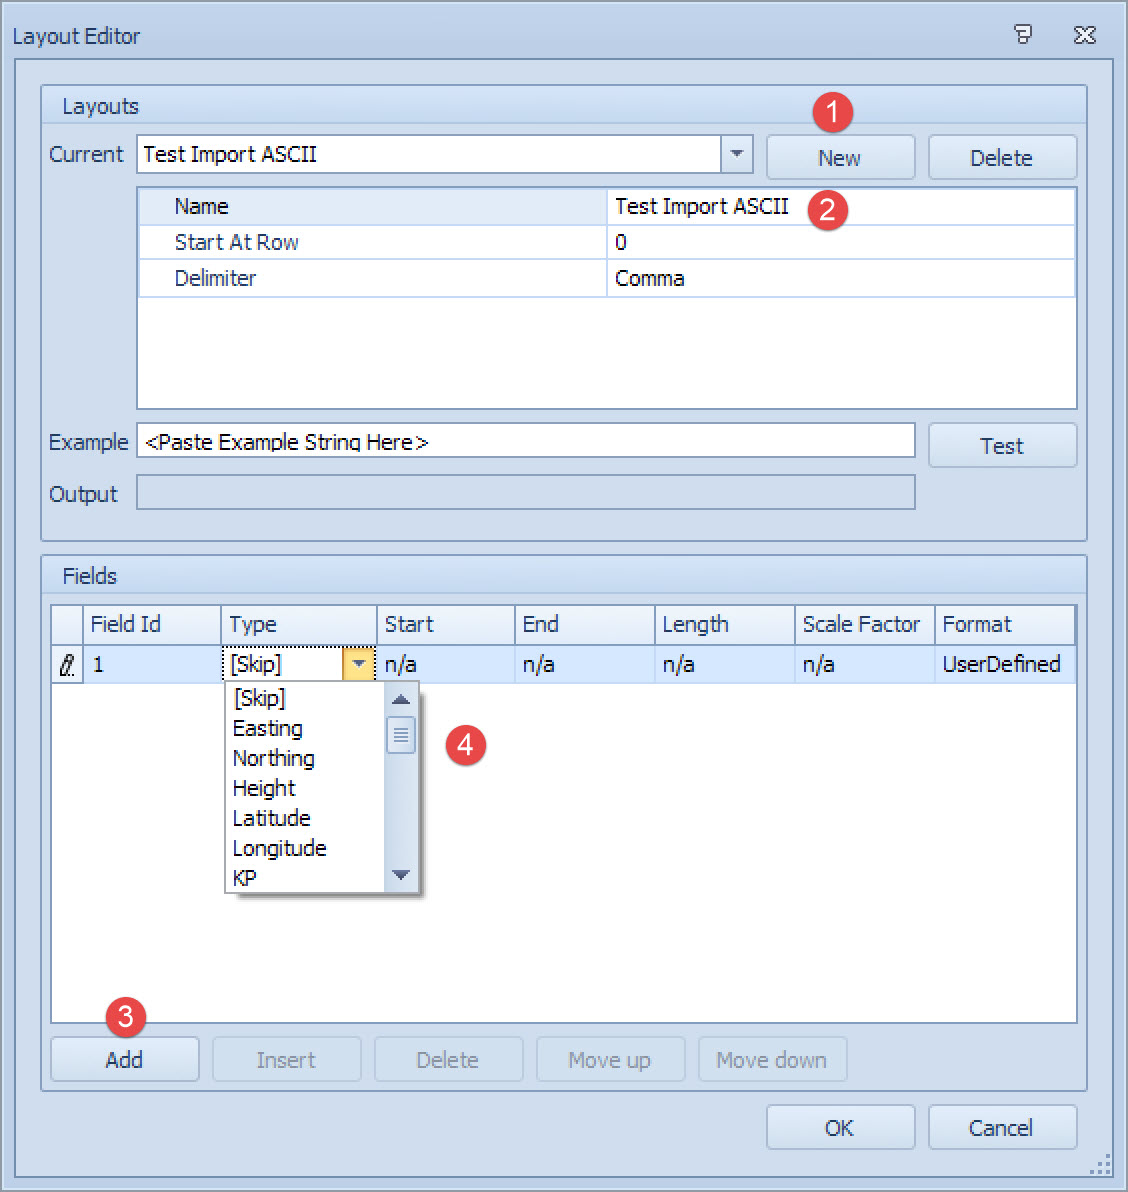
In case the ASCII file contains header information, define the row on which the coordinates start.

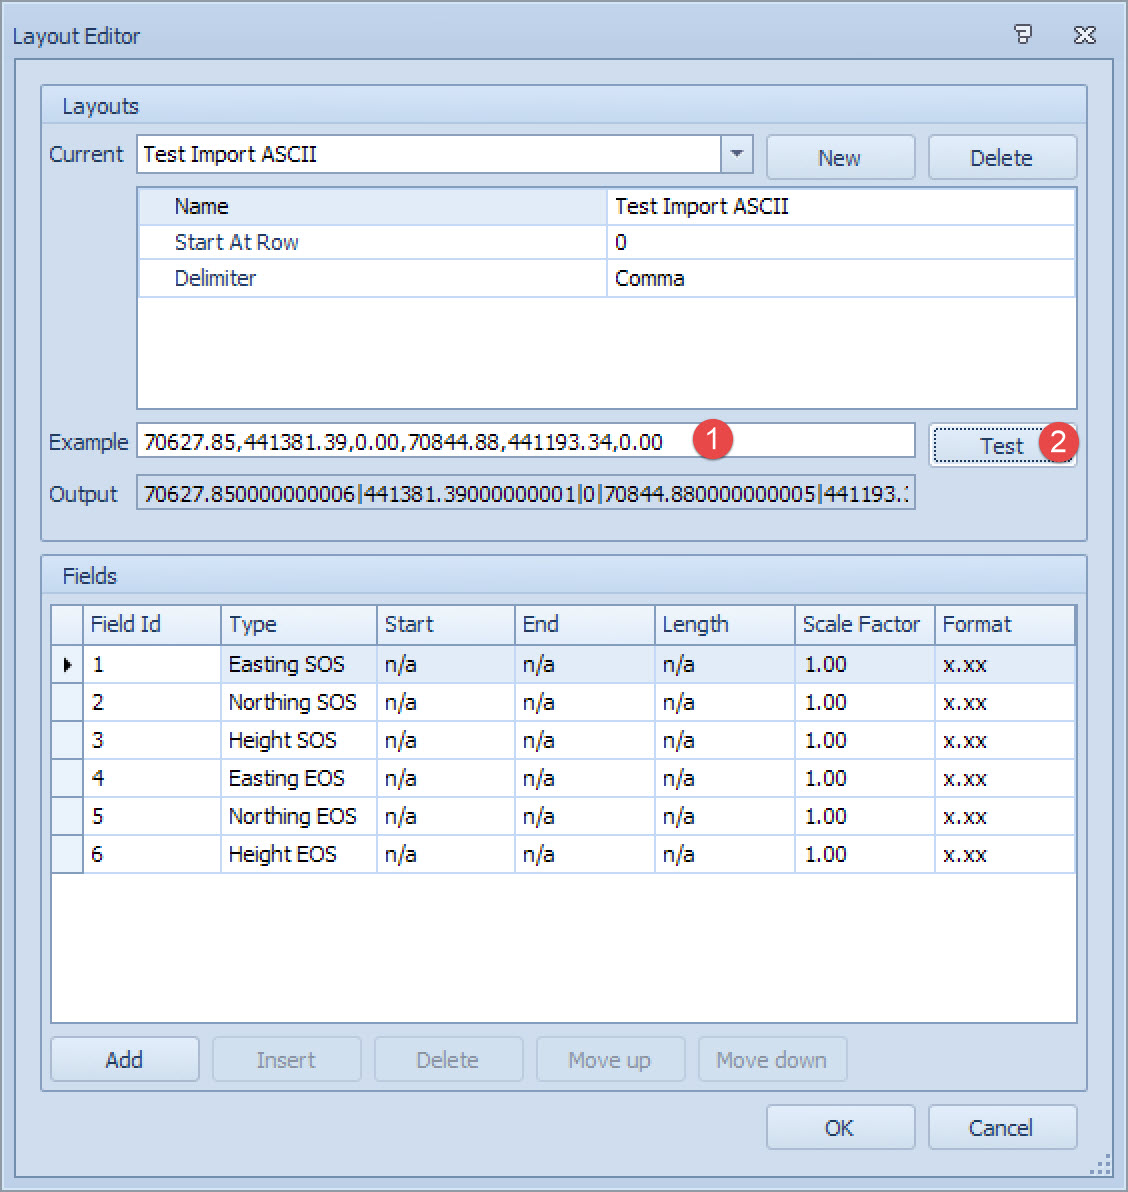
Clicking OK returns you to page 2 of the import wizard where you select the 'Primitive Type', enter a 'Layer Name' and check/change the 'Skip Rows' number.
Click 'Finish' and the imported points/lines/polylines are shown as a layer in the plan view.
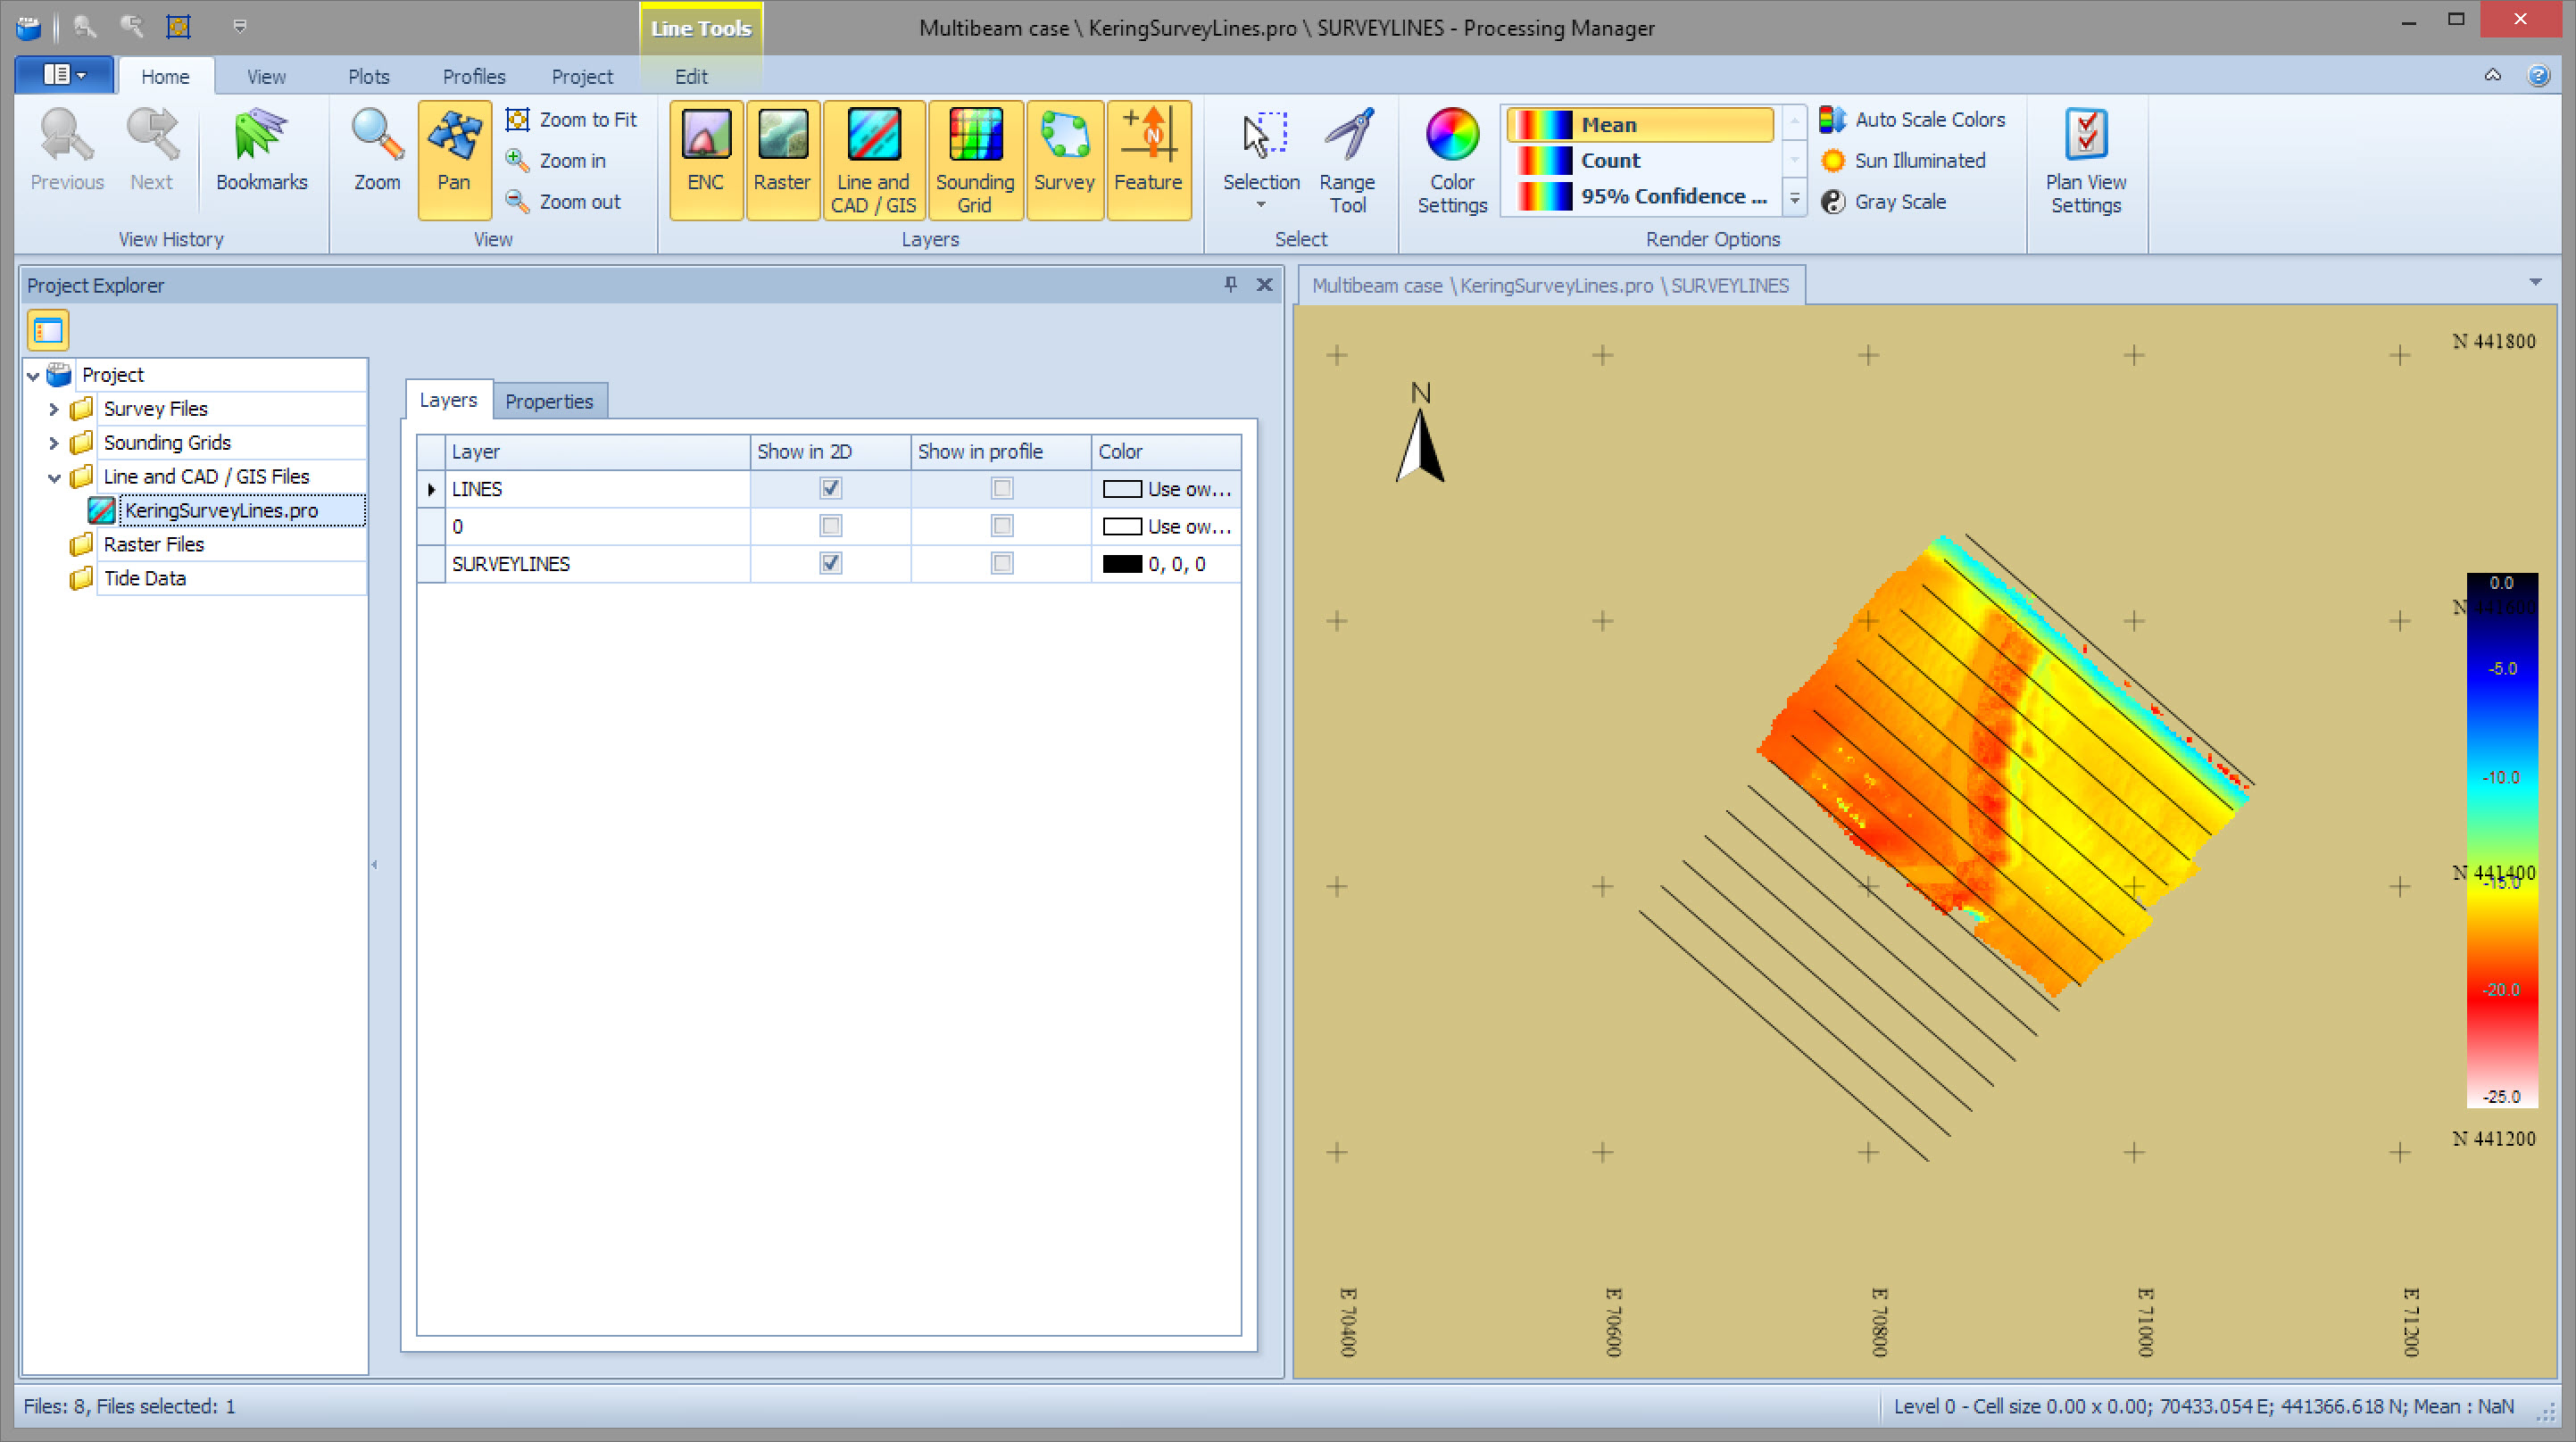
Additional ASCII files may be added to this line file if necessary.
Return to top of page.
Import ASCII (Lat/Long/Ht) Wizard
This import routine is very similar to importing X/Y/Z ASCII data. The differences are:
Define different fields.
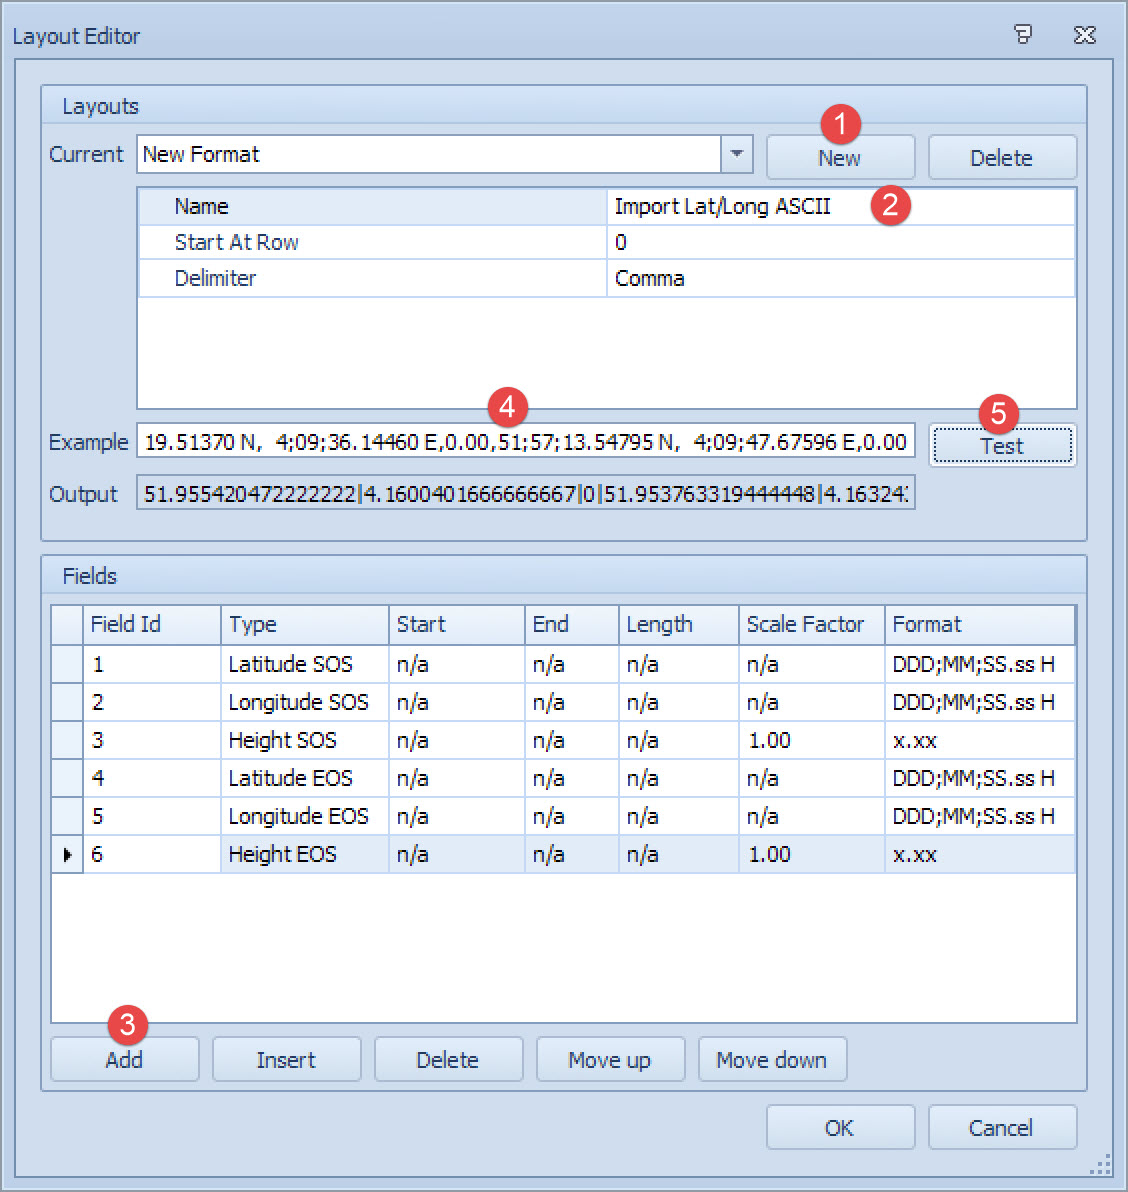
Geographical to grid conversion
Geographical coordinates are converted to grid during the import so you must make sure to have the correct template database active.
Return to top of page.
Import DWG, DXF or PRO Wizard
As with an ASCII import:
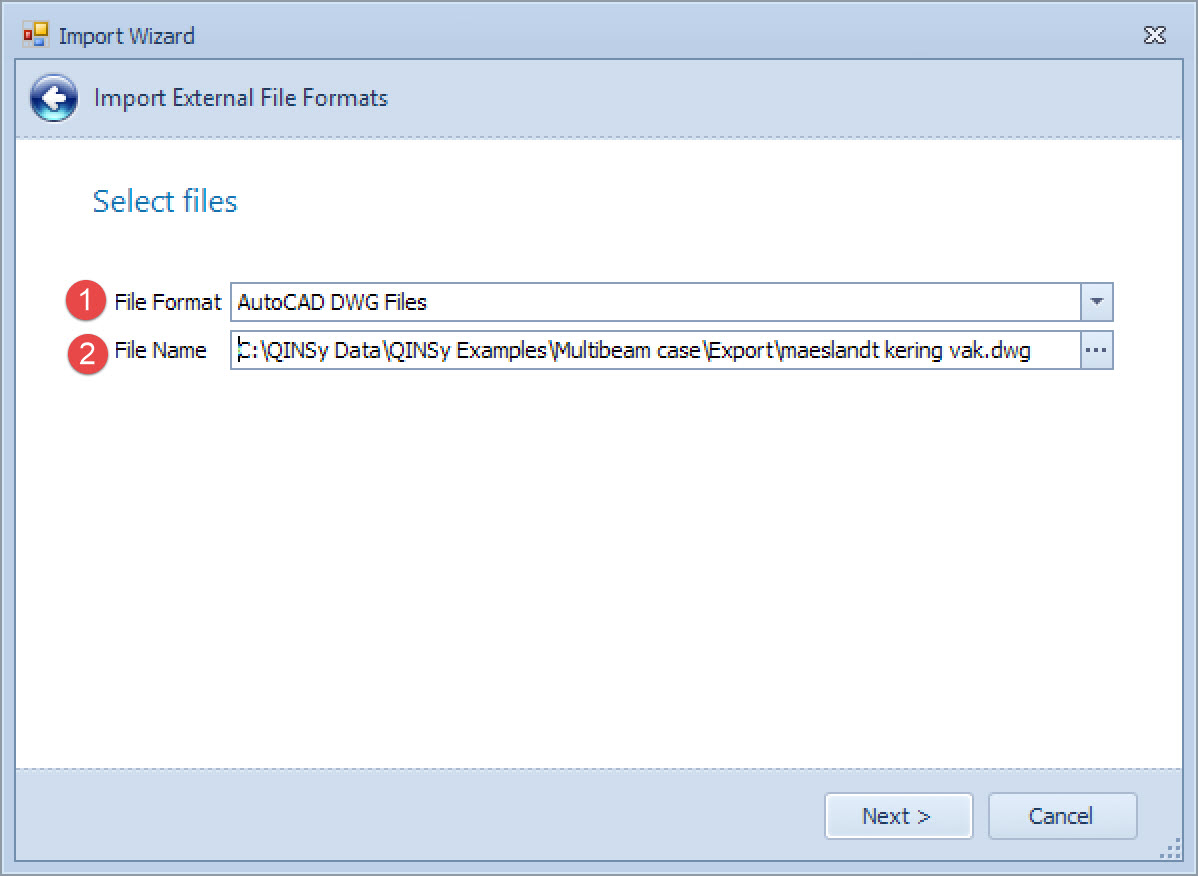
On the second page of the wizard:
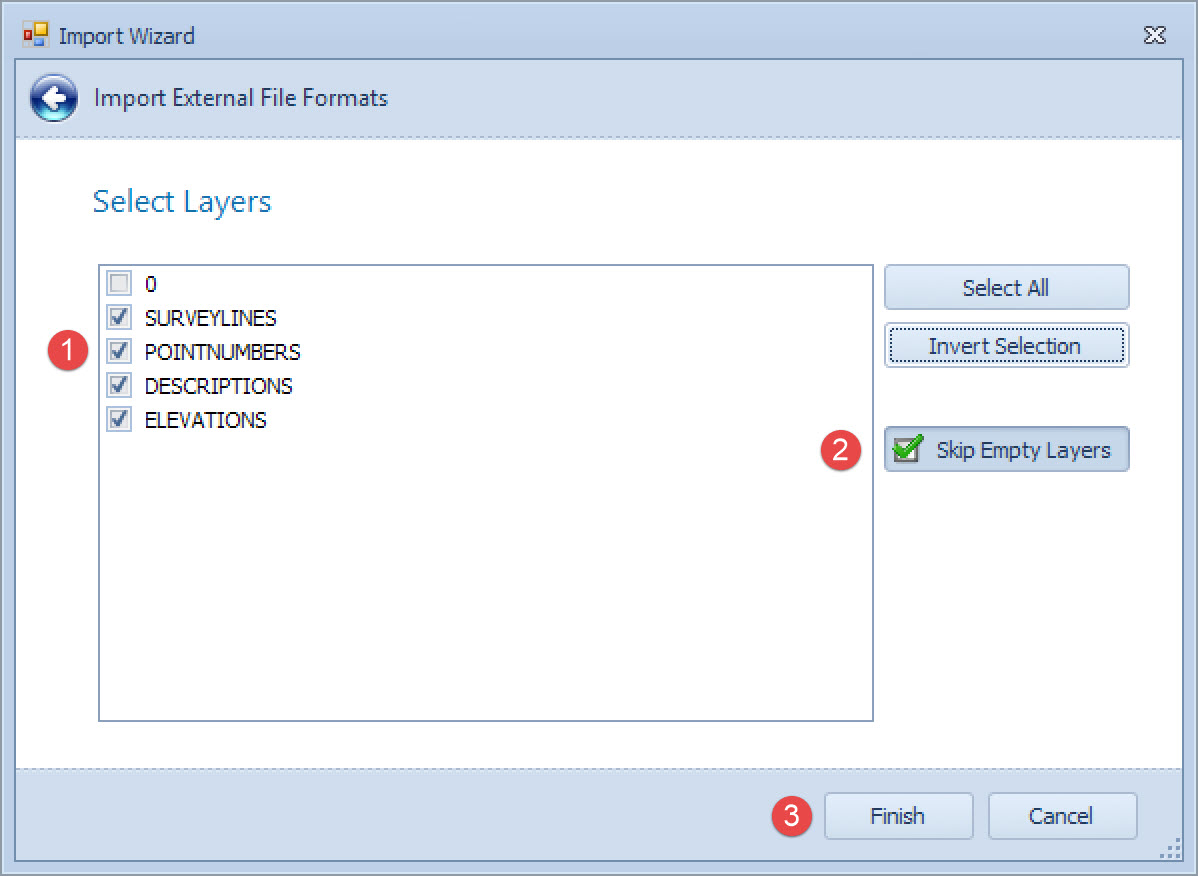
Return to top of page.
Import KML Wizard
A line file may also be defined in a KML file. Import is similar to other file formats described above.
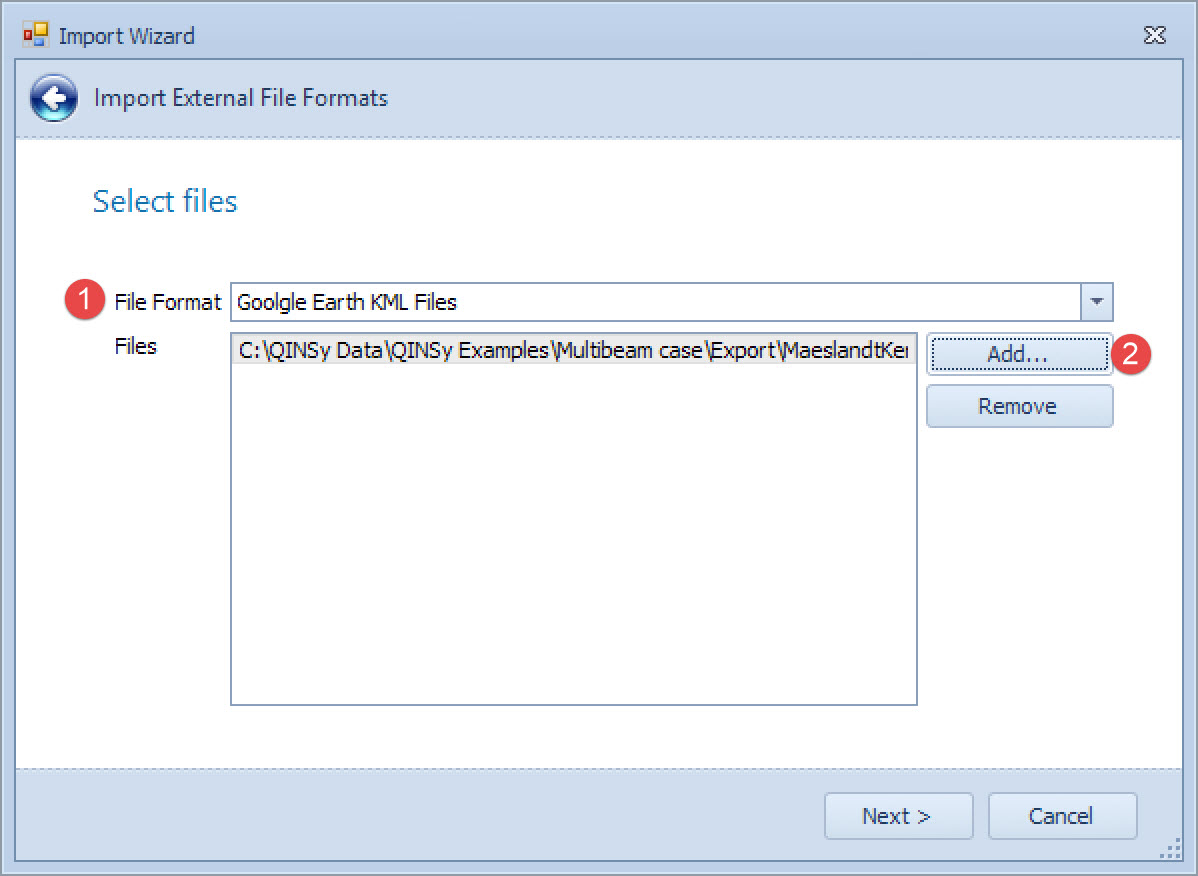
On the second page of the wizard.......
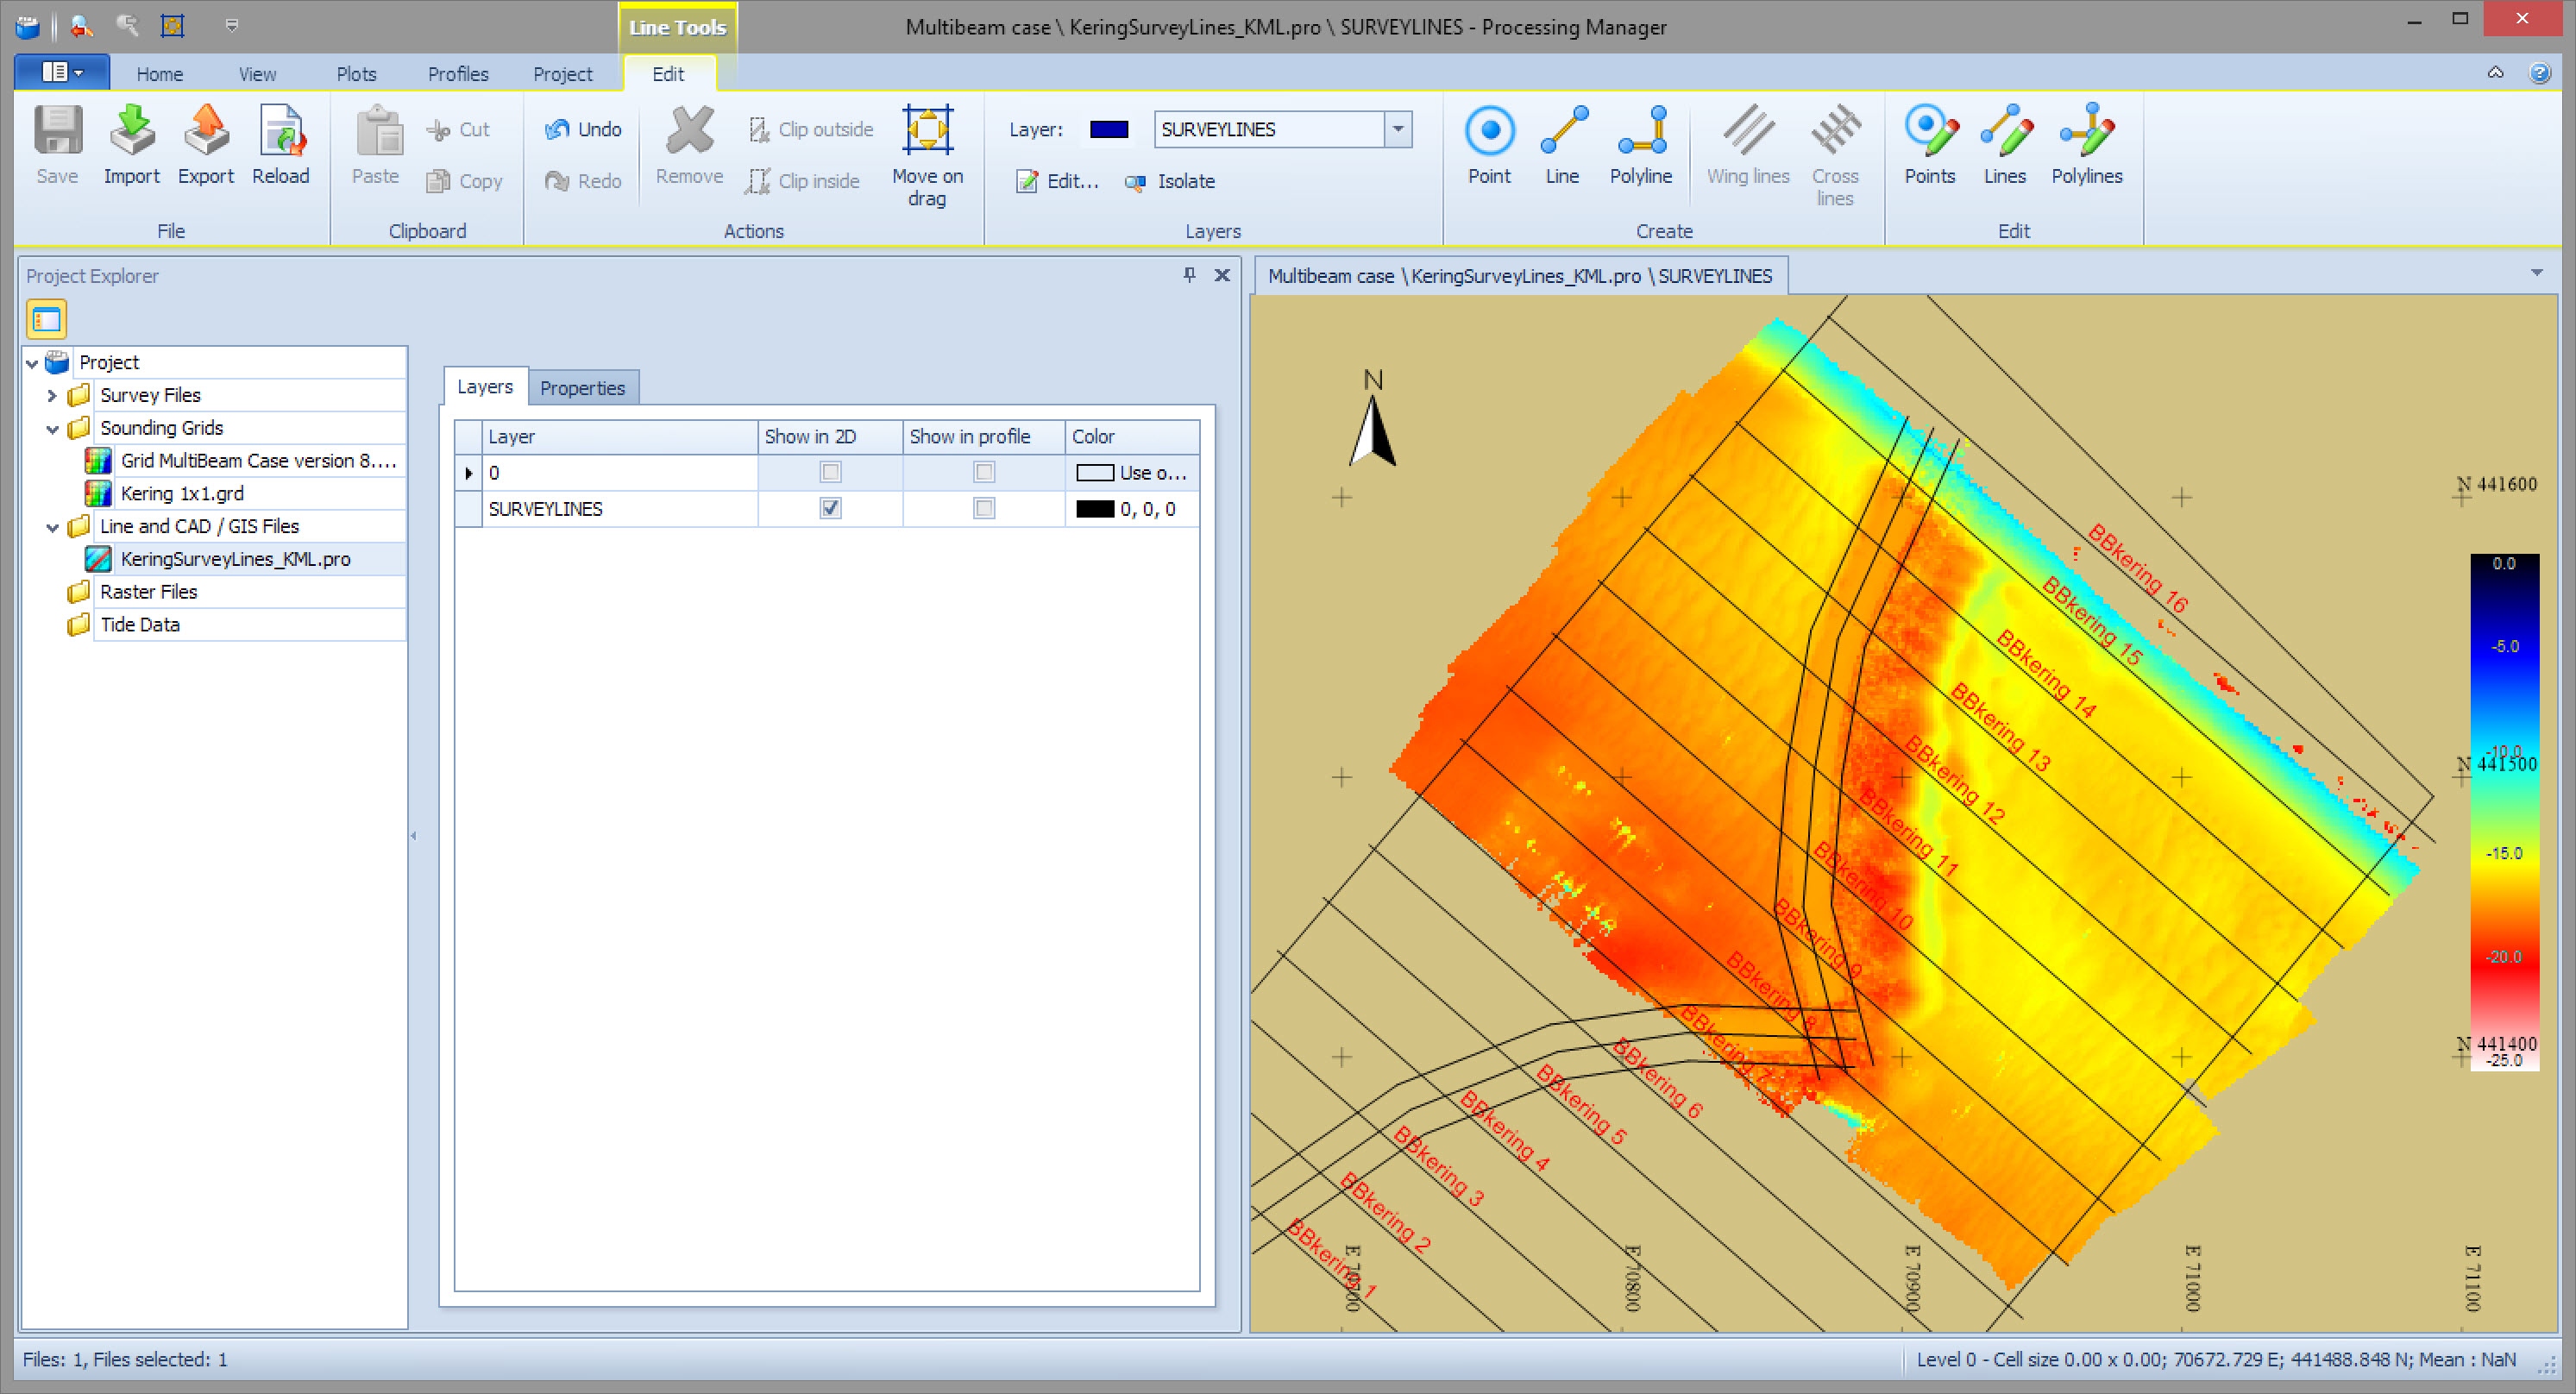
After import the lines should appear in the plan view. You may have to click on a different element and then click back on the line file.
Return to top of page.
Edit Points, Lines, Polylines and Areas
In Data Grids
Coordinates and attributes are shown in a data grid like this:
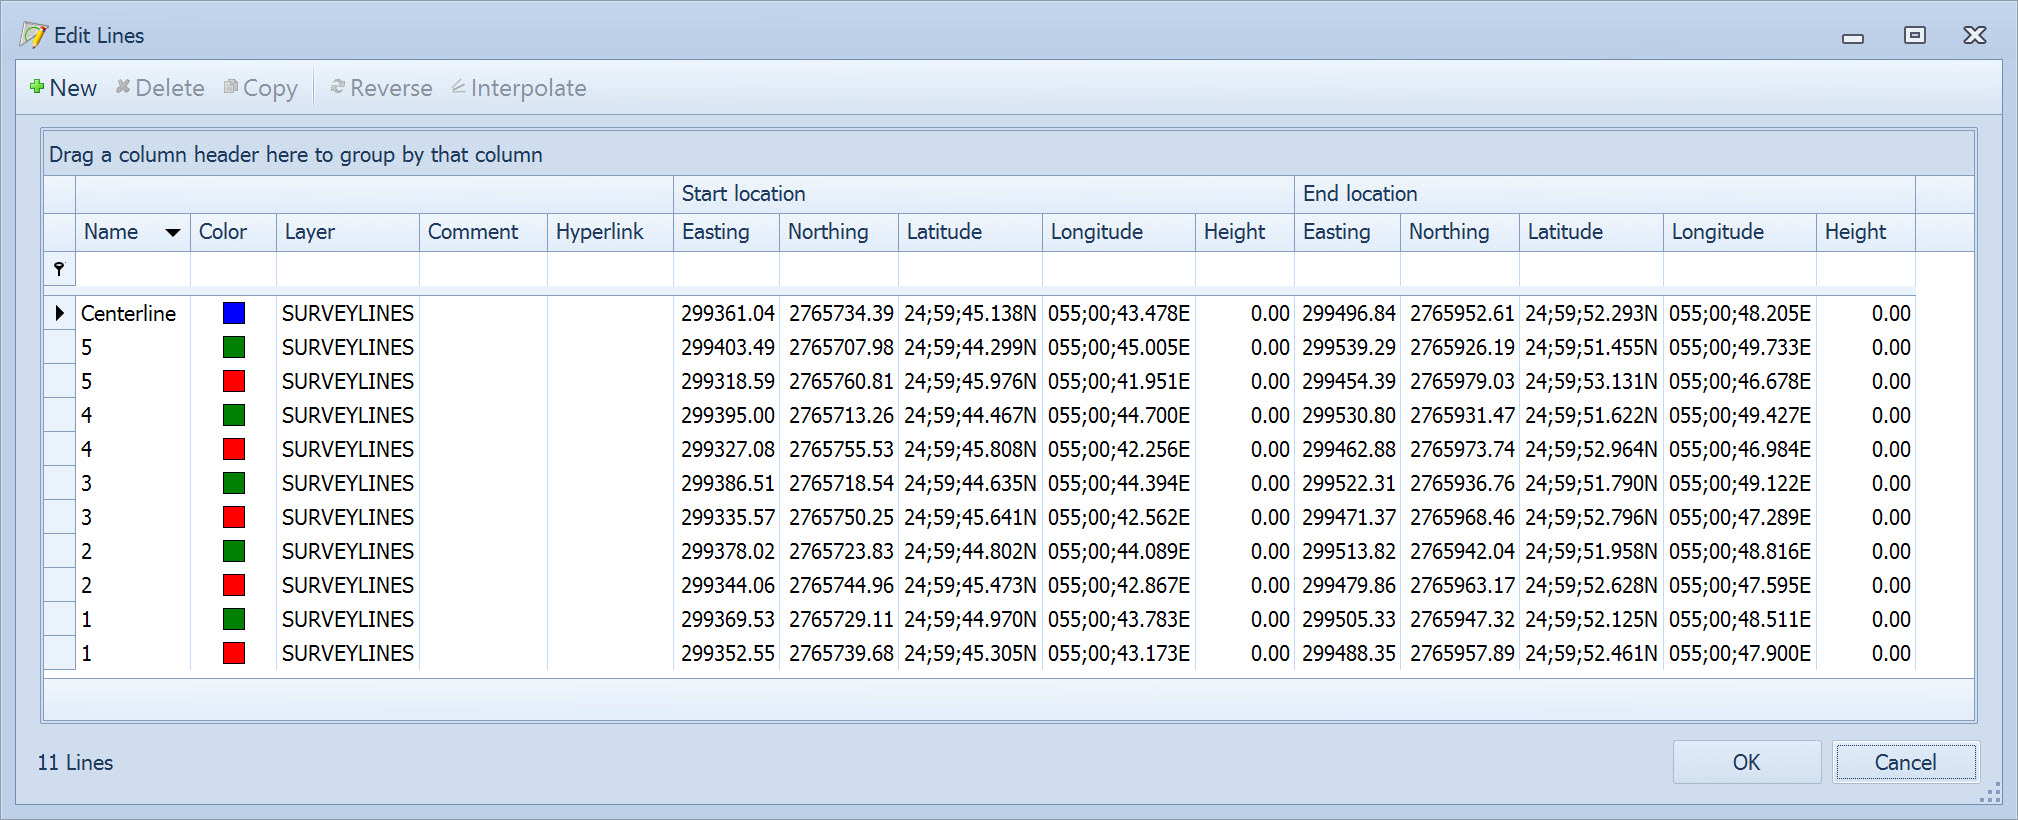
In the Processing Manager, data grids are often used for showing properties of multiple items located in such places as the Points, Lines, Polylines and Areas Editor and the PM Project Explorer.
The data grids offer many opportunities for customization such as filtering, sorting and grouping.
Most of these options are found by right clicking on the column headers to open the contextual menu.
Please refer to How-to Use Data Grids.
All functions are fairly self explanatory except, perhaps, for the following:
Points, Lines, Polylines and Areas - Attributes 1 and 2
Custom numeric attributes. Change the attribute names by right clicking on the column header selecting Set attribute names.
Attribute 1 options -
-
-
T.M.D. (True Measured Depth, used in VSP surveys)
-
Velocity
-
SD (horizontal)
-
Weight (horizontal)
-
Attribute 2 options -
-
-
T.V.D. (True Vertical Depth, used in VSP surveys)
-
Velocity
-
SD (height)
-
Weight (height)
-
For example a Weights column can be created or a column with Standard Deviation values.
The custom attributes can be used in the Data Fusion to calculate a weighted mean or least squares approach.
Return to top of page.
Points - Data Fusion
Use this option to calculate the mean of the points selected in the Points data grid list.
The calculation options are:
-
-
Mean - Calculates the new position based on the average positions of the selected points.
-
Weighted mean - Calculates the weighted mean of the selected points. Points with zero weight are excluded.
The weights can be entered in the attribute columns in the Points Editor. -
Least square approach - Calculates the new position using a least squares approach.
All selected points must have proper Sd values, which can be entered in the attribute columns in the Points Editor.
-
Return to top of page.
Lines - Interpolate
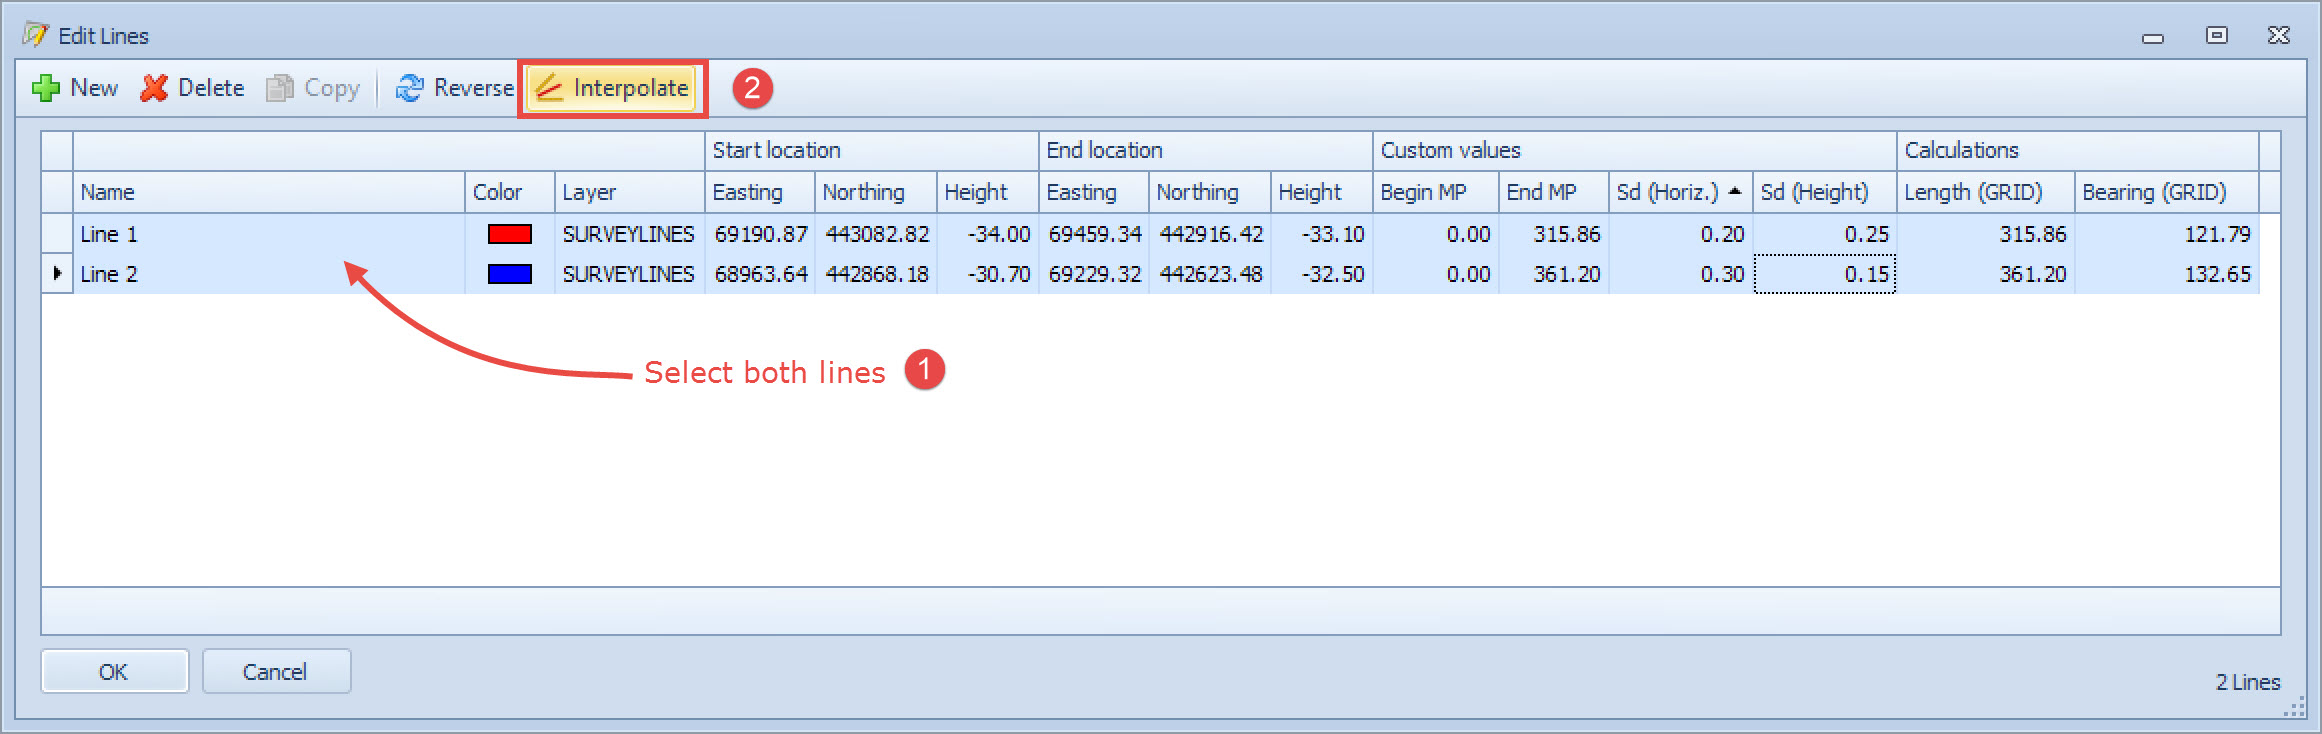
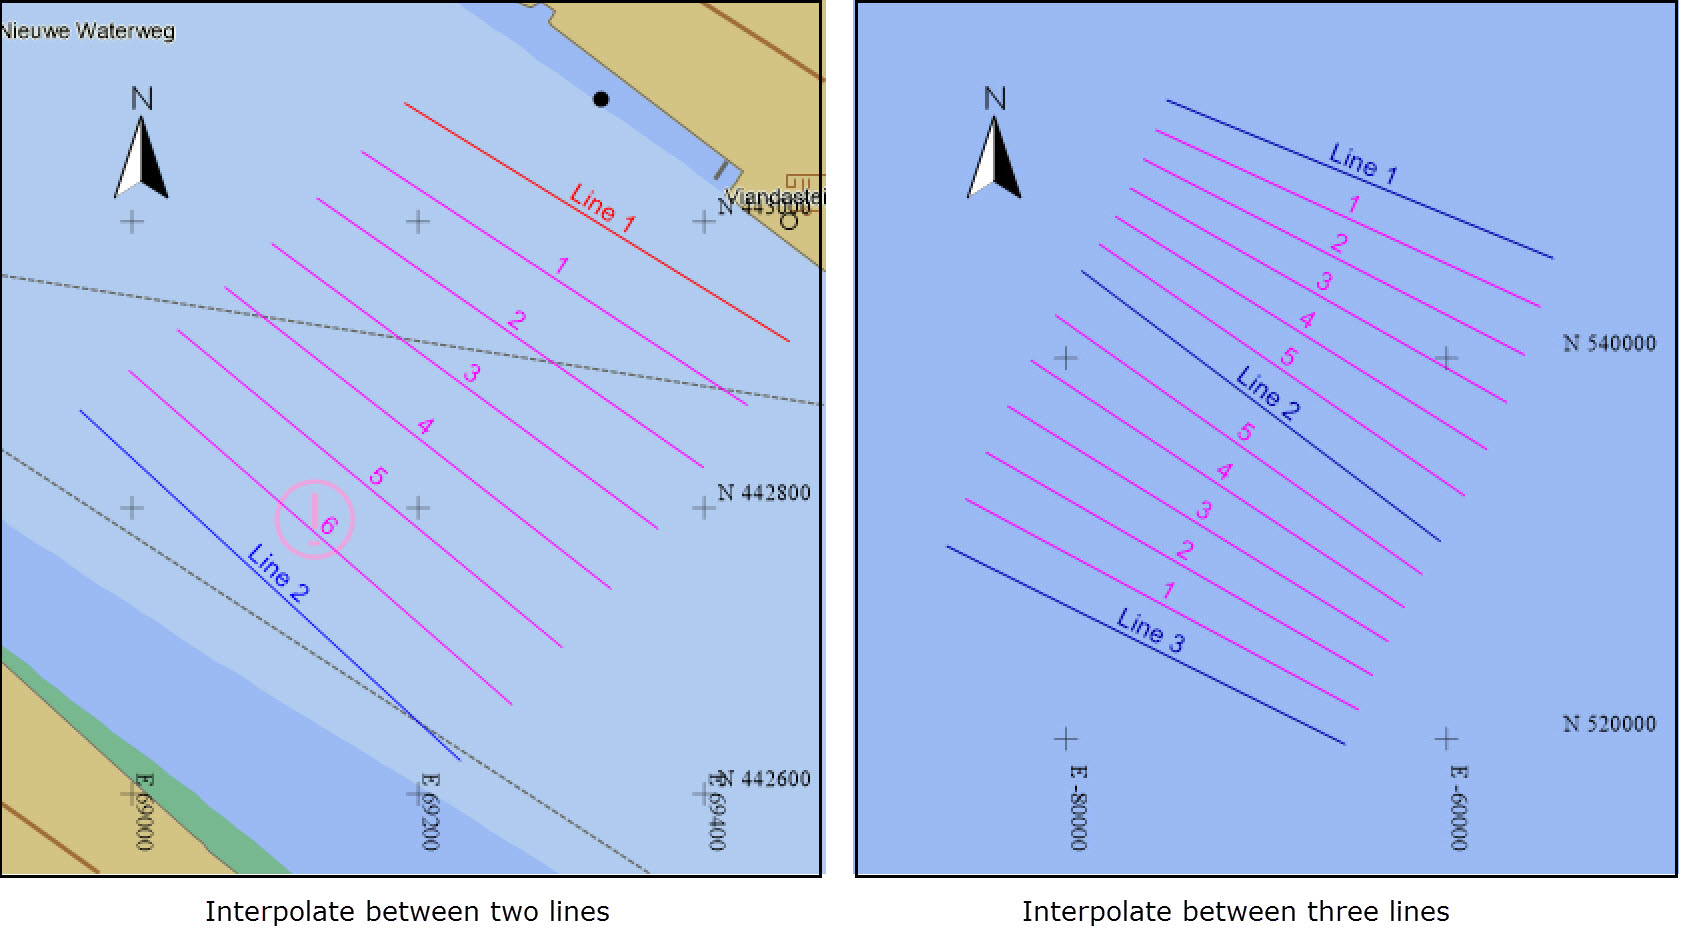
Use this option to create interpolated lines between the two or more lines selected from the list in the Edit Lines window.
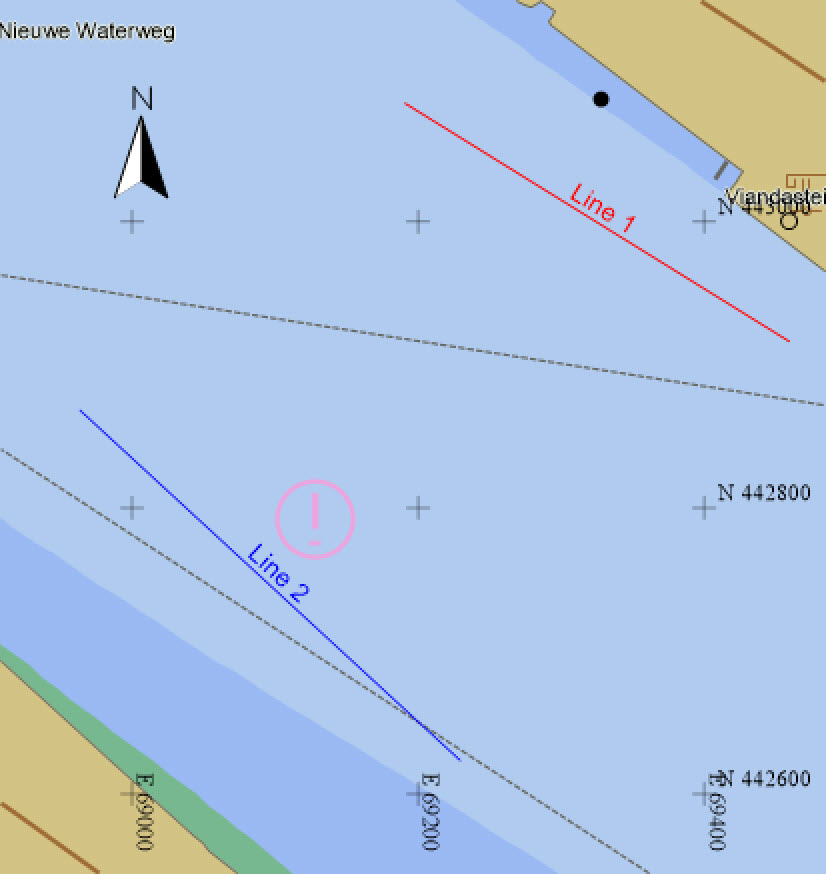
For example, two lines are defined:
Before adding interpolated lines make sure the correct layer is selected:
|
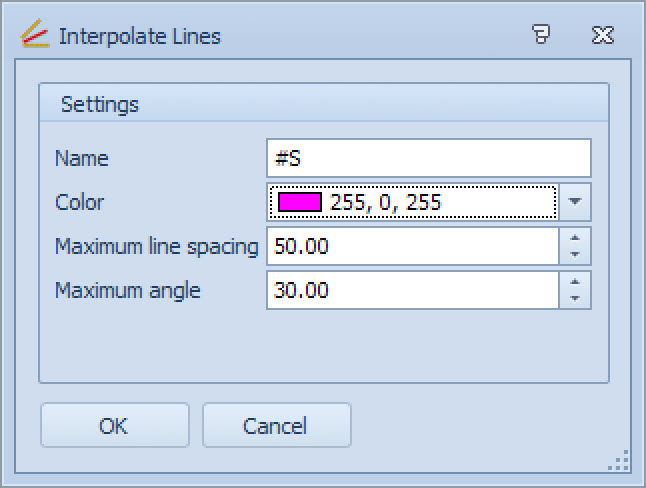
Interpolate Lines Settings |
|
|---|---|
|
Name |
Enter a name manually and combine with it one of the possible predefined settings:
|
|
Color |
Select in which color the interpolated lines will be displayed in the Plan View. |
|
Maximum line spacing |
Enter the maximum distance between the interpolated lines. |
|
Maximum angle |
Normally lines can be inserted between two adjacent lines when these two lines are more or less parallel. Maximum angle is used to see if the two lines are more or less parallel: within the criteria of this angle.
Two attempts are made to see if the lines are pointing in the same direction:
|
Press OK to start the interpolation.
The new lines are displayed in the Plan View when OK is pressed in the Edit Lines dialog.
Interpolation is also possible between 3 or more lines:
Click on
Return to top of page.
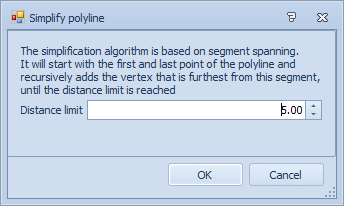
Polylines - Simplify Polyline
The line simplification is used to reduce the number of segments in a polyline without losing too many details.
Polylines - KP Calculations
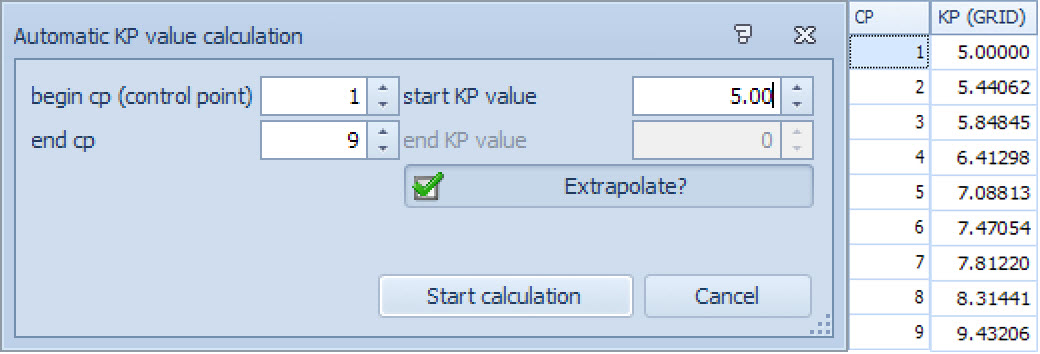
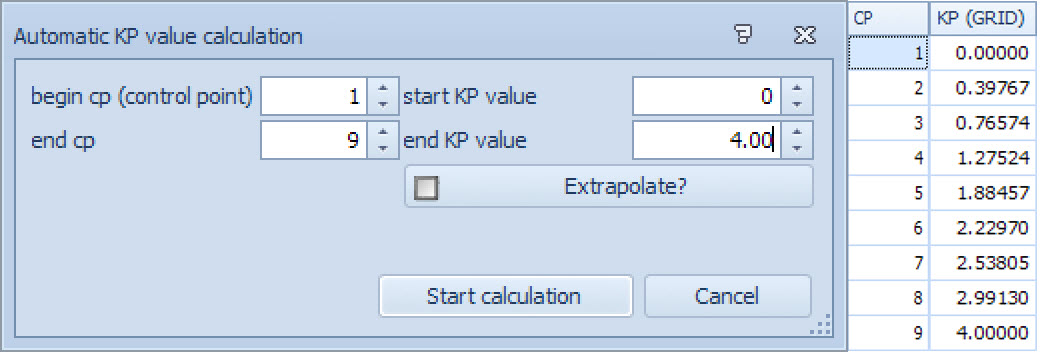
This function either extrapolates KP values between the selected control points or it calculates values between entered KP values.
In this example:
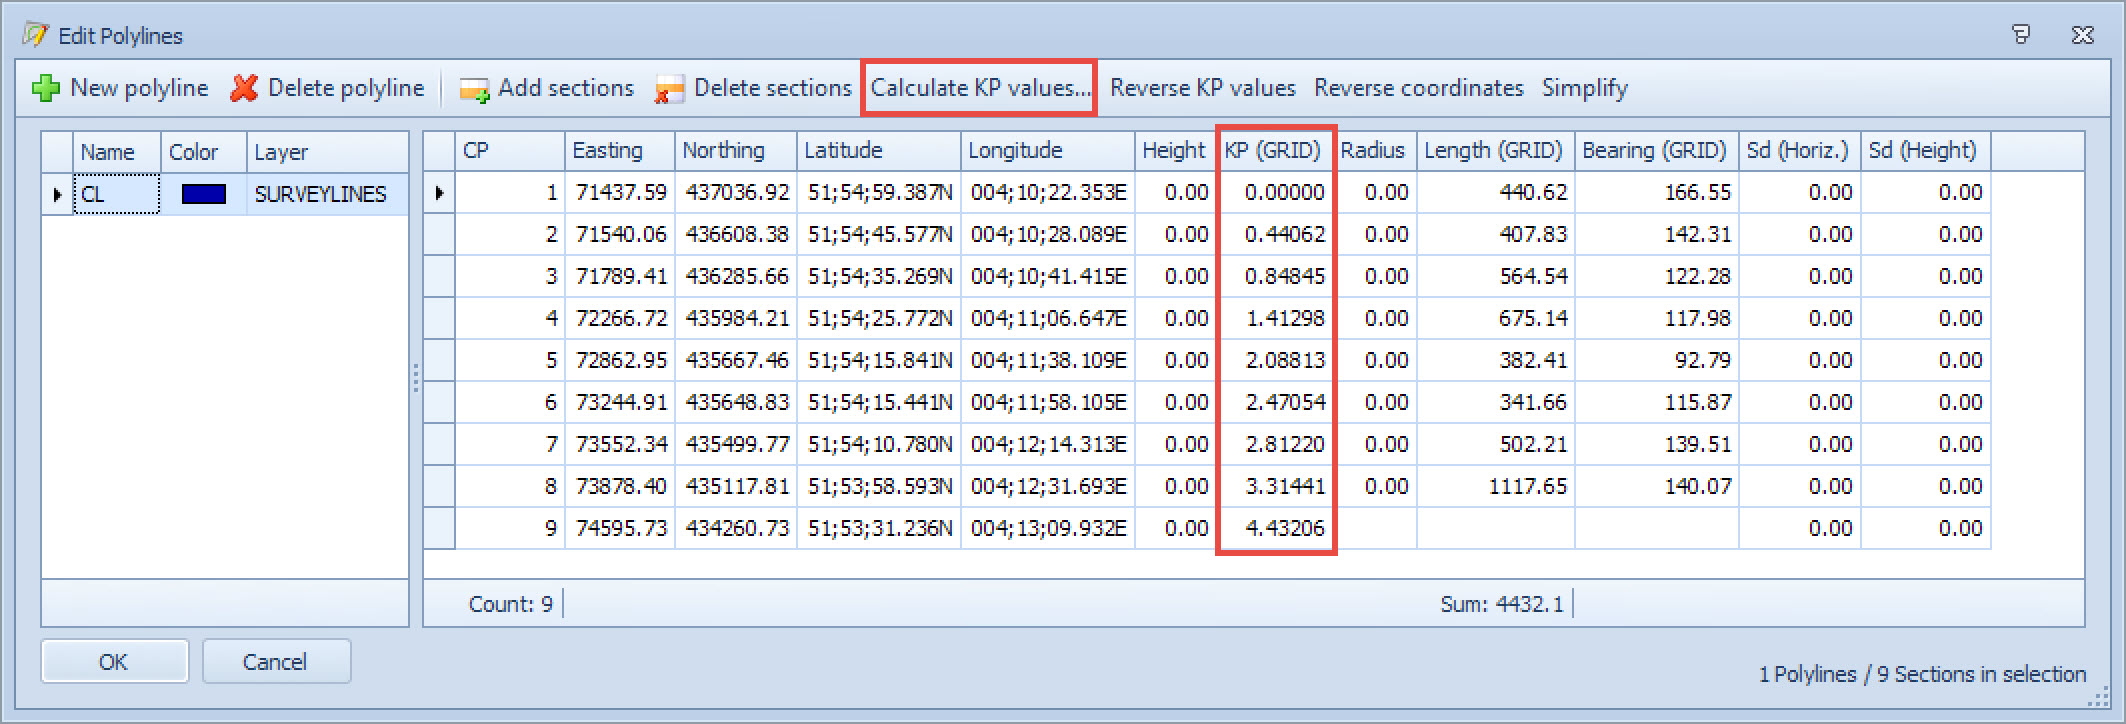
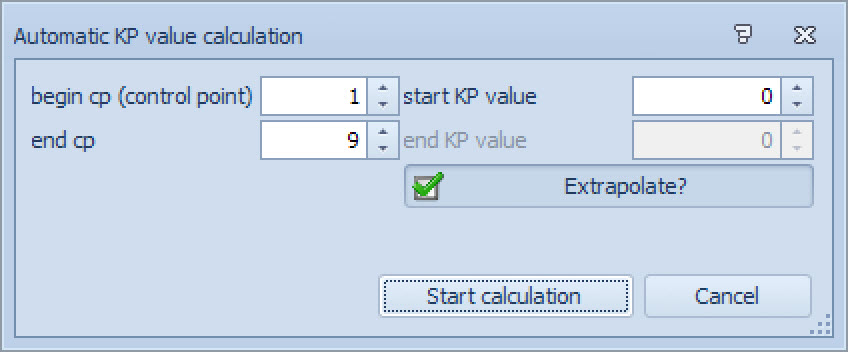
...the following settings were used to compute KP values:
|
Automatic KP value calculation |
|
|---|---|
|
begin cp/end cp |
Use the up/down arrows to select control points for the selected polyline.
|
|
start KP value/end KP value |
Enter a value manually or use the up/down arrows to select a value.
|
|
Extrapolate |
If activated, then the end KP value is calculated automatically.
|
|
Start calculation |
Press to start calculating KPs along the polyline. |
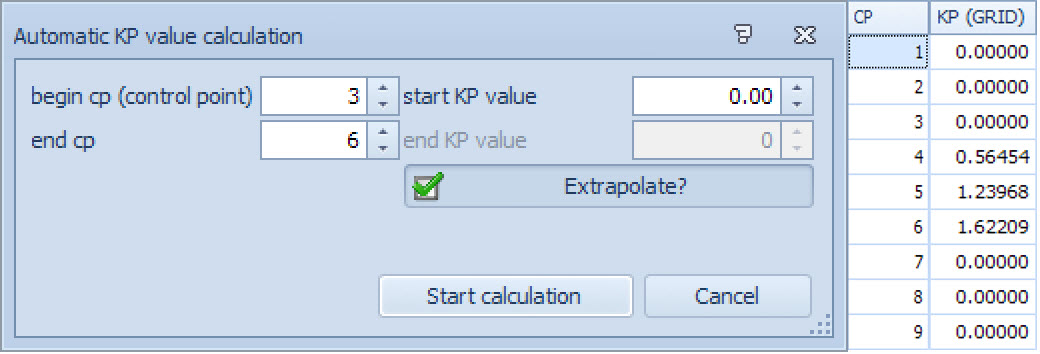
Examples:
Return to top of page.
By Mouse
Delete
Points, lines, polylines and areas may be deleted by clicking on the entity in the Plan View panel.


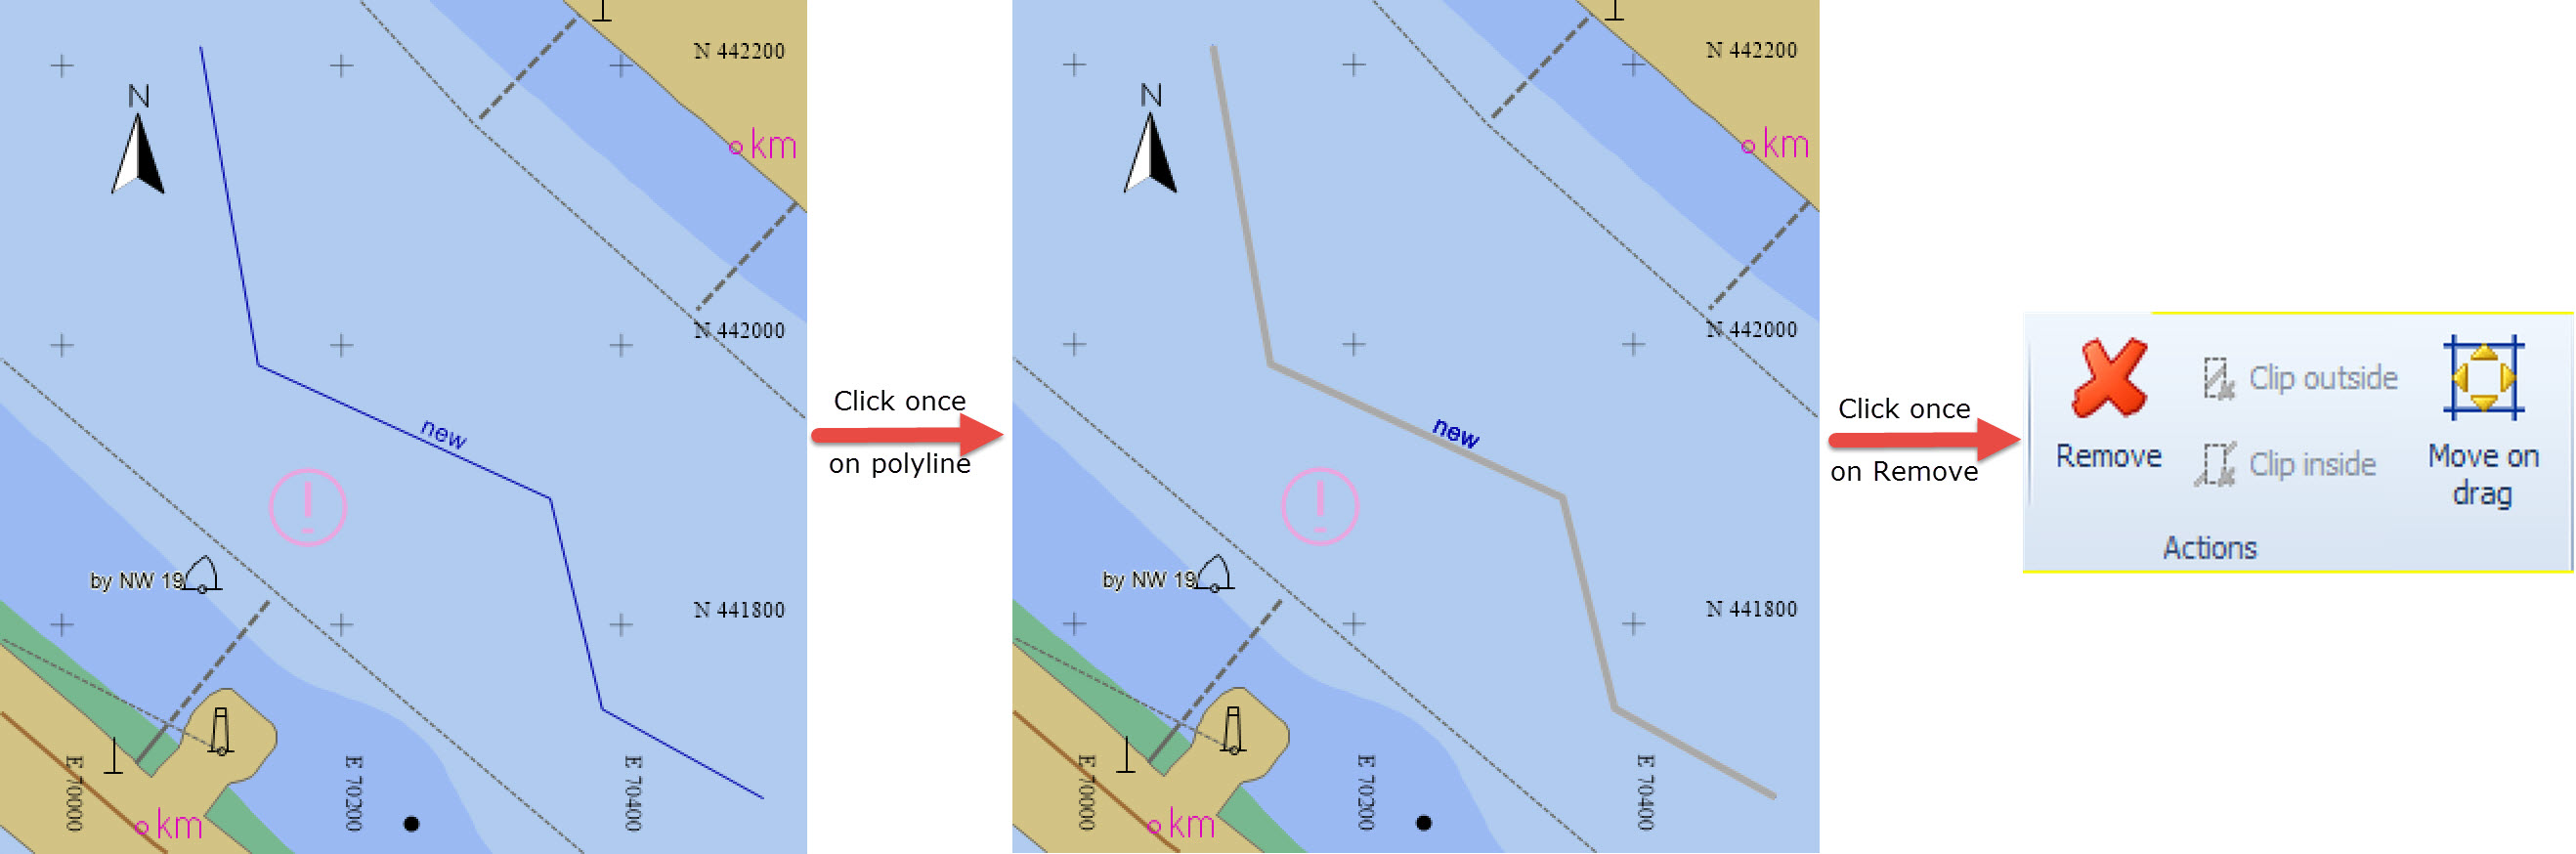
Line color turns grey.
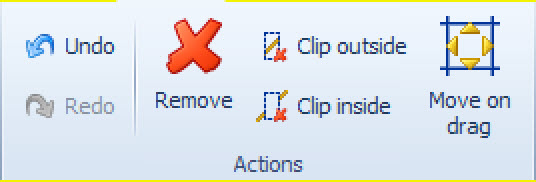
Click on Remove in the Actions command group.
Multiple entities are selected for removal at once by holding down the CTRL key.
Return to top of page.
Editing Coordinates
For lines, polylines and areas, clicking once on the line changes the color to grey.
Clicking again changes the line color back and adds edit points at each vertex.
Hover over one of the edit points, click and drag.
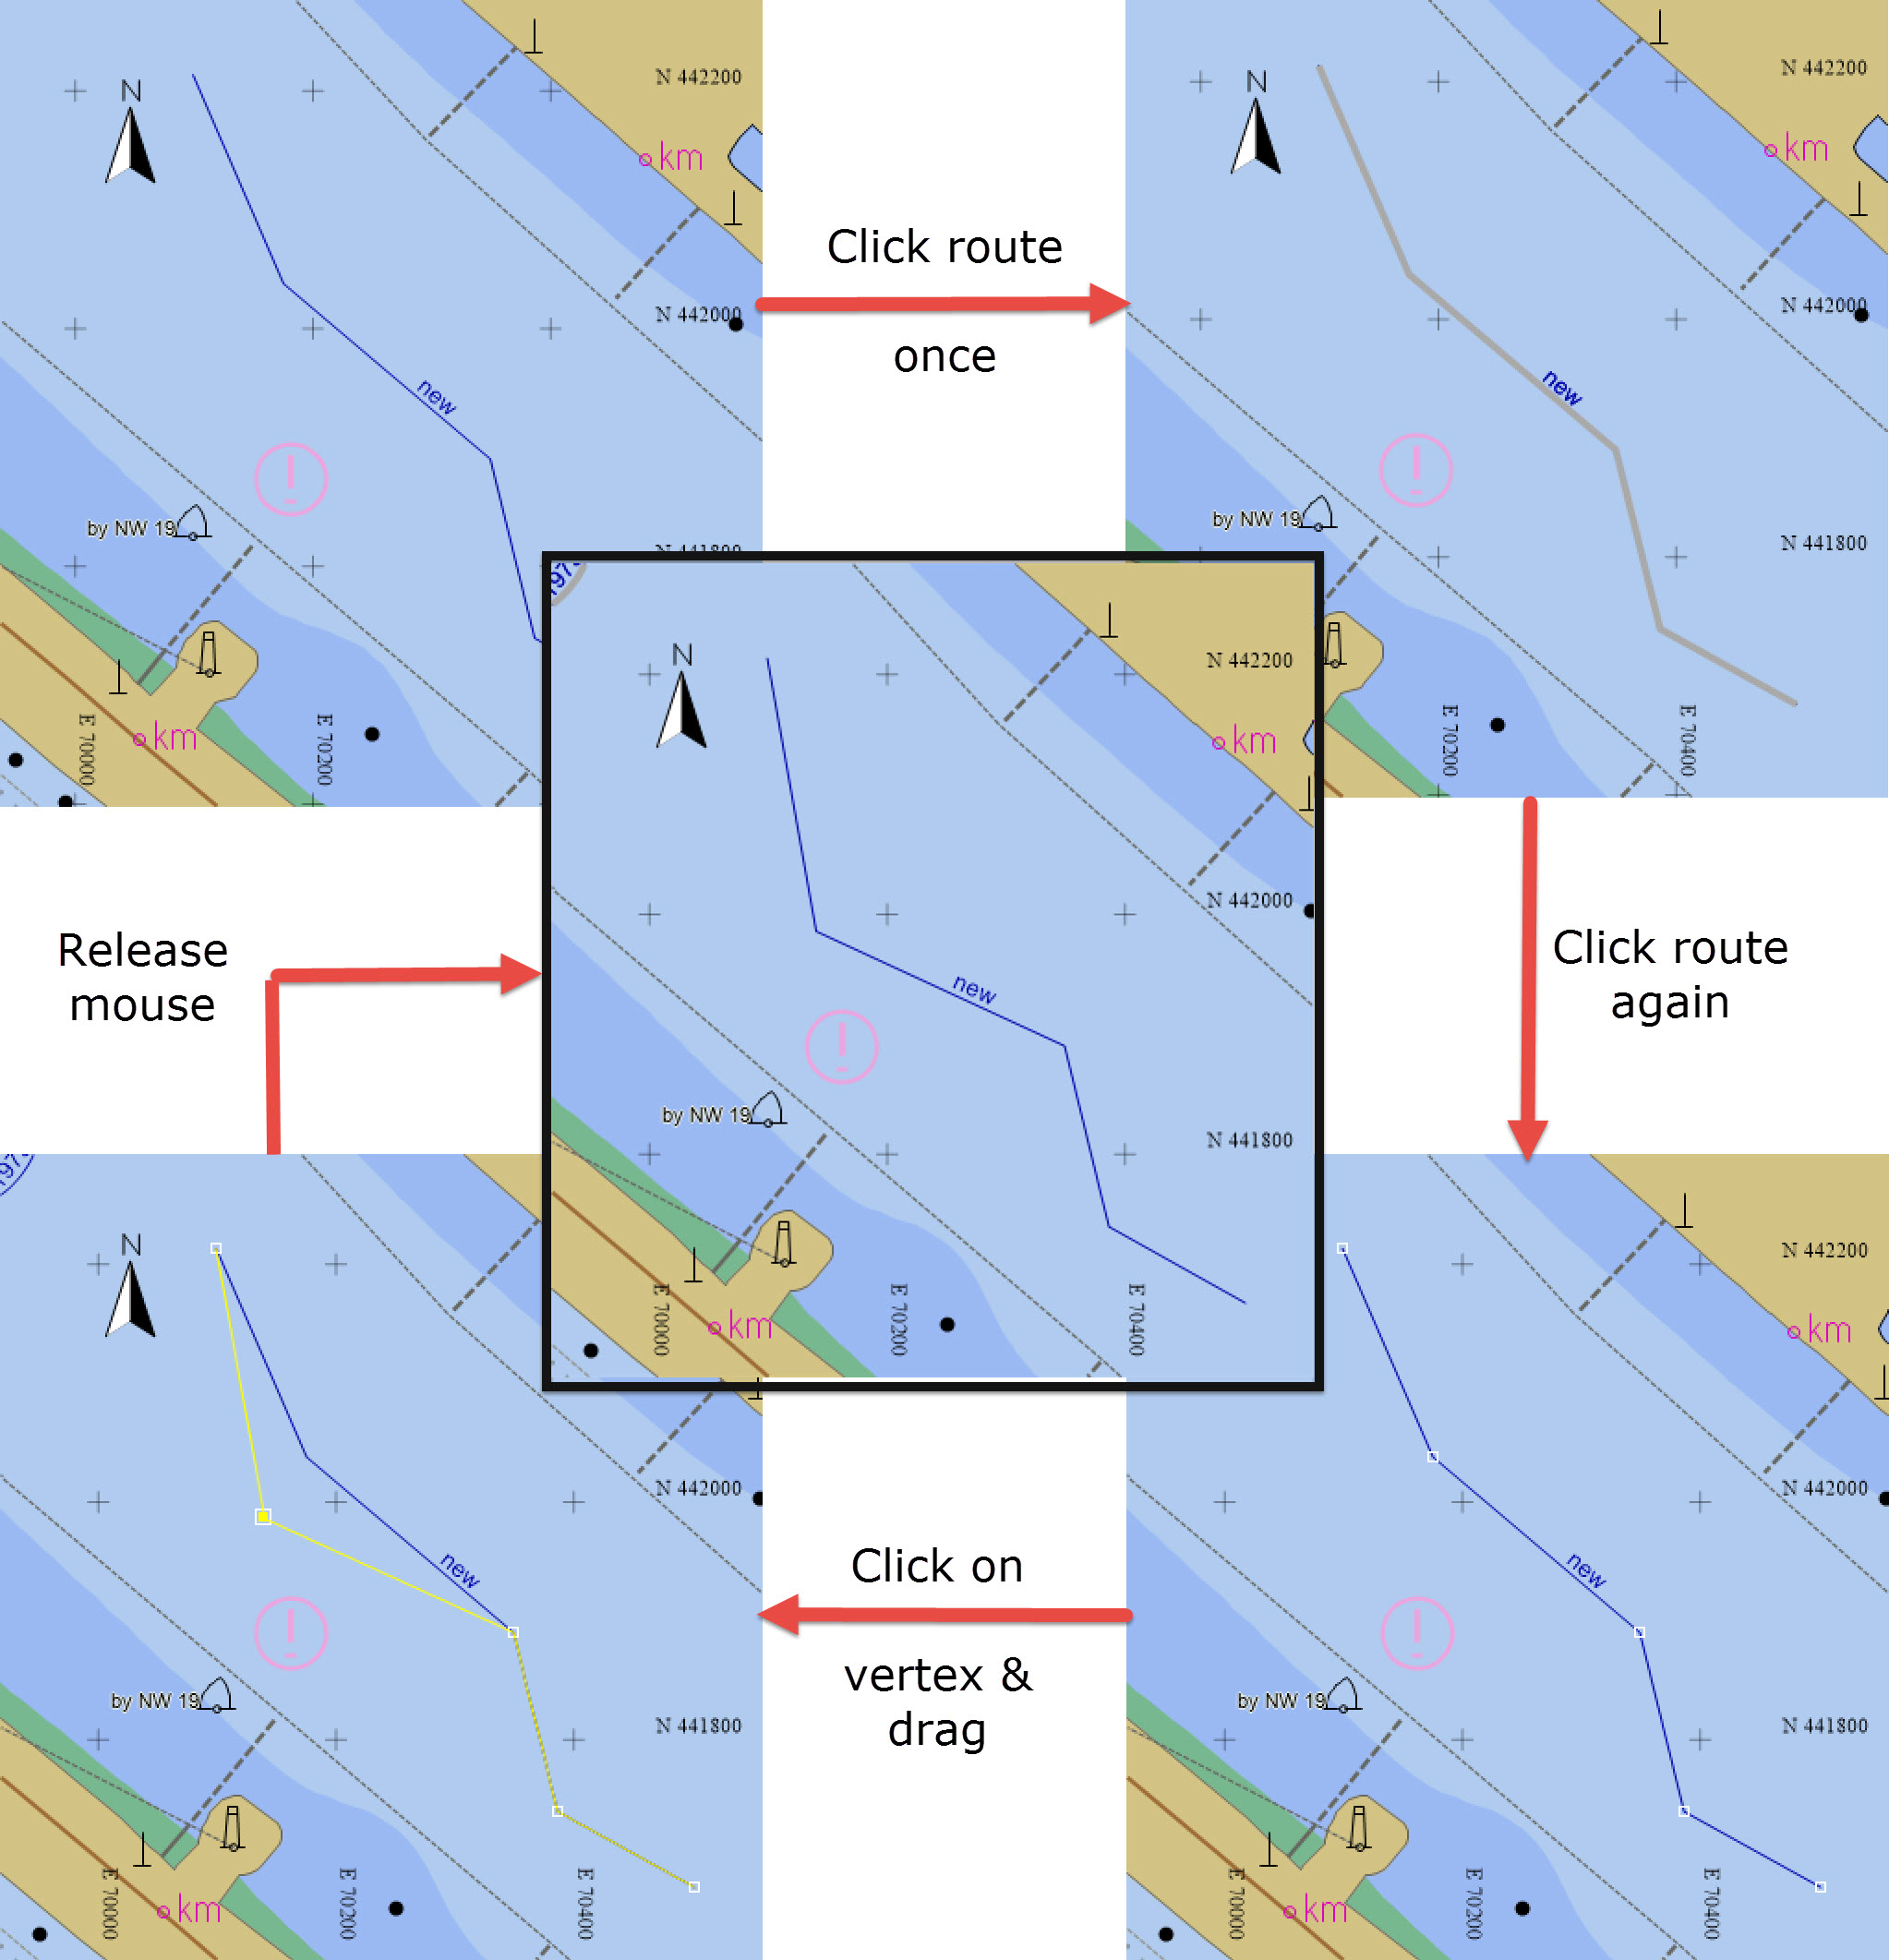
Clicking once on the route changes the color to grey.
Clicking again changes the route color back and adds edit points at each vertex.
Hover over one of the vertices, click and drag.
Release mouse button when vertex is appropriately placed.
While the focus is still on the route line edit points remain at each vertex for further moving.
Click anywhere in the panel and the route reverts to grey.
Removing the focus from the route changes the line color back to its original.
Return to top of page.
Export Data
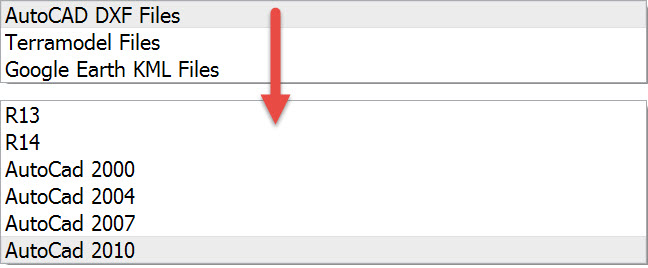
Export data to one or more of the following formats:
Actions - Clipping Lines
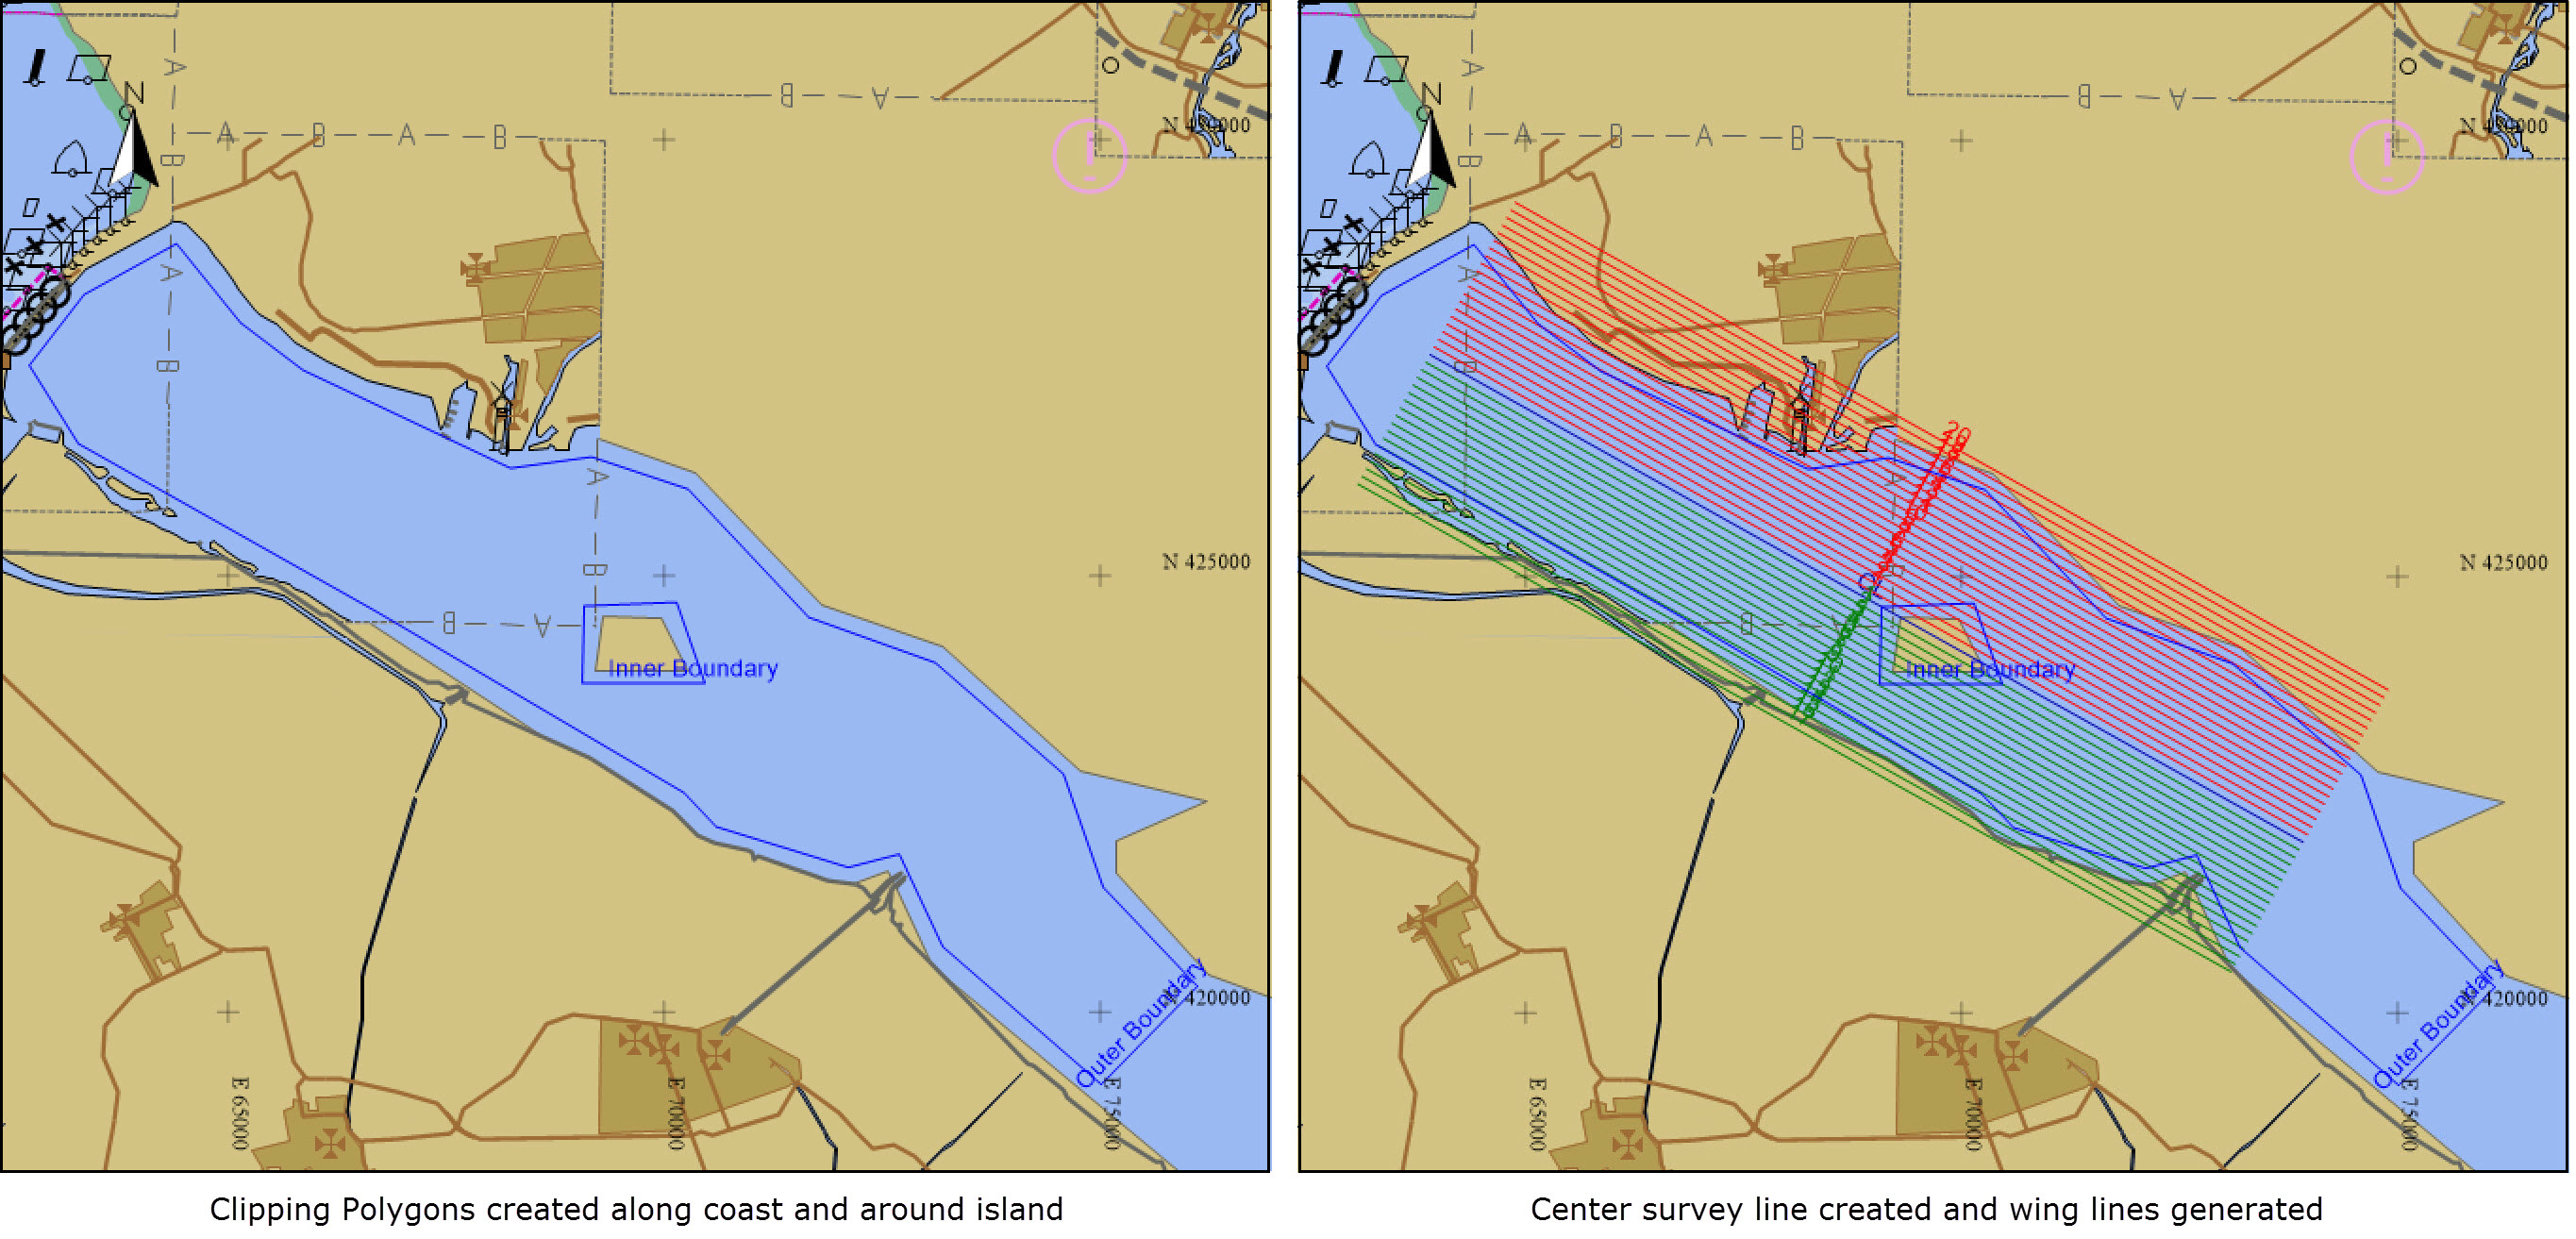
By way of an example, a survey to be performed in an area with an irregular coastline and an island:
Clip Outside
Make sure the correct layer is selected, i.e. the layer on which the lines to be cut are resident.
Select the larger polygon and click on 
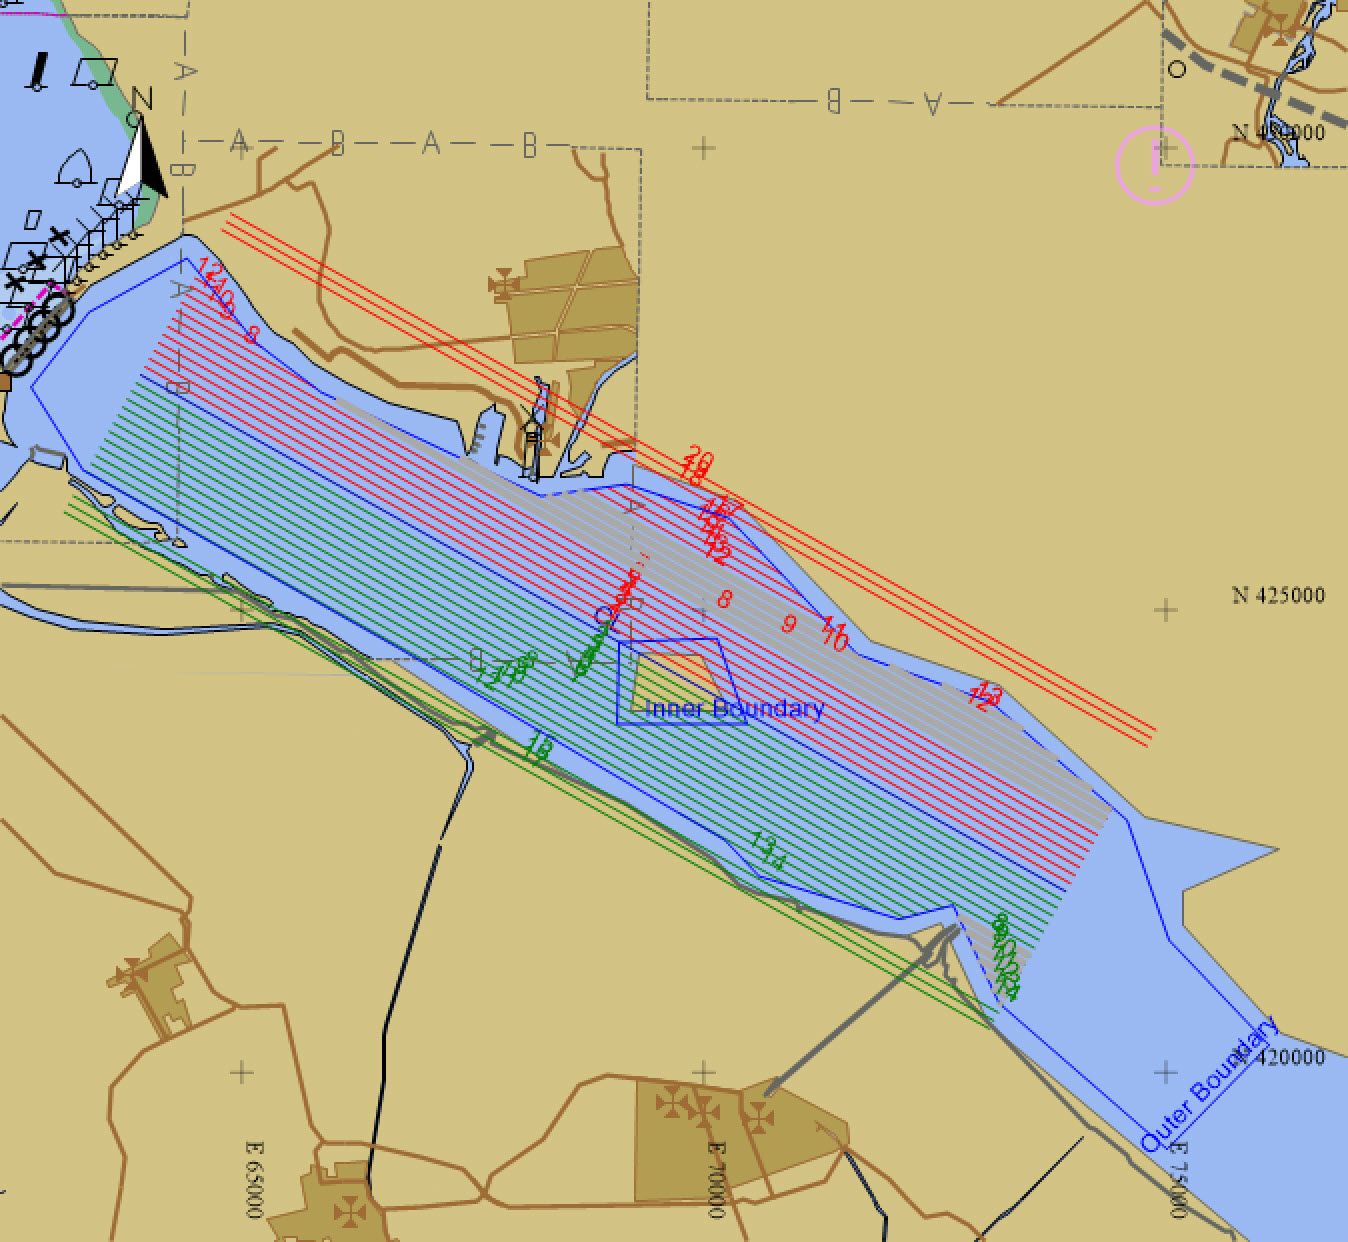
For the lines that cut the polygon, the pieces of lines that fall outside are cut.
Any lines that do not cut the polygon are unaffected and should be removed by hand.
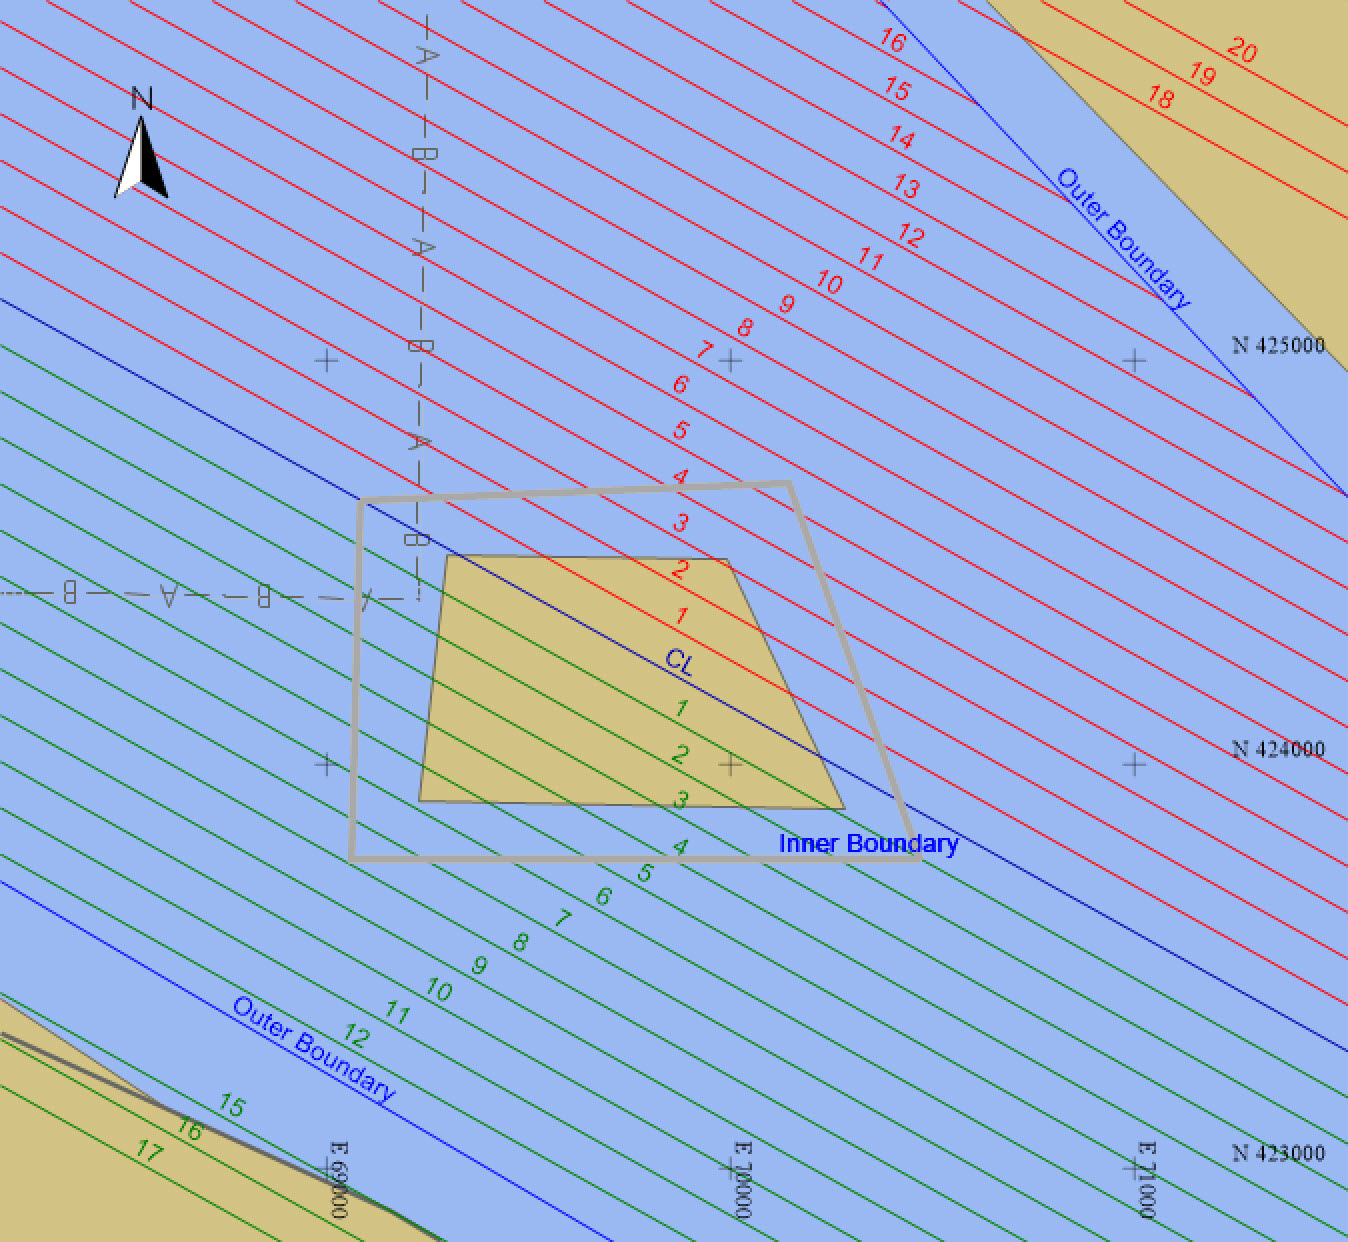
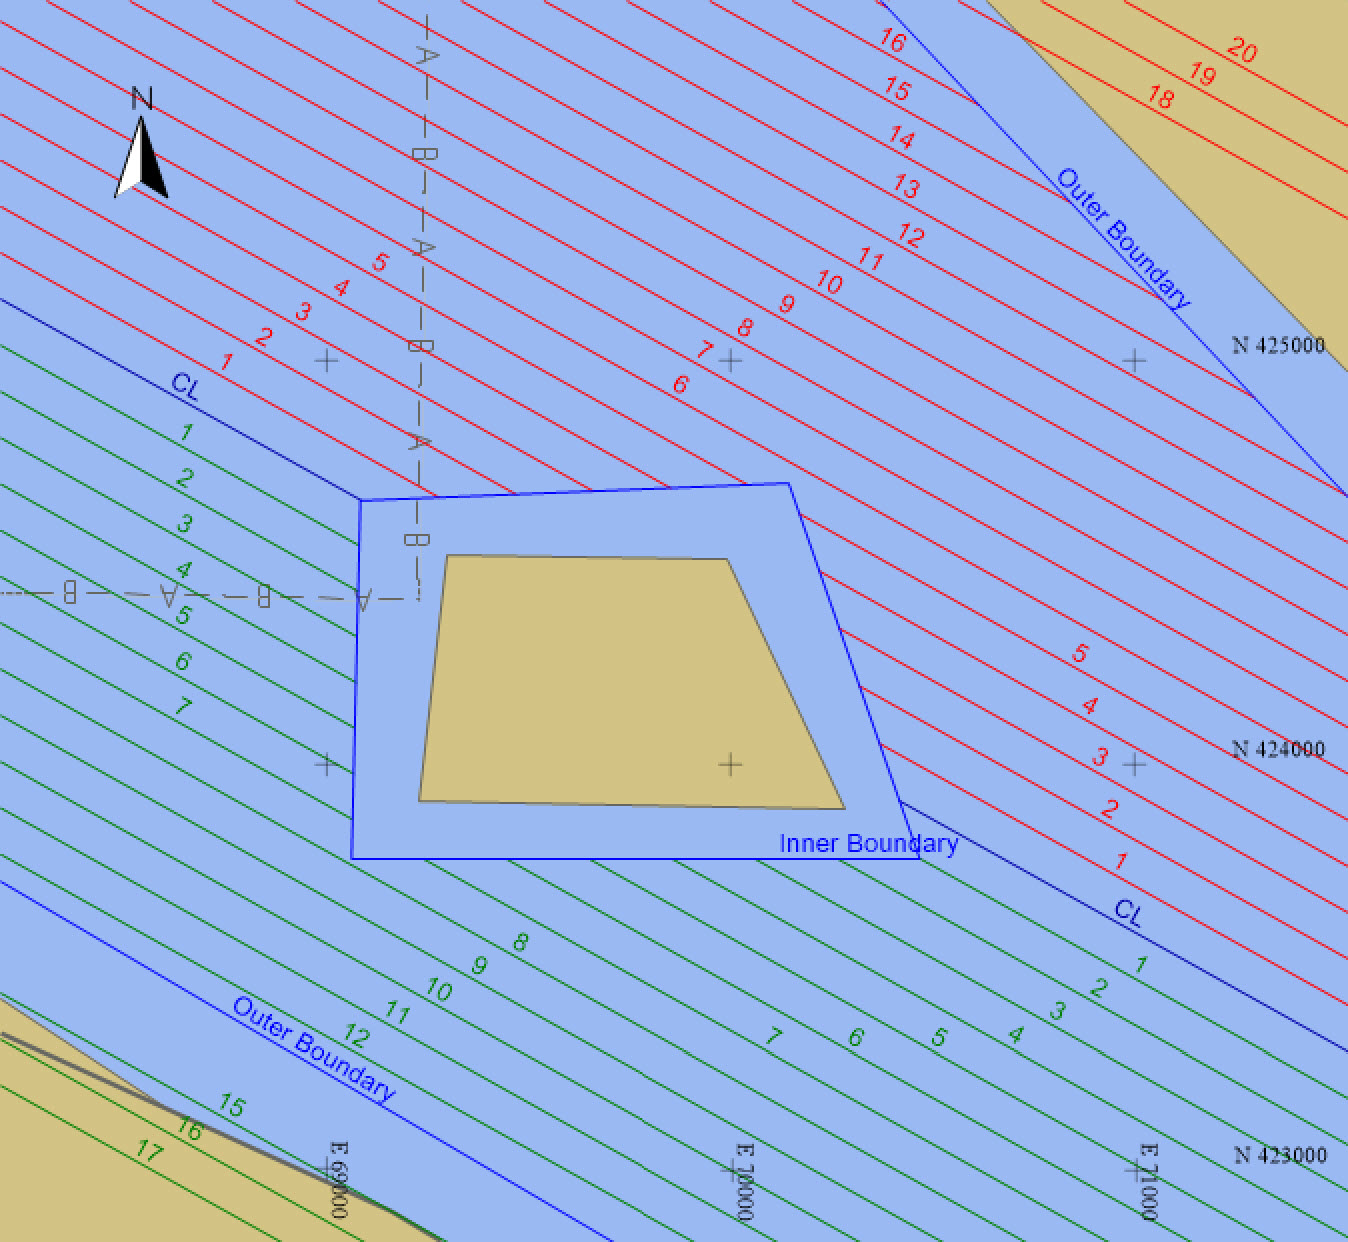
Clip Inside
Select the smaller polygon and click on 
Before clipping:
After clipping:
Return to: top of page
Return to: How-to Dredging