
On this page:
In the Survey Manager, data grids are often used for showing properties of multiple items located in such places as the Points Editor and Project Explorer.
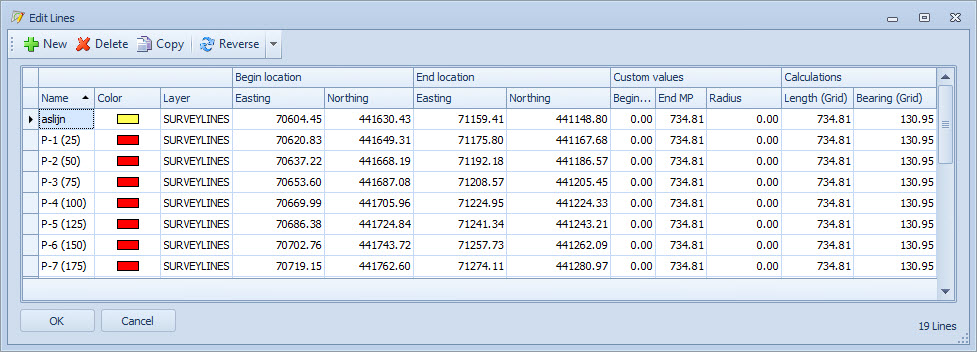
The data grids offer many opportunities for customization such as filtering, sorting and grouping.
Most of these options are found by right clicking on the column headers to open the contextual menu.
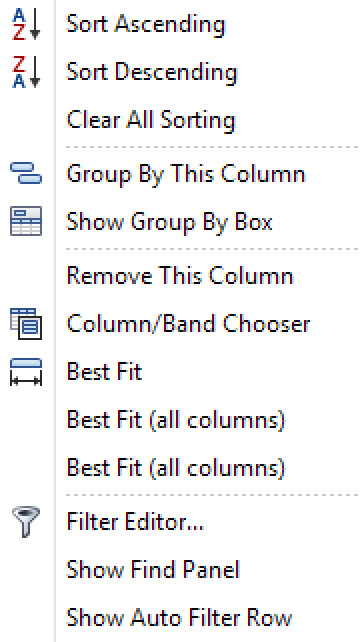
Contextual menu
|
Options |
|
|---|---|
|
Sort Ascending |
Sorts values in the selected column. All other columns change accordingly. Sorting the data can be done in two ways:
When the column is sorted ascending it will show an arrow pointing up. Not available for Color and Layer. |
|
Sort Descending |
Sorts values in the selected column. All other columns change accordingly.
When the column is sorted descending it will show an arrow pointing down.
|
|
Clear Sorting |
Option only available when clearing sorting in the same column that was previously sorted.
|
|
Clear All Sorting |
Option only available when trying to sort in a different column than the previous one sorted.
|
|
Group By This Column |
This option organizes the data according to the selected column. See Grouping Data below. |
|
Show/Hide Group by Box |
Opens a panel above column titles. Drag column header into panel to group data.

|
|
Ungroup |
Option is activated when right clicking in the same column as was used to Group. |
|
Remove This Column |
Removes the selected column from the data grid.
|
|
Column/Band Chooser |
Add and subtract Bands and Columns. A Band is the header of a number of Columns.
|
|
Best Fit |
Sets the selected column width to best fit the column title and data values. |
|
Best Fit (all columns) |
Sets the width of all columns to best fit the column title and data values. |
|
Filter Editor |
User defined filter(s) for advanced queries on the point/line/polyline data.
|
|
Show Final Panel |
Find data more quickly by using this option to search for specific items.
Searching the data grid highlights all the corresponding data that was typed in the search box. |
|
Show/Hide Auto Filter Row |
Adds a row above the first row of data.
|


Editing
Editing data grids can be very efficient when selecting multiple cells.
For instance when the colors of multiple items need to be changed, this can be done at the same time.
Most of the data grids support Clipboard functionality:
-
Ctrl+C: Copy the selected data to the Clipboard.
-
Ctrl+V: Paste the data from the Clipboard to the selection.
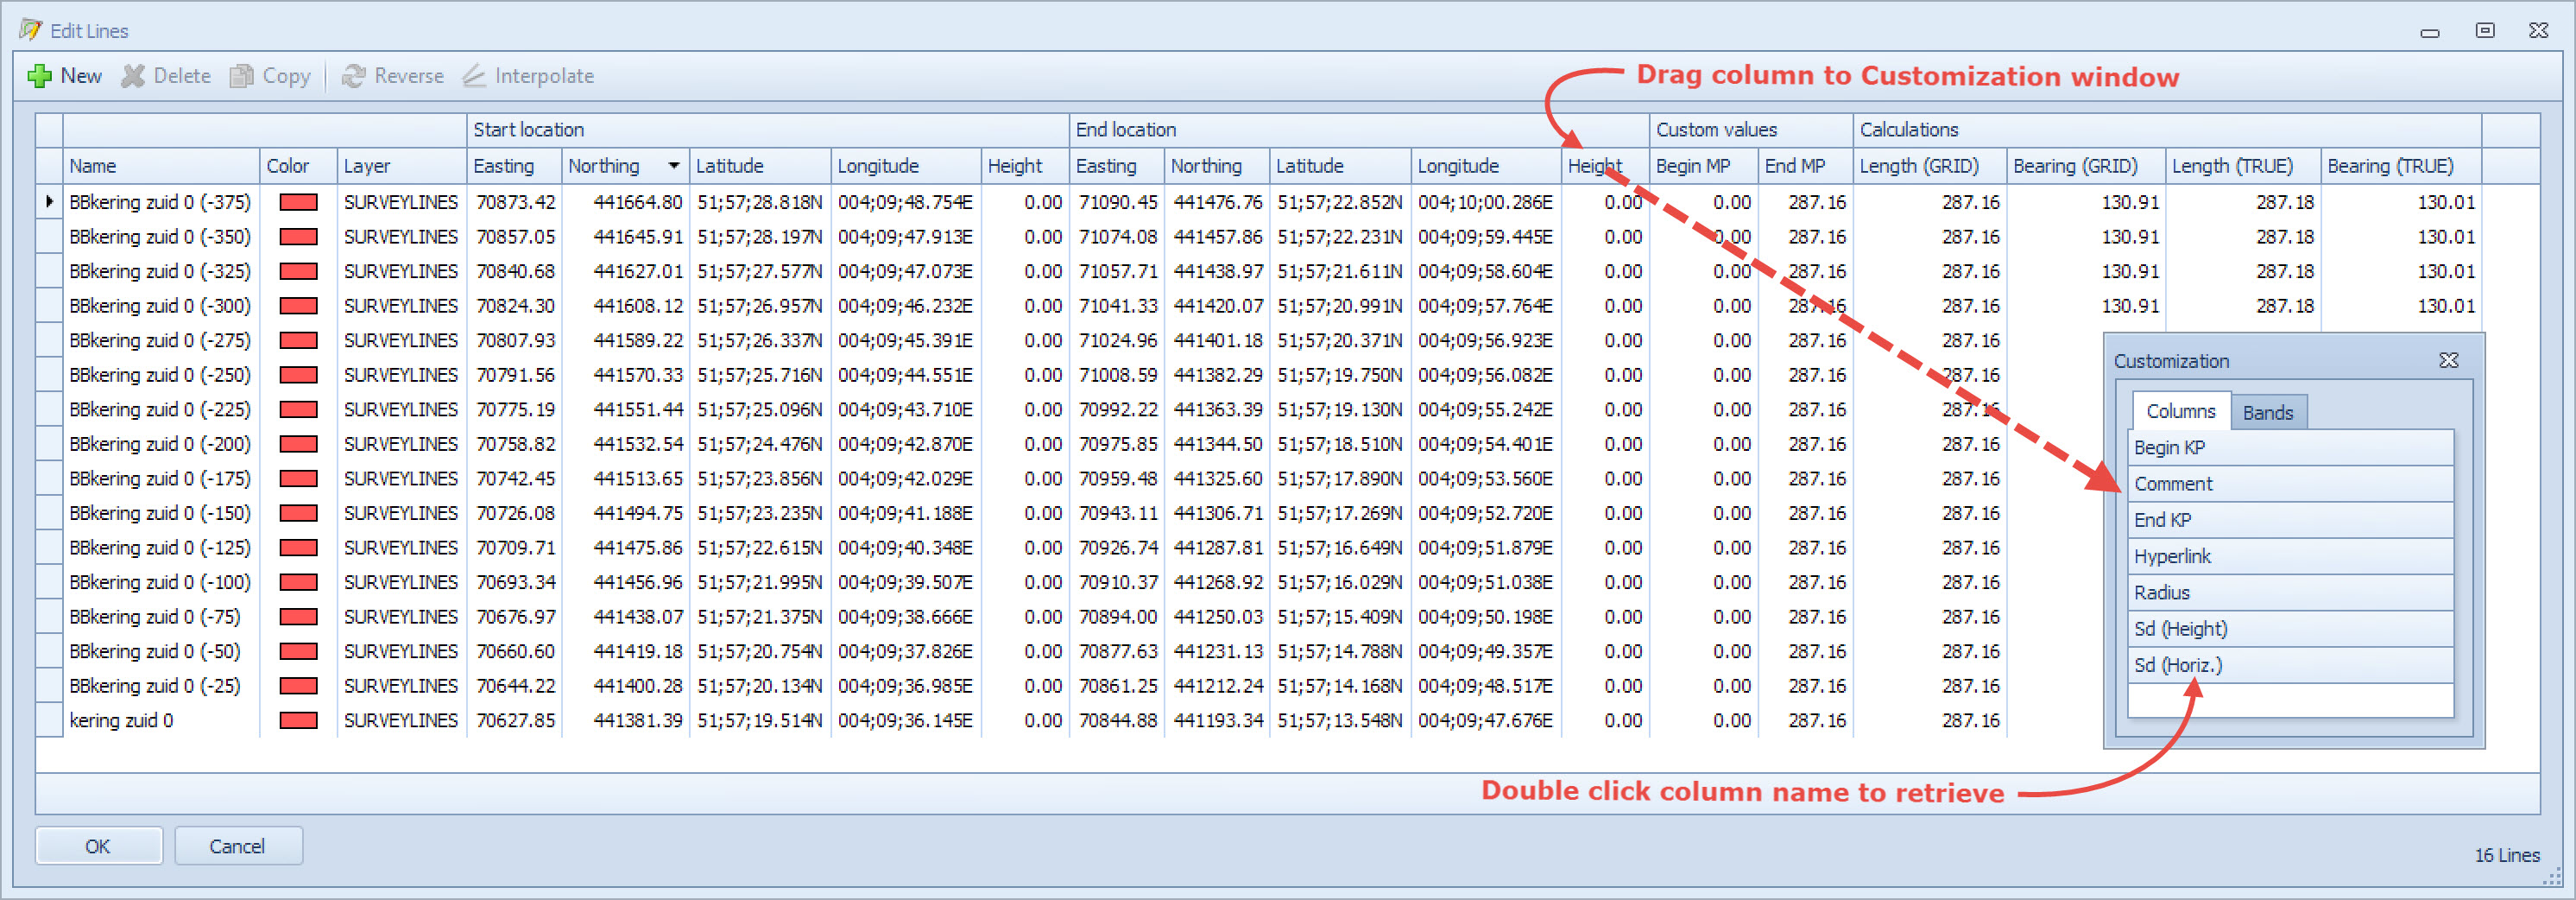
Columns and Bands
A Band is the header of a number of Columns.
Point Bands & Columns

Line Bands & Columns 
Polyline Columns (no Bands) 
Order of columns:
Done by simply dragging a column header to the desired location. Columns can only be re-ordered within their own Band
Adding & Removing columns:
Columns are removed by dragging them out of the data grid.
Removed columns are retrieved using the Column/Band Chooser and double-clicking on the column name.
The option is available in the pop-up menu when you right click the grid columns.
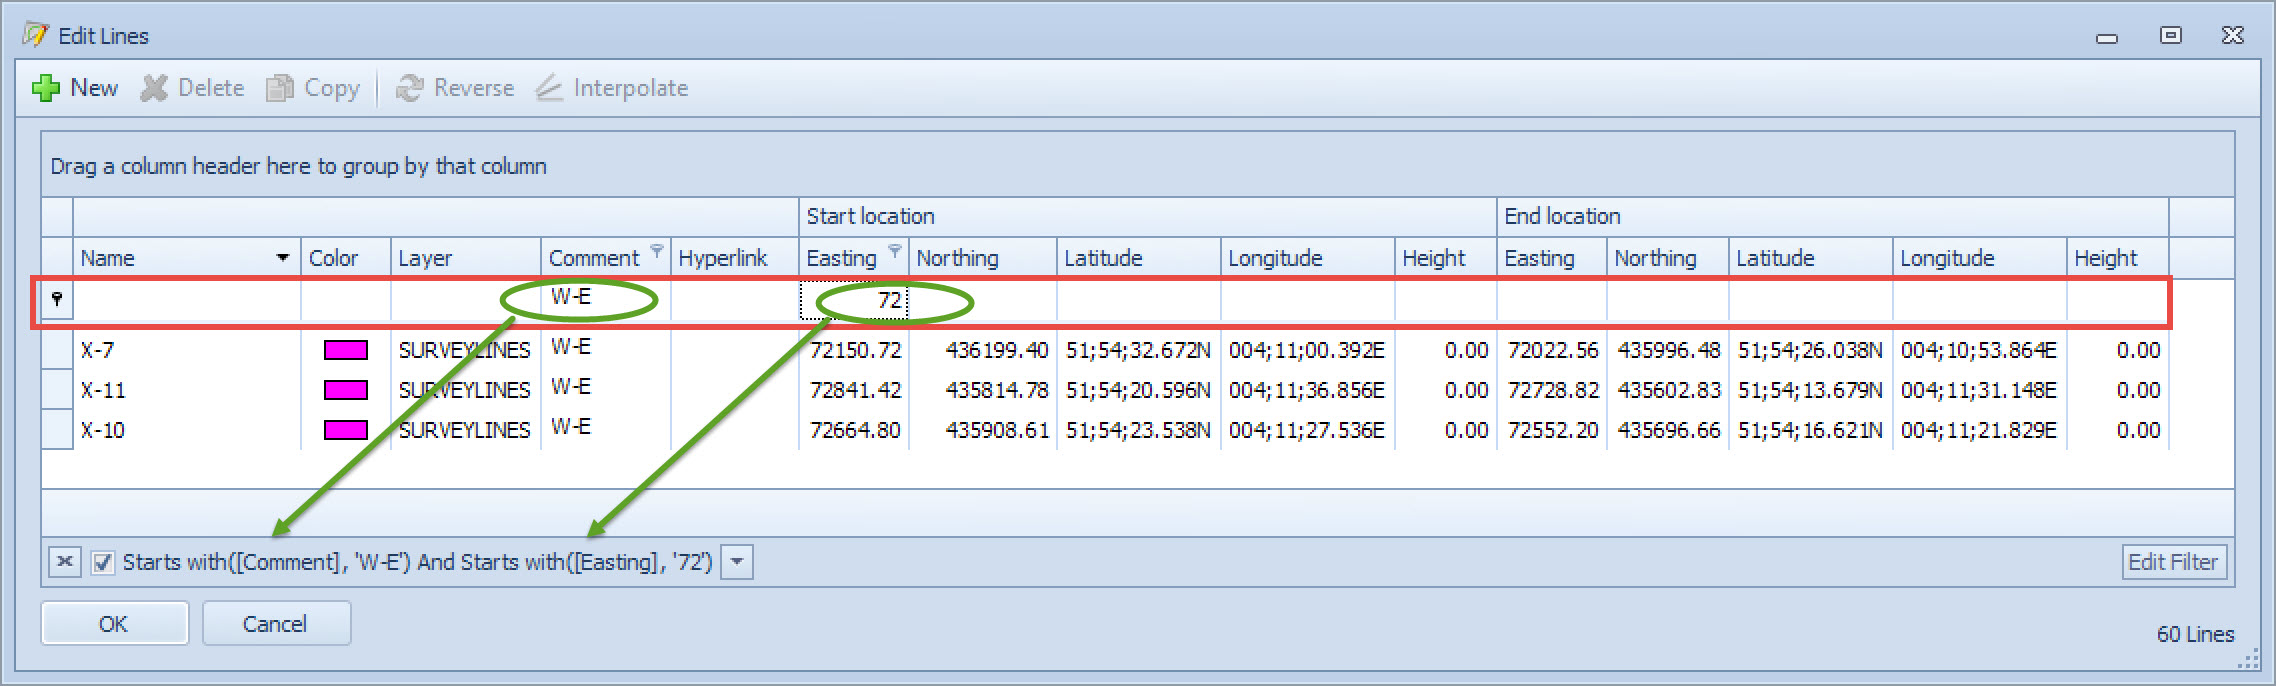
Grouping Data
Sometimes it is useful to group particular data records that share a common criterion.
Just to illustrate the functionality this example uses the comment column in which the preferred sailing direction is indicated.
Of course other columns can be used for grouping.
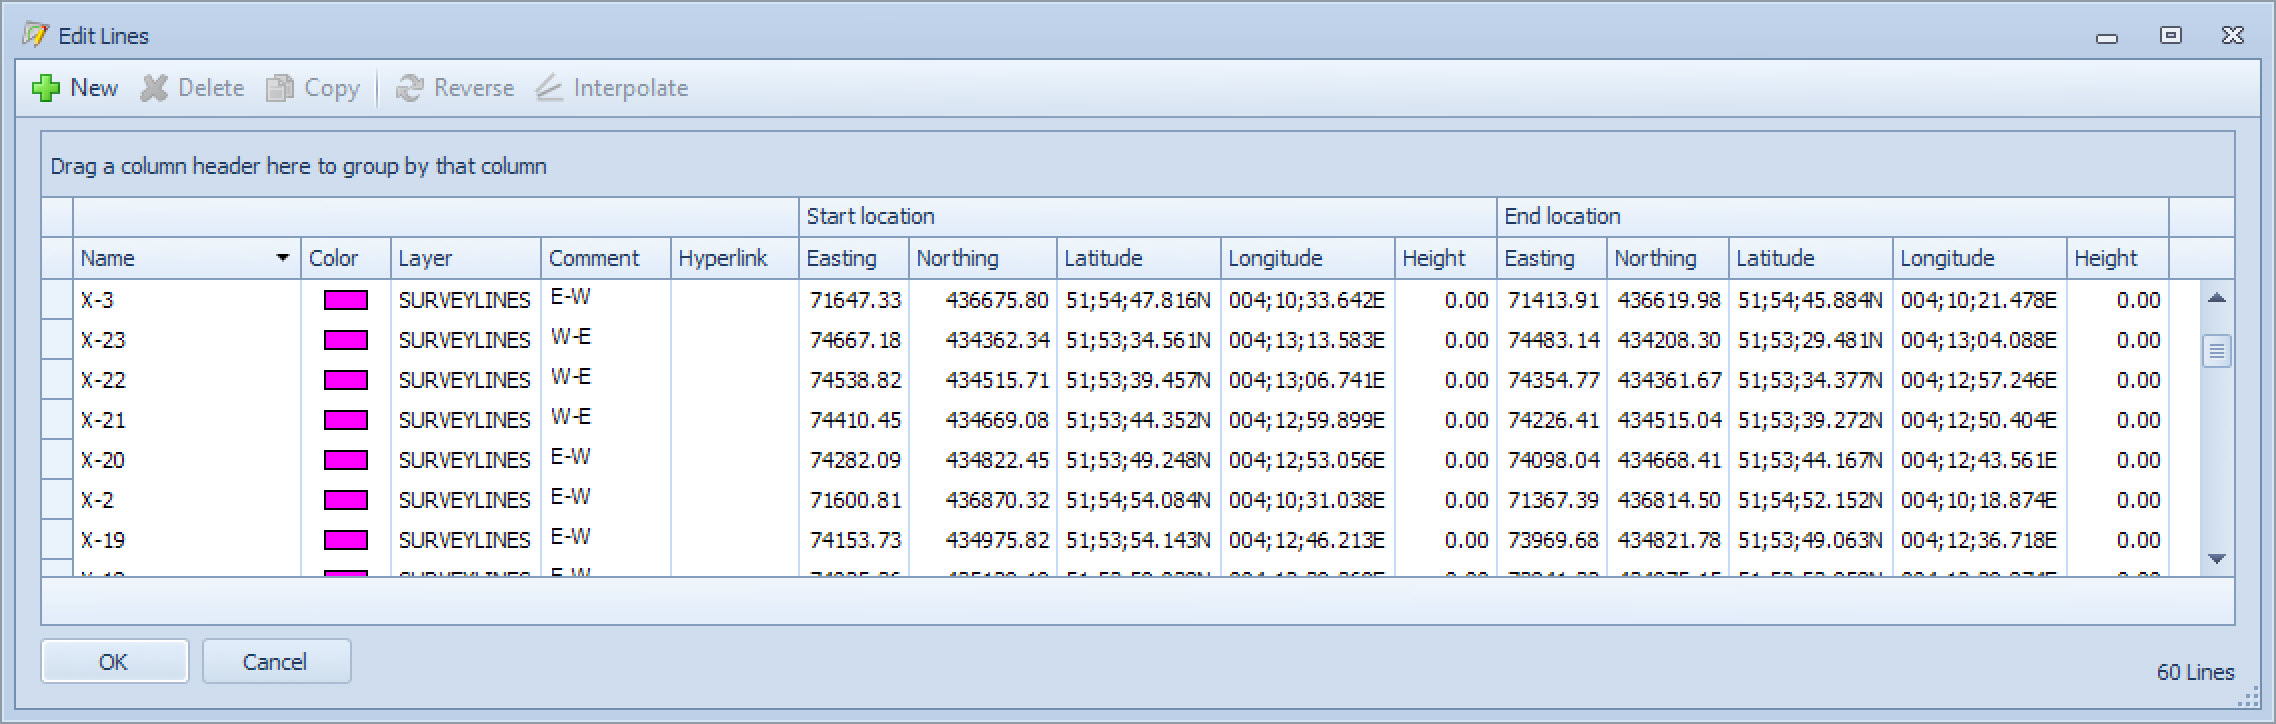
To group lines according to sailing direction, right click on the Comment column header and select Group By This Column.
Alternatively right click on any column header and select Show Group By Box which adds a panel above the Bands. Then click on the Comment column header and drag it into the added panel.
Either way the result looks like this:
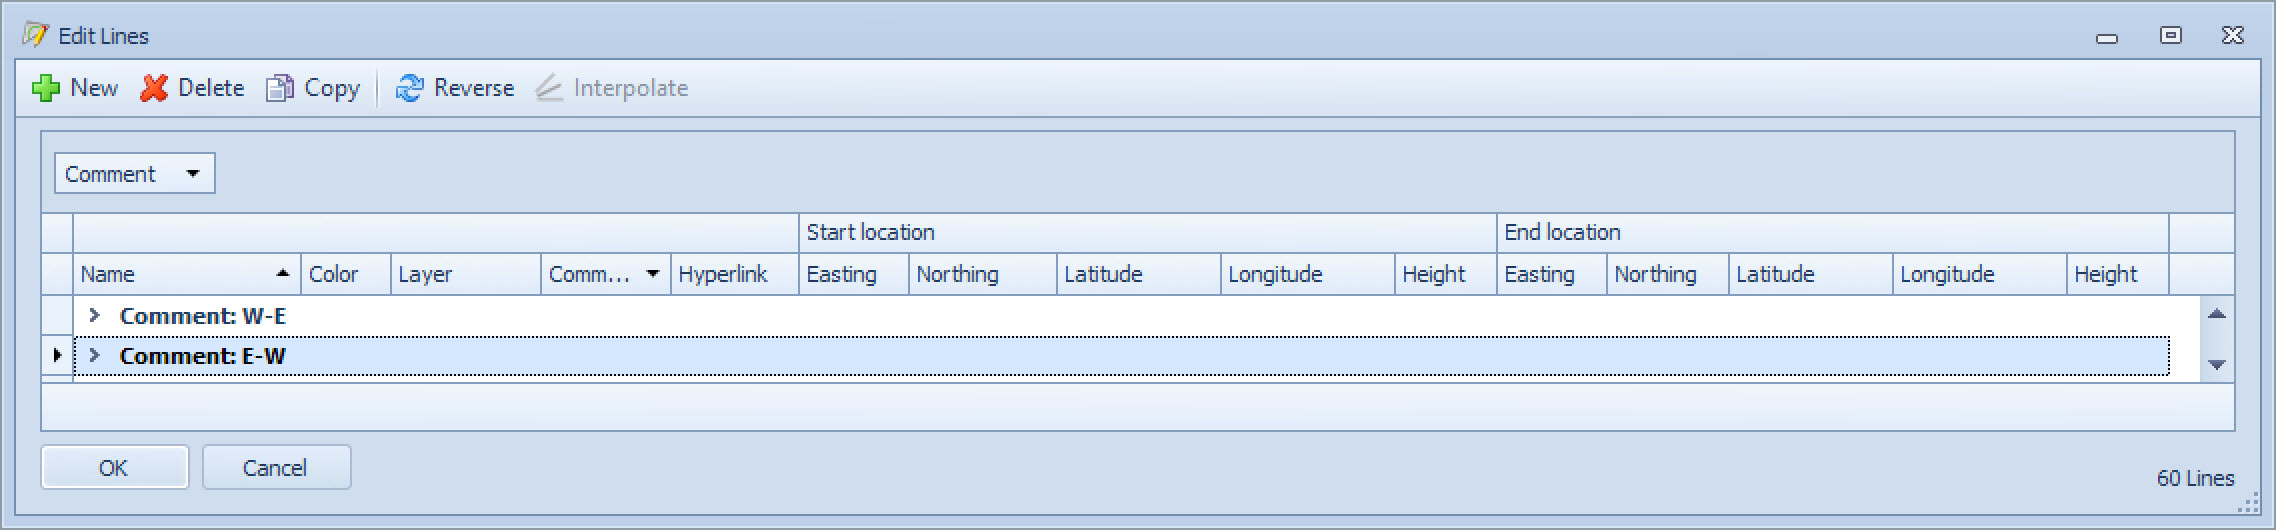
Click on > to expand the listing:
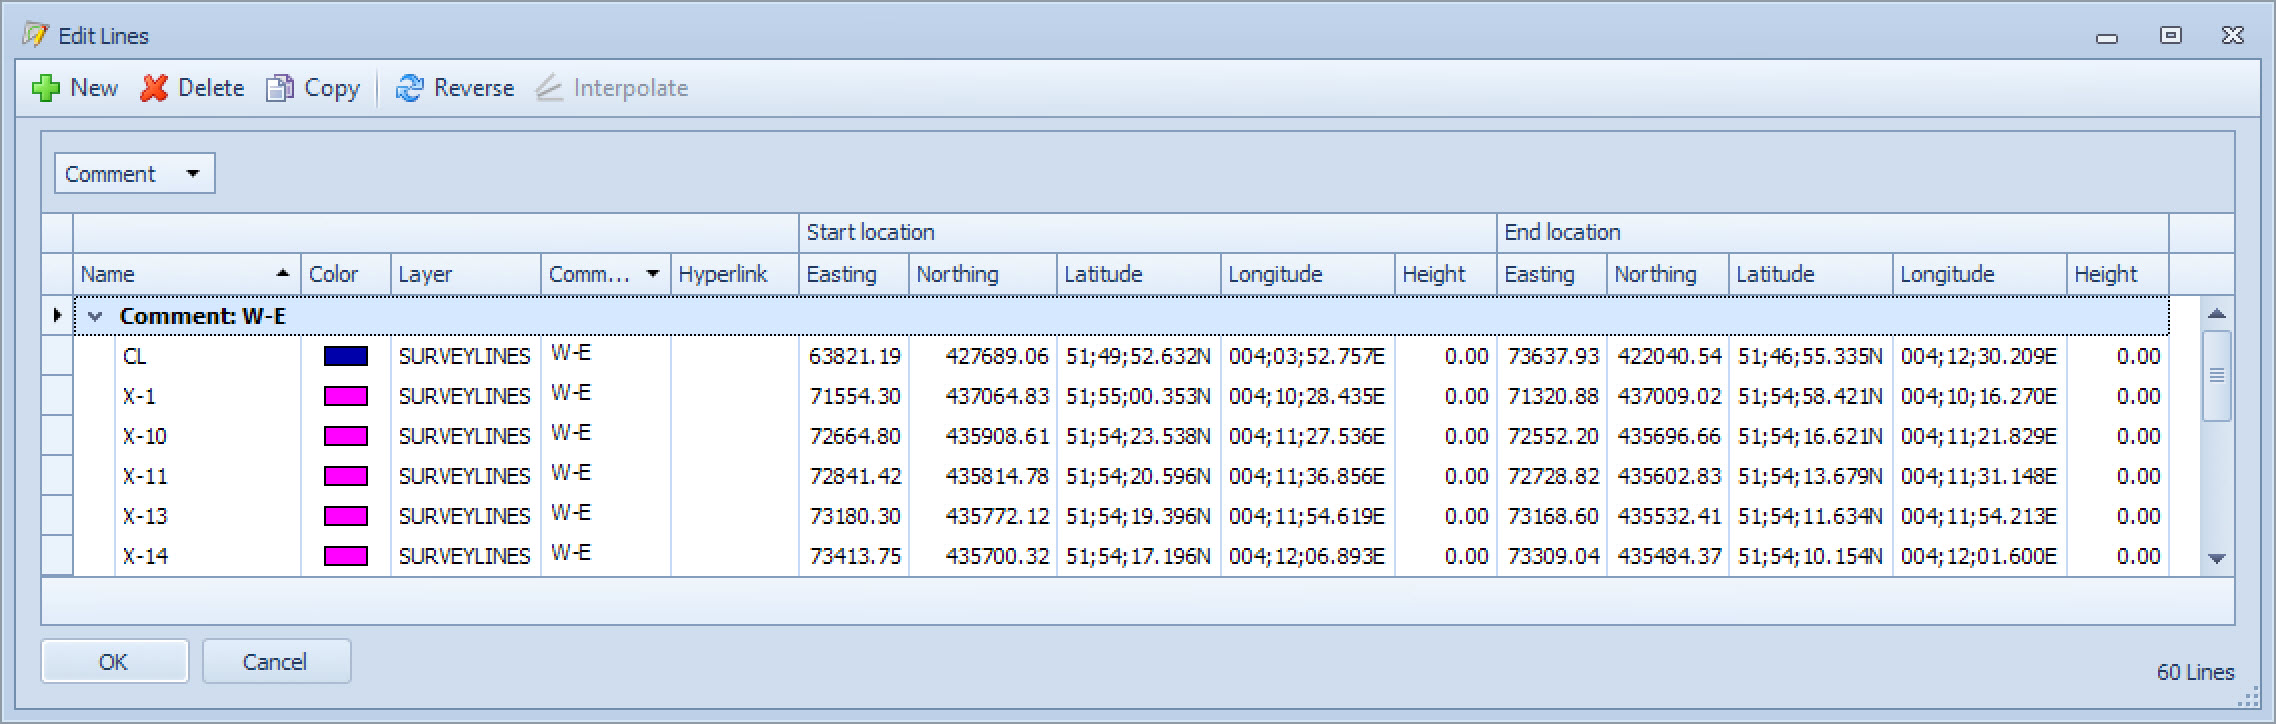
Lines are now grouped by direction W-E and E-W.
Ungrouping
To ungroup, right click on the Comment column header and select Ungroup.