




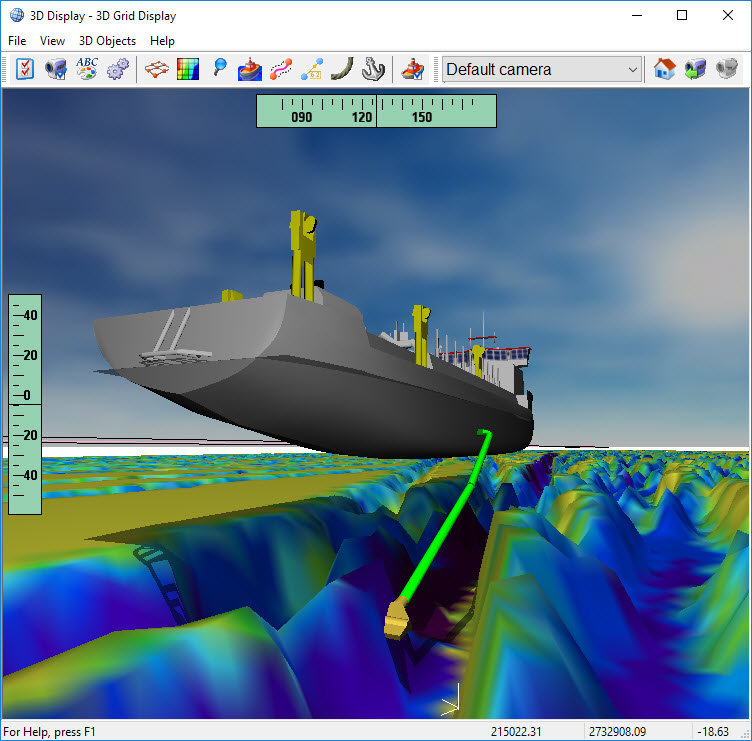
The 3D Grid Display shows multiple three dimensional objects simultaneously: DTMs with surface texture, static objects, water surface, range markers, cables, survey lines anchors, and vessels (dredgers, dredge heads). Vessels are seen moving in real-time updating DTM depths as dredging proceeds, both excavation and dumping.
3D vessel models must be created with 3rd party software as Direct X (*.x) files before they can be visualized here.
Opening a Display
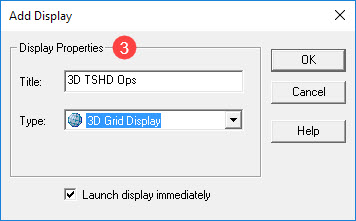
Take the following steps to create and configure a 3D Grid Display:



Orienting the Display
|
Button |
Description |
|---|---|
|
Left button |
Hold the left mouse button down. Move the mouse left and right spins the scene about a pivot point. Move the mouse up and down rotates the scene vertically about the same pivot point. |
|
Right button |
Right click in the scene to set a new pivot point. If the click is on an object the pivot point is located on the object itself. Otherwise the pivot is projected to the DTM surface. |
|
Scroll wheel |
Zooms in toward and out from the pivot point. |
Alternatively use the commands available in the View menu: Rotate, Pan Horizontally, Pan Vertically, and Recenter.
Return to top of page.
Customizing the Display

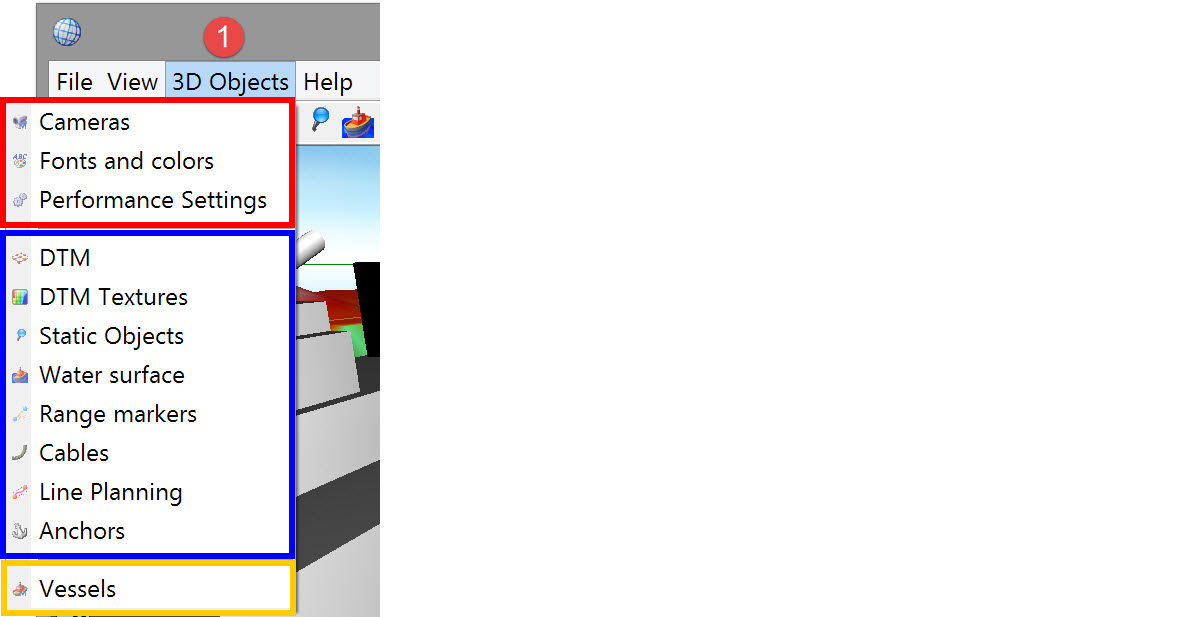
opens the View Properties dialog. Which page of this multi-page dialog depends on which command is selected:
Icons in the Red box above open the View page.
Icons in the Blue box above open the Objects page.
Icons in the Yellow box above open the Vessels page:
Vessels

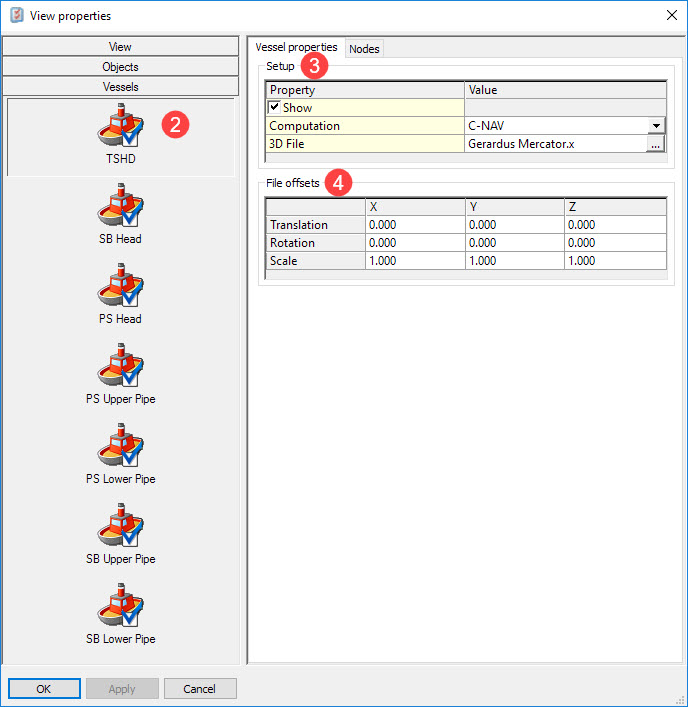
Then click on 

|
File offsets |
|
|---|---|
|
Translation |
The 3D file might not completely match the dimensions of the vessel, so here it can be shifted in any of the three axes.
|
|
Rotation |
Enter a value in degrees to rotate the model about any of the three axes. For example entering Y=90 rotates the object 90 degrees to starboard.
|
|
Scale |
It may be necessary to re-scale the object, sometimes because the units used in the original file are not real world units, or to convert meters to feet or vice versa..
|
Return to top of page.
Objects
DTM
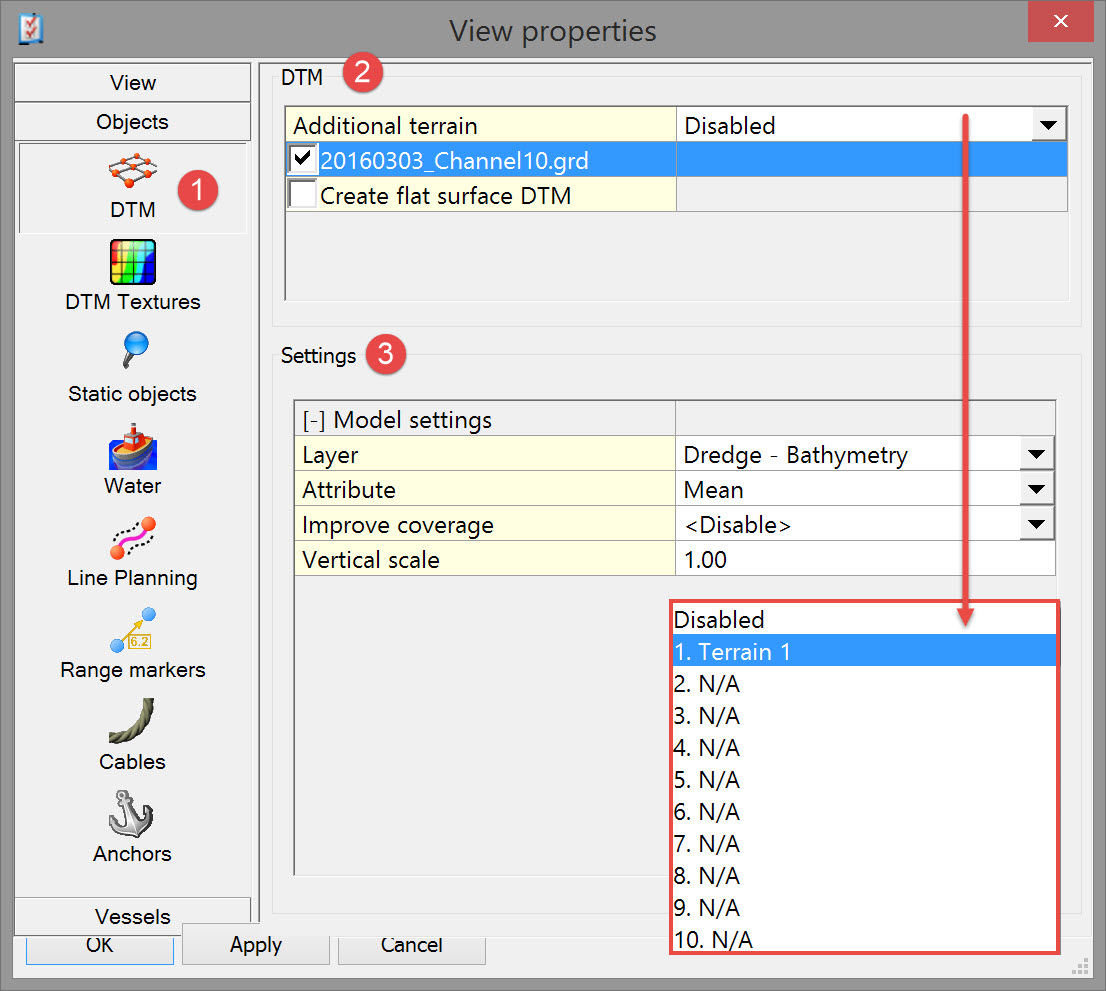
Select the data to be used to build a 3D wireframe. A wireframe model represents the shape of a solid object by its characteristic lines and points.

|
DTM |
|
|---|---|
|
Additional terrain |
In the Controller's Session Setup - Planning you can add Additional Terrains as an alternative. One of up to 10 of these can be selected.
|
|
<currently active file>.grd |
The grid file selected in the Session Setup of the Controller is automatically added. Switch it on or off.
|
|
Create flat surface DTM |
This option creates an infinite horizontal plane when no data from the other selected DTM files is available.
|
It depends on the type of layer selected which kinds of settings need to be set.
|
Settings |
|
|---|---|
|
Model settings |
Press the [+] sign to open the tree structure menu. |
|
Layer |
From the drop down menu, select which layer to show in the 3D grid display. |
|
Attribute |
From the drop down menu, select the attribute of the selected layer to be shown.
|
|
Improve coverage |
The sounding grid is built up from multiple detail levels.
|
|
Vertical scale |
By default this is set to 1. Increase this value to exaggerate the vertical scale of the grid. |
|
Height |
When a flat surface DTM was selected, the height of this surface is shown here. |
Press <Apply> to see the effects of changed settings without having to leave this menu item.
Return to top of page.
DTM Textures
Geo-referenced image files must be in *.ecw file format. These files are created with the ER Mapper Image Compressor. For files up to 50 MB a free version is available as part of the QINSy release.
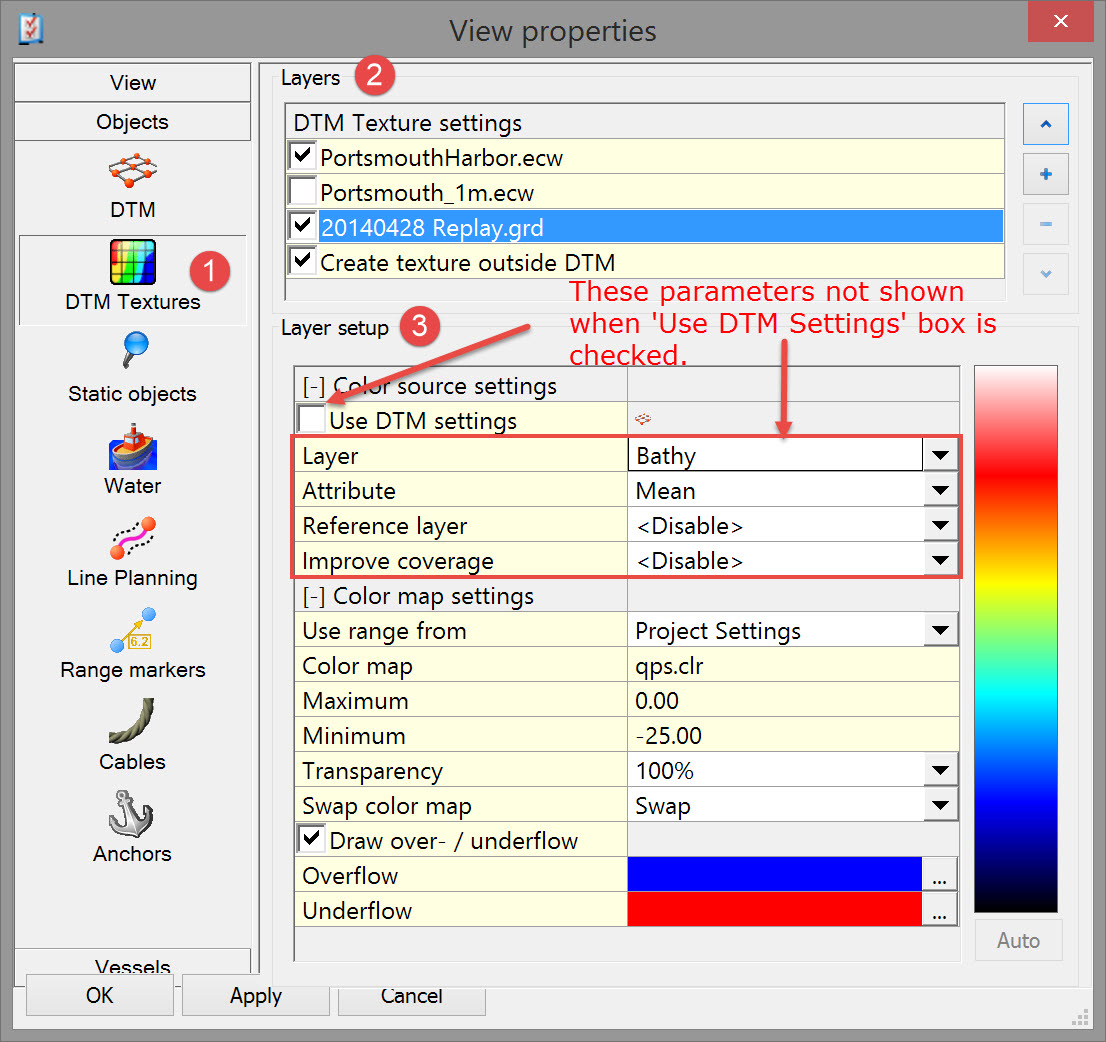
Use these options to set the colors and textures for the selected DTM files. A geo-referenced image file can be overlain on the DTM surface.

|
DTM Texture settings |
|
|---|---|
|
|
Add one or more *.ecw files to drape on top of the DTM. For example an orthoimage like a sidescan mosaic or an aerial image. |
|
|
The order of the layers is set using the up and down arrow buttons at the right hand side of the dialog.
|
|
|
Remove any *.ecw files no longer needed. |
|
<no file>.grd |
The active grid file selected in the Session Setup of the Controller is automatically added. It can be switched on or off.
|
|
Create texture outside DTM |
This option creates an infinite horizontal plane where no data from the other selected DTM files is available. This is meant as a visual aid only.
|


|
Layer Setup |
The setting of the layer selected in the Layers list above is visible.
|
|---|---|
|
Color source settings |
If necessary press the [+] sign to open the tree structure menu. |
|
Use DTM settings |
When the box is checked you are electing to use the same layer and attribute that was set in the DTM dialog.
|
|
Layer |
Only available if 'Use DTM settings' is disabled. Select the layer to be used for color coding. |
|
Attribute |
Only available if 'Use DTM settings' is disabled. Select the attribute of the selected layer to be used for color coding. |
|
Reference layer |
Only available if 'Use DTM settings' is disabled.
|
|
Improve coverage |
The sounding grid is built up using multiple resolution levels (i.e. if Level 0 has a cell size of 0.5x0.5m, Level 1 has cell size 1.0x1.0m, Level 2 has cell size 2.0x2.0m etc.).
|
|
Color map settings |
|
|
Use range from |
Project Settings - The color range set under the Global Settings option in the Console is used. When the Project Settings are used Color map options are disabled.

button to automatically scale the color map according to detected minimum and maximum depths for the attribute selected in the active grid layer.
|
|
Color map |
A number of maps are predefined in the software. New Color maps are created using the Color Scale Editor program found in the lower panel of the QINSy Console.
Note: Color maps are typically used to visualize a range of bathymetric depths or a range of backscatter intensity values. |
|
Maximum / Minimum |
Set the upper and lower extents for the color map. For depths this is a negative number, for elevations it is a positive number.
|
|
Transparency |
Set the transparency level for the grid layer in order to better see underlying features. |
|
Swap color map |
The colors for deep and shallow will be reversed. For example when using the qps.clr map, white represents the shallower depths of the depth range and black represents the deepest. |
|
Draw over- / underflow |
All data shallower than the maximum value is colored with the overflow color; all data deeper than the minimum value is colored with the underflow color. |
Refer to Sounding Grid Preparation and Importing Design Model for help with creating a grid.
Note that soundings can be imported into the sounding grid or soundings are written to the sounding grid during recording.
Press <Apply> to see the effects of changed settings without having to leave this menu.
Return to top of page.
Static Objects
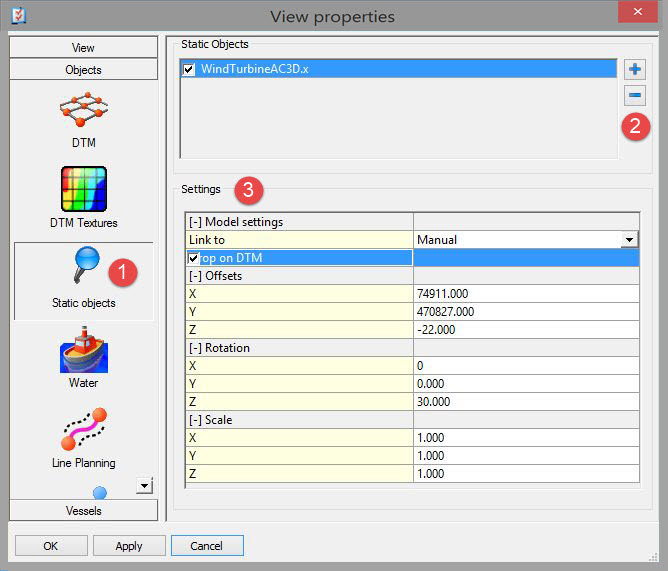
On occasion there may be a need to display objects within the 3D scene that do not move. For example, offshore structures like wind turbines or pipelines. If 3D models of static objects are available, they can be added to the scene.
|
Settings |
|
|---|---|
|
Link to |
Select whether the object should be linked to:
The parameters displayed depend on which 'Link to' option was chosen.
|
|
Drop on DTM |
The Object origin receives the height of the DTM at that location. This overwrites the manually entered Z value.
|
|
Offsets |
These values shift the *.x file relative to the selected location, or they set the absolute position when Link To is set to 'Manual'. |
|
Rotation |
The object is rotated around its own pivot point. |
|
Scale |
The object can be re-scaled if the original model is not created in real world coordinates.
|
Press <Apply> to see the effects of changed settings without having to leave this menu.
Return to top of page.
Water Plane
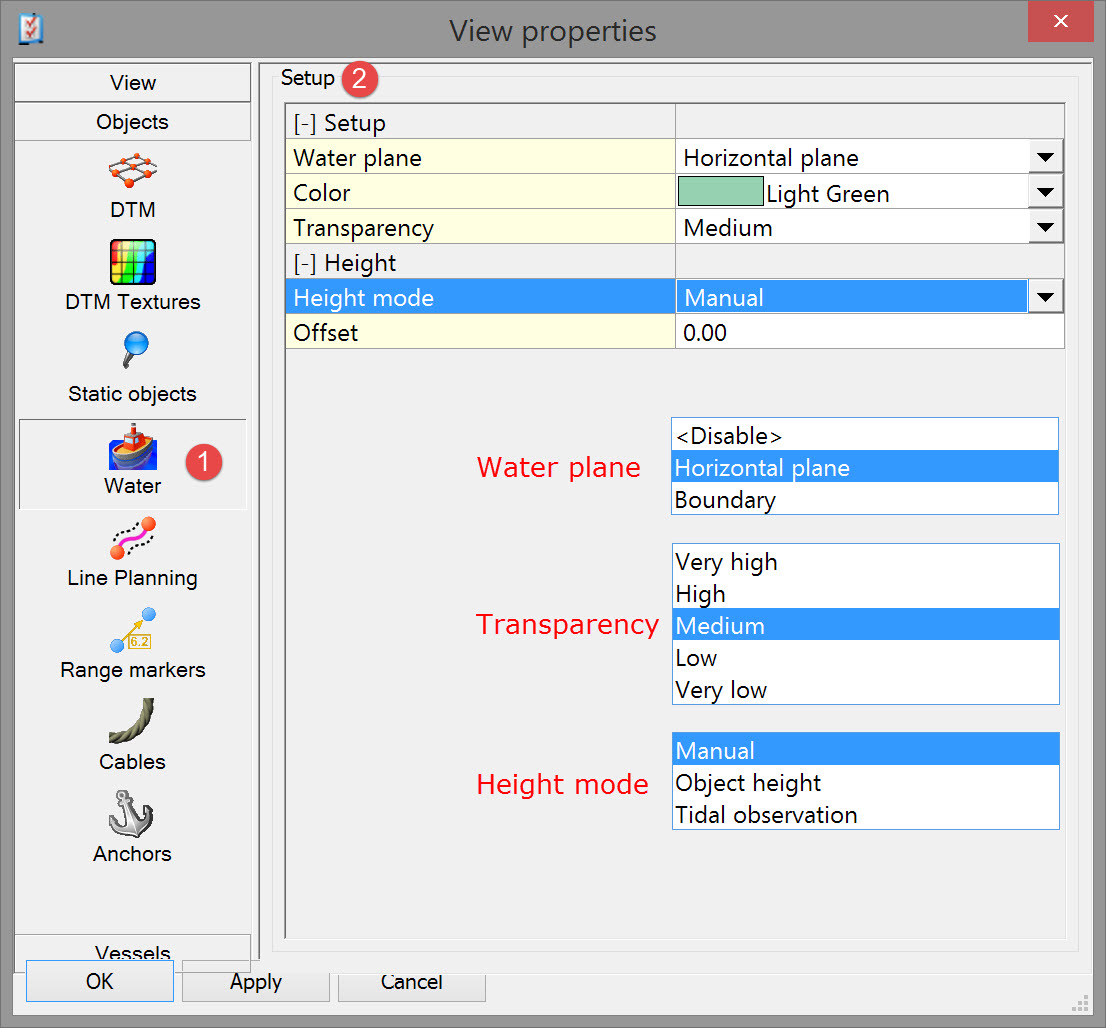
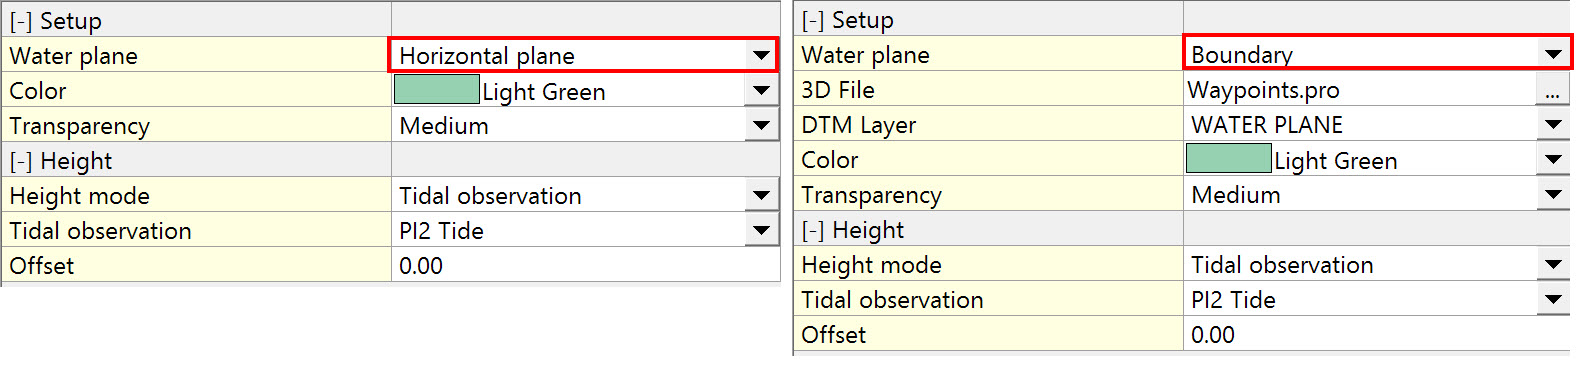
A water surface can be visualized using either a horizontal plane or a DTM from a *.QGF file.
The height of the plane is set using the Height options.
|
Setup |
|
|---|---|
|
Water plane |
Select either a Horizontal plane or a Boundary. The boundary option uses a DTM from a *.QGF file. |
|
3D File |
Only available for the Boundary option. Use the browse button |
|
DTM Layer |
Select the DTM Layer from the selected *.QGF file. |
|
Color |
Select the color for the water plane. |
|
Transparency |
A very high transparency means the water plane is hardly visible.
|
|
Height |
|
|
Height mode |
The height of the water plane is determined by either a Manually entered height relative to Vertical Datum or by an Object height.
|
|
Link to |

Only available if Object height is selected.
|
|
Offset |
In case of a Manual height enter the offset from survey datum to draw the water plane.
|
Press < Apply > to see the effects of changed settings without having to leave this menu.
Return to top of page.
Line Planning
Lines set in Controller-Settings-Session Setup-Line Planning can be made visible in the 3D grid display.
Line heights are the same as those heights entered for each line when creating the Line Database file in the Processing Manager or Line Database Manager.
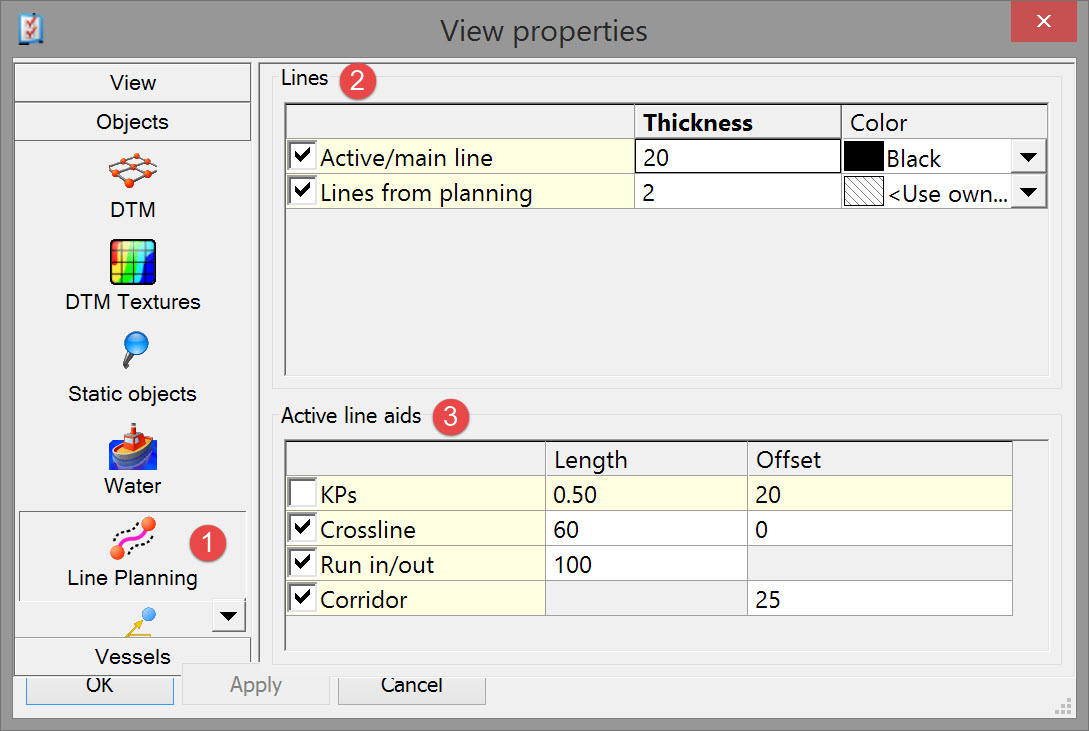
Parameters are self explanatory.If not....
Press < Apply > to see the effects of changed settings without having to leave this menu.
Return to top of page.
Range Markers
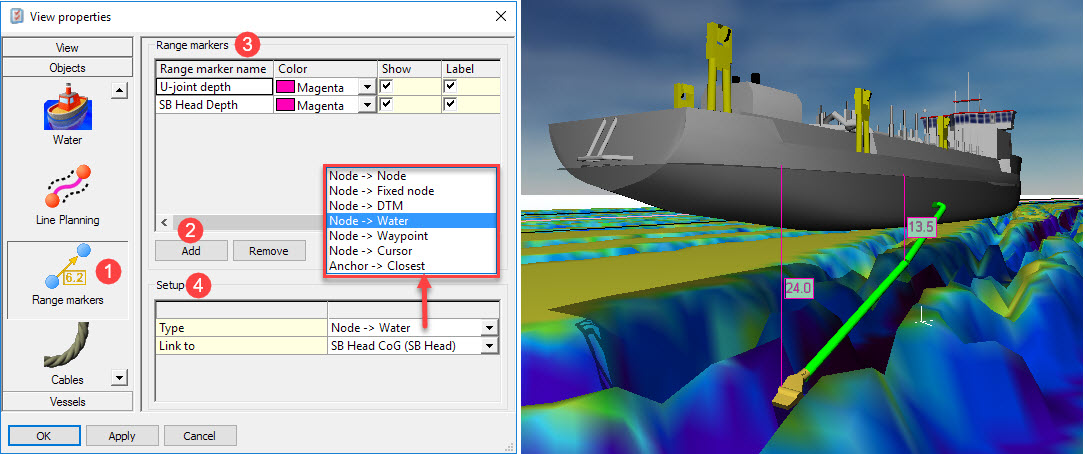
A range marker is a line between two selected points drawn with or without a label which indicates the range and bearing of the line, plus the height difference between the two points.
Label content depends on the Setup selection made, as depicted in the following image.
|
Setup |
Description |
|---|---|

|
Range marker between two nodes on different objects. This type could be used to show the distance between two vessels.
|

|
Range marker between a node on a vessel and a fixed node as defined in the Database Setup.
|

|
Vertical marker between a node on a vessel and the sounding grid DTM below.
|

|
Vertical marker between a node on a vessel and the water plane as defined under option 'Water' above.
|
|
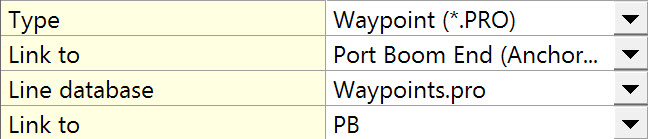
Range marker between a node on a vessel and a predefined point in a Line Database File.
|

|
Range marker between a node on a vessel and the location at which the left mouse button is clicked in the display. A new label is generated at each mouse click.
|
|
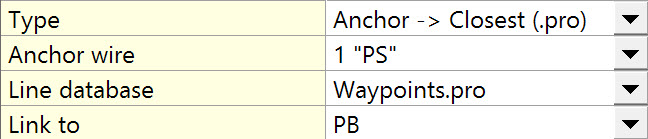
Range marker between an anchor wire and a selected waypoint. This option enables the monitoring of the separation between an anchor wire and any potentially hazardous object.
|
Press < Apply > to see the effects of changed settings without having to leave this menu.
Return to top of page.
Cables
A Cable is a physical line between two selected points. When seen in profile, the cable shows the natural sagging curve of a free hanging cable.
Unlike a range marker a cable does not show an information label.
Also, a Range Marker does not show in a Profile Display.
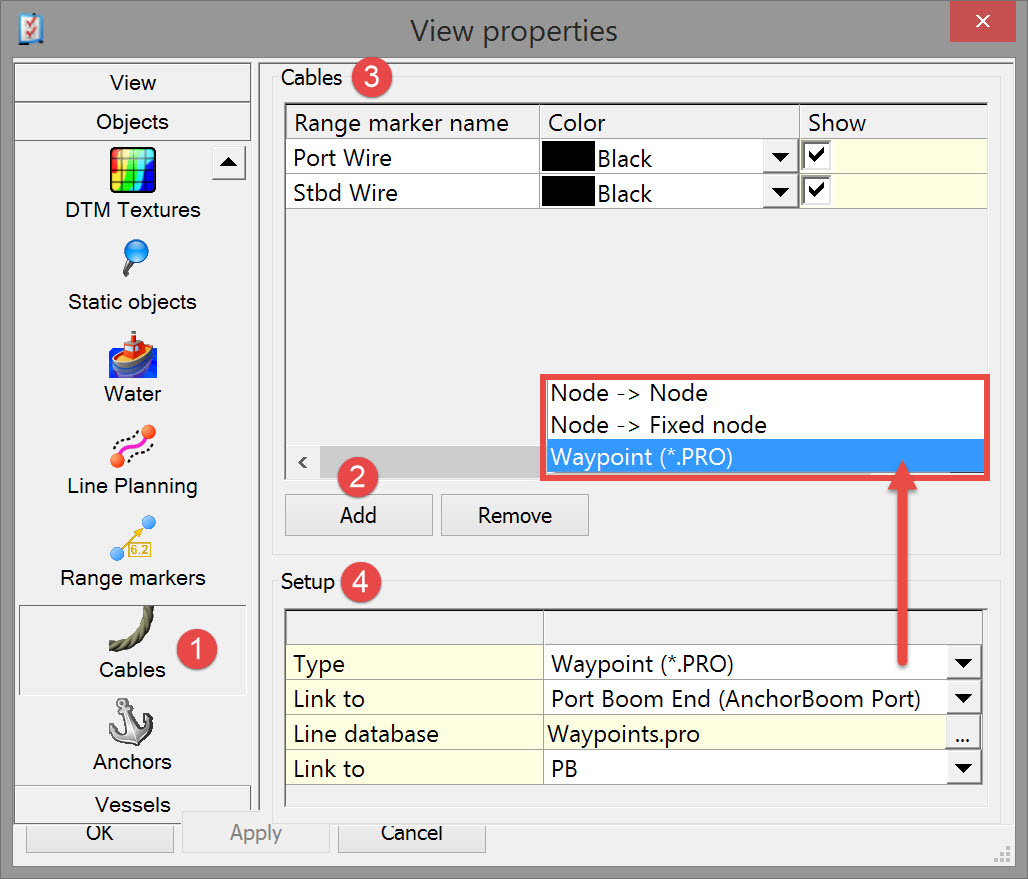
|
Setup |
Description |
|---|---|

|
Cable between two nodes on different objects. |

|
Cable between a node on a vessel and a fixed node as defined in the Database Setup. |

|
Cable between a node on a vessel and a predefined point in a Line Database file. |
Press < Apply > to see the effects of changed settings without having to leave this menu.
Return to top of page.
Anchors
Shows anchors as defined in the Controller's Session Setup - Anchor Setup. Anchors cannot be adjusted in this menu.
Requires definition of a Tug Manager System in the Database Setup program.
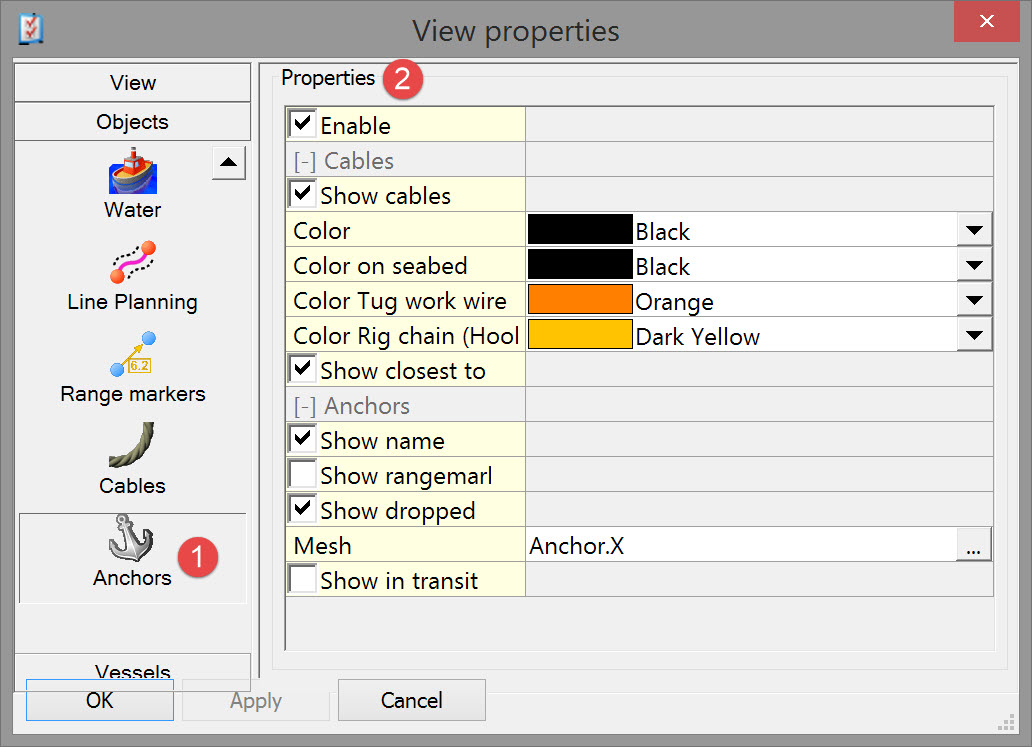
A number of parameters reference the "Hook-Up Operations for Anchor Handling” added to QINSy version 8.10.2015.06.29.1 (see Hook-Up Operations for Anchor Handling) which are not of interest in dredging operations.
Parameters relevant to dredging:
Enable: Tick to show the available anchors in the display.
Show Cables: Tick to show the cables connected to the anchors. Options below only appear when 'Show cables' has been activated.
Color: Select a color for the cables.
|
Properties |
|
|---|---|
|
Enable |
Tick to show the available anchors in the display. |
|
Cables |
Double click on the [+] sign to open the tree structure menu. |
|
Show cables |
Tick to show the cables connected to the anchors.
|
|
Color |
Select a color for the cables. |
|
Anchors |
|
|
Show name |
Tick to show the available anchor names in the display. |
|
Show range marker |
Tick to activate a range marker from vessel to anchor. |
|
Show dropped |
Tick to show the dropped anchors in the display. |
|
Show in transit |
Tick to show the anchors which are still in transit. |
Press < Apply > to see the effects of changed settings without having to leave this menu.
Return to top of page.
View
Cameras
Cameras provide preset views of the dredging operation. Multiple cameras may be defined and the view easily switched between them.
A camera position determines from which direction and angle the data in the 3D grid display is viewed.
Cameras may be fixed or they can track an object.

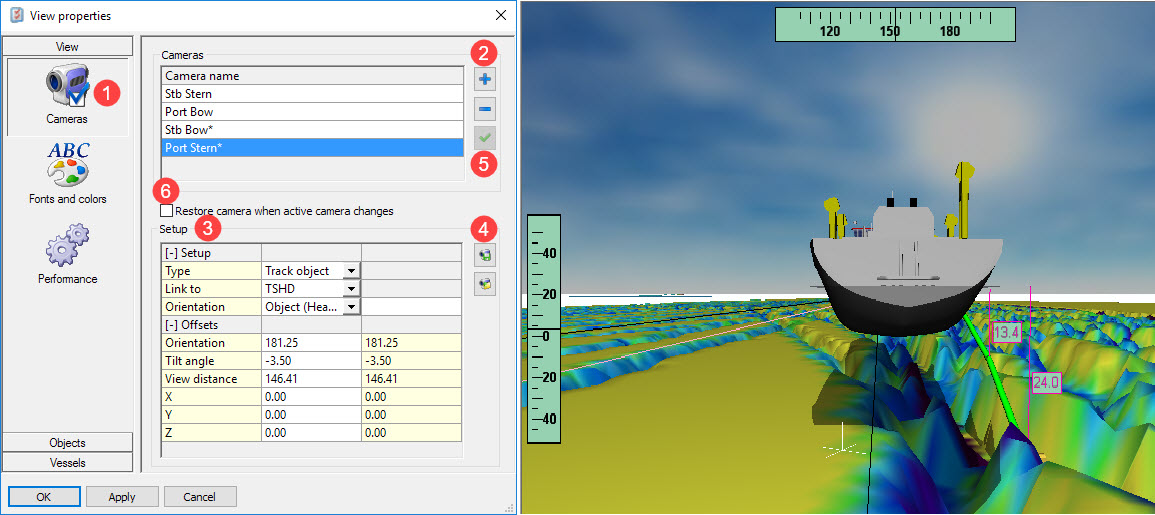
Its parameter values reflect the last position it was in before entering this dialog.
Give the camera a name which makes it obvious what view is being captured, e.g. in the example Starboard Lateral.
|
Parameter |
Description |
|---|---|
|
Type = Track
|
The camera maintains a fixed position relative to the object being tracked.
|
|
Link to Track
|
Select the vessel (object) which the camera should track, e.g. dredgehead.
|
|
Offsets |
Press the [+] sign to open the tree structure menu.
|
|
Orientation |
Option is only available for a tracking camera. Select the direction in which the camera is looking.
|
|
Tilt Angle |
The angle entered is relative to the horizontal. A negative angle means the camera is looking down. |
|
View Distance |
In case of a tracking camera: the distance between the camera and the object. In case of a fixed camera: the distance between the camera and the current pivot point of the scene. |
|
X/Y/Z Offsets |
For a tracking camera these are the offsets of the camera from the object's reference node. In the example, the CSD pontoon reference point is at the aft end. Therefore to view the cutter a Y offset of 60m. is entered to shift the camera position forward. For a fixed camera linked to a fixed node, the offsets entered determine where the camera is relative to the fixed node. For a fixed camera <Do not inherit> offsets act like grid coordinates. |

This stores the settings which can be restored at any point by clicking on 
Alternatively you can restore saved home position by clicking on the Home 
This means that if you use the mouse to rotate, pan or zoom in a predefined camera view, you can always revert back to the original settings and recover the view.




-
-
You can save the camera offset settings with the
-
You can restore the camera offset settings by using the restore
-
you can restore the camera offset settings by clicking on the home
-
With the setting ON:
-
-
You can do the above
-
When you toggle from one camera to another and then back to the first camera offset, settings will be restored to saved settings.
-
This means that you do not have to enter the properties page to restore original settings. It can be done by switching to another camera and then back to the first one.
It is also possible to use the Restore, Save, Rotate and Pan functionality from the View menu to determine the location of the camera.
Press < Apply > to see the effects of changed settings without having to leave this menu.
Return to top of page.
Fonts and Colors
Performance
Click on
|
Model settings |
Press the [+] sign to open the tree structure menu. |
|---|---|
|
Display quality |
Performance - Low quality of the scene but high performance.
|
|
Show reverse side of DTM |
By default this option is switched off because of the performance of the display.
|
Press < Apply > to see the effects of changed settings without having to leave this menu.
Return to: top of page
Return to: TSHD - Online Displays