
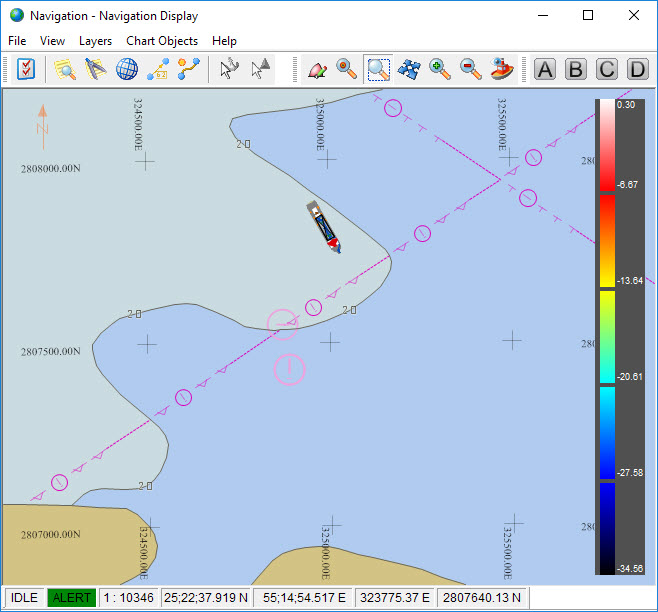
Navigation Display
Used for navigation and positioning during dredging operations, this display makes use of a layer structure. Each layer can be enabled/disabled and/or the layer stacking re-ordered.
Take the following steps to configure the Navigation Display; only a few important settings are discussed here. For more detailed information refer to the Online Help.


Refer to TSHD Online Displays for details about creating a display set and adding new displays. The following assumes a Navigation Display has already been created.
The initial Navigation Display should resemble this (unless you do not have electronic charts or have not prepared them for use:
Layers
The main pane features multiple layers showing different types of data.
Layer stacking order is user-configurable.
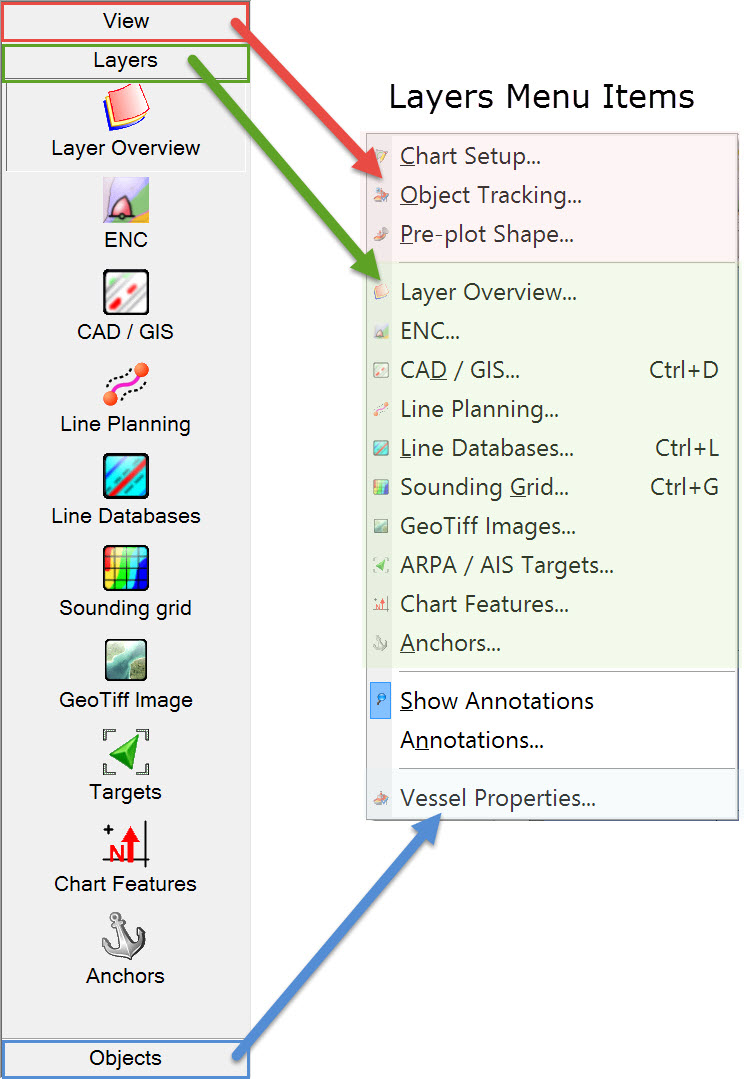
Right-clicking in any of the menus on the left offers the option to change the size of the icons to large or small.
Return to top of page.
Return to TSHD - Online Displays
Object Tracking
There are several options available in tracking one or more objects.

![]()
The following dialog opens:
![]()

This keeps the selected objects in view automatically, keeping the focus on the selected object(s) at all times.
Use the ![]()

The Tolerance and Position sliders control the two red boxes which dictate how and when the display is updated.

the object has a fixed location on the screen and the chart moves under the vessel.

If multiple objects are enabled, display scale automatically changes to keep all objects in view.
Return to top of page.
Return to TSHD - Online Displays
Sounding Grid
When a sounding grid is selected in Session Setup for storage of one or more data systems it is automatically shown in the Navigation Display.
Take the following steps in order to modify sounding grid settings.


The following dialog opens:
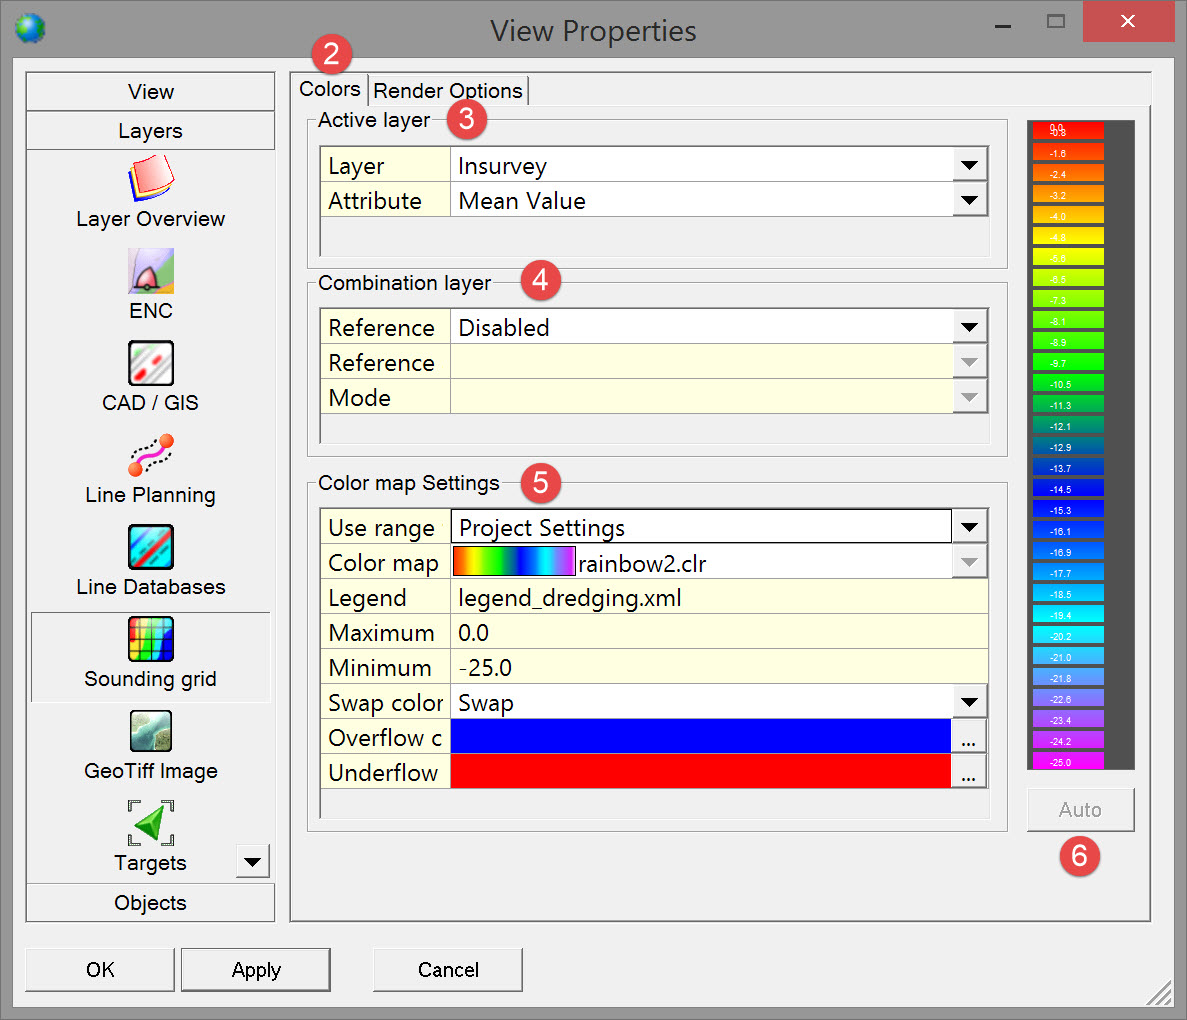
Different layers may contain bathymetry (Insurvey, Outsurvey, design, dredge head height), imagery, magnetometer or other data types such as Current Production, Mixture Density and Mixture Velocity.
The attribute list contains all the attributes assigned to the layer when the sounding grid was created.
Using a reference layer means that it has been pre-populated with data. Pick one of the existing layers from the drop down list to make a comparison.
For example a reference layer may contain a pre-dredge DTM to be compared with a post dredge DTM, or a channel design surface to compare with a dredged surface.
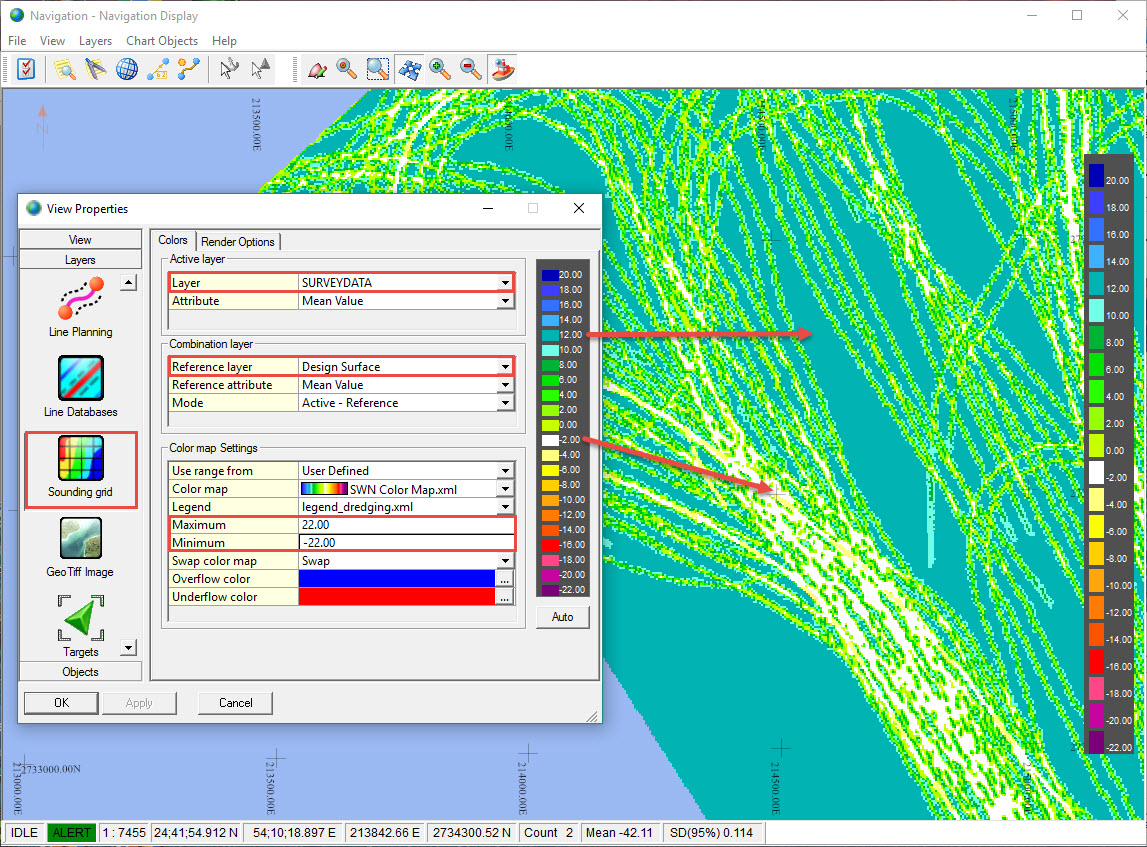
The functionality is also useful in assessing sediment migration. Surface differences are computed and color mapped in real-time as the second survey data is acquired.
Disable when not in use otherwise you may see unexpected results as you populate the active layer.
Change from “Project Settings” to “User Defined” in order to modify the color map and the minimum and maximum values for the selected attribute, e.g. Mean Depth.
Select a color map from preexisting definitions. Note that a custom designed color map can be created if needed using the Color Scale Editor program.


This can be a useful option to indicate when designed depth is achieved, or to show pockets of under or over dredging.
Return to top of page.
Return to TSHD - Online Displays
Vessel Properties
Various properties can be set for each object.

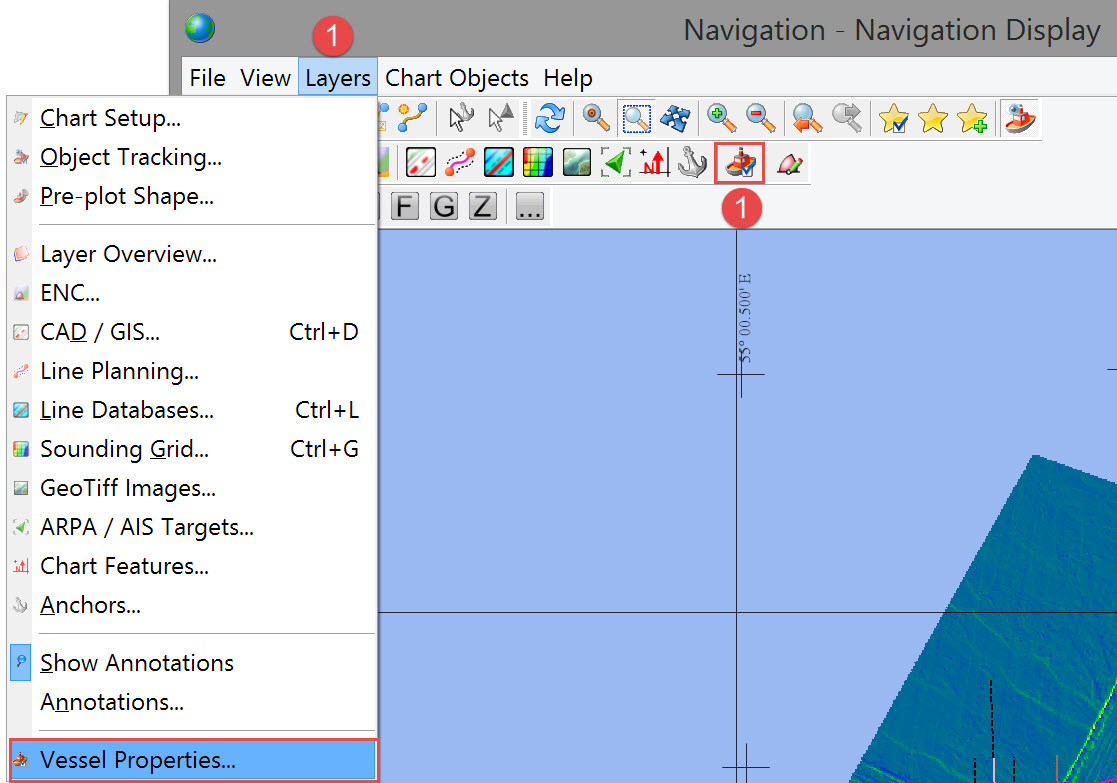
The following dialog opens:
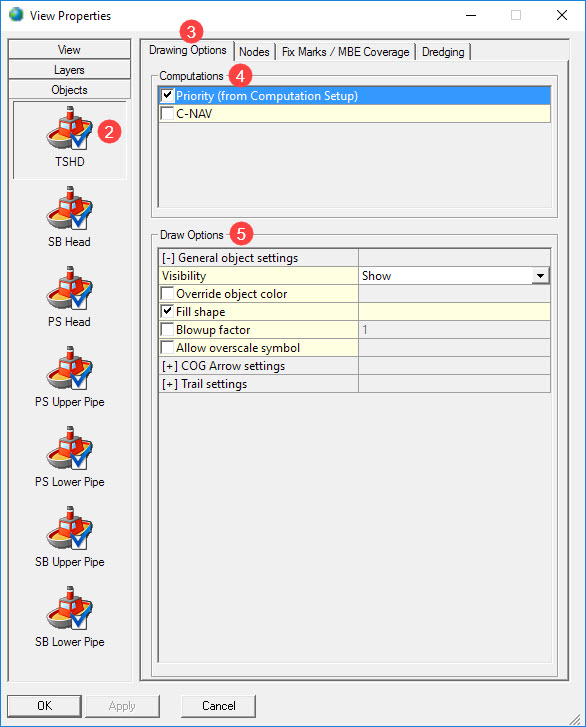
Drawing Options Tab
Use either the priority computation, which is set in the 'Computation Setup', or another computation.
Coordinates of the object shown in the Navigation display are taken from the selected computation.
When multiple objects need tracking the map scale is automatically adjusted until all objects are visible.
The Draw Options dialog has a tree-view kind of look. Double-click on the plus signs to unfold the options and on the minus signs to fold them again.
Return to top of page.
Return to TSHD - Online Displays
Nodes Tab
Use this menu to set which 'snail' trails and labels, for which nodes, are made visible in the Navigation Display.
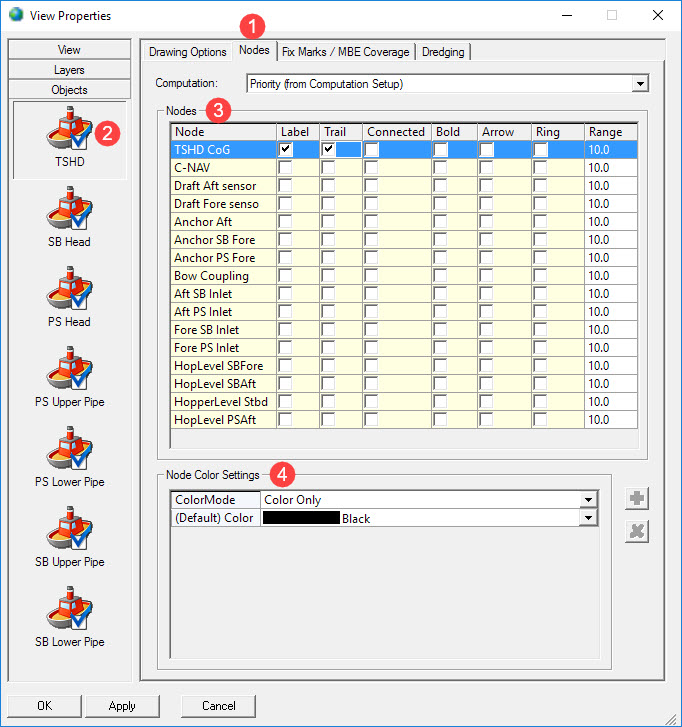
A list of all available nodes for the selected object is shown on the right.
Click to expand...
|
Node Color Settings |
|
|---|---|
|
Color Mode |
Choose one of the next settings to be shown in the screen:
|
|
(Default) Color |
A color can be set for each node separately. |
|
Color scale |
Only available when Color Mode is set to GPS Quality Indicator.
|
|
|
Only available when Color Mode was set to Position Status.
|
|
|
Remove the highlighted status. |


Return to top of page.
Return to TSHD - Online Displays
Fix Marks/MBE Coverage Tab
If you are using 'fixing' use this tab to show fix marks.
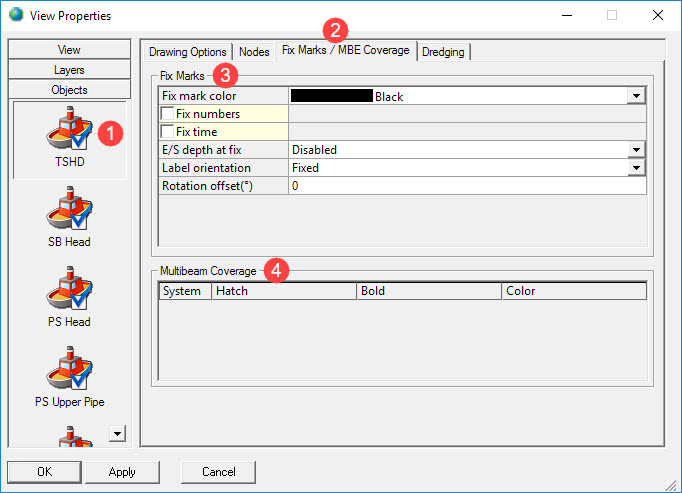
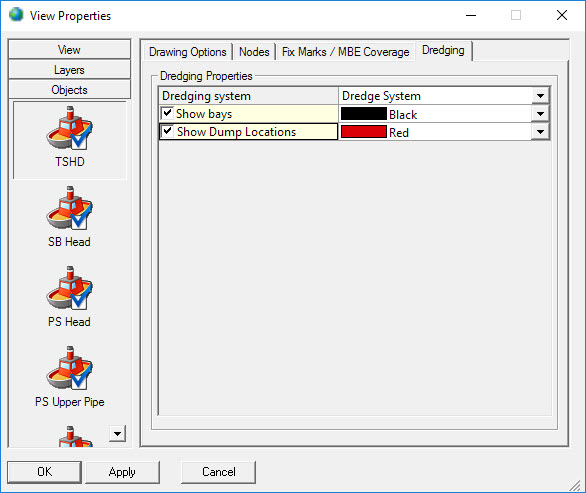
Dredging Tab
Use this tab to show hopper bays and/or dump locations.
Return to top of page.
Return to TSHD - Online Displays
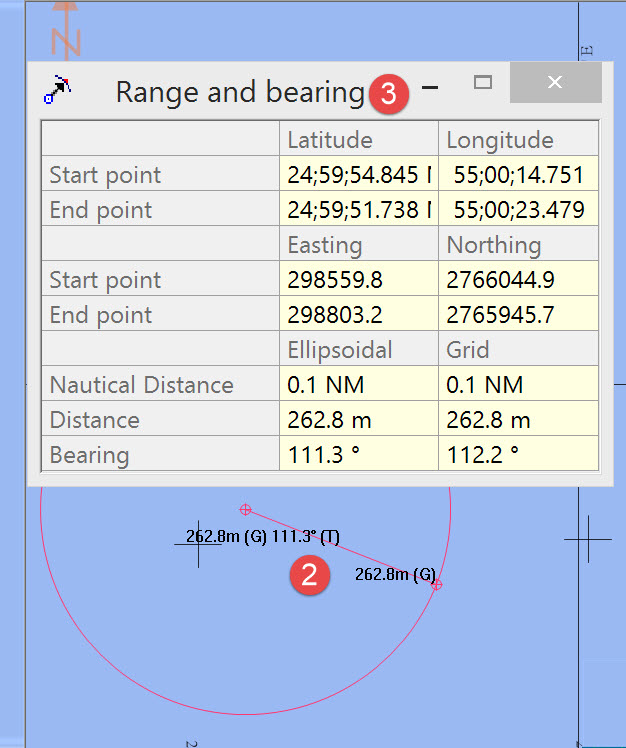
Range and Bearing
The following steps describe how a range and bearing measurement is done.

The following dialog is opened. The mouse pointer changes for this type of action.
Return to top of page.
Return to TSHD - Online Displays
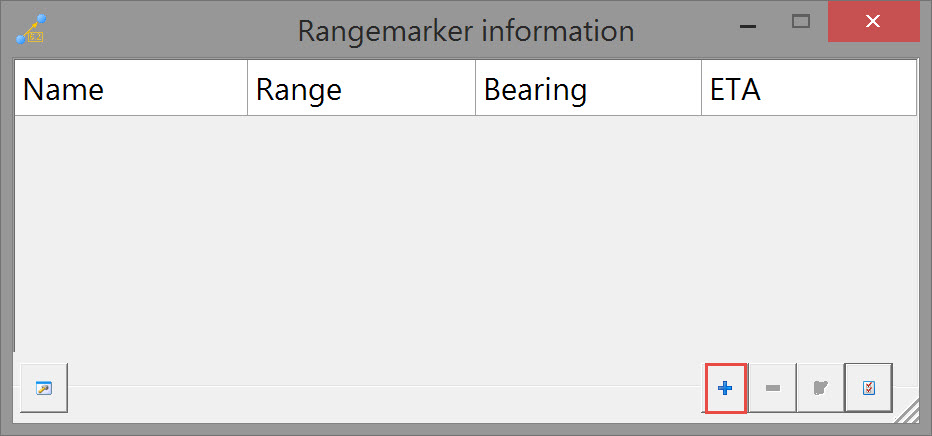
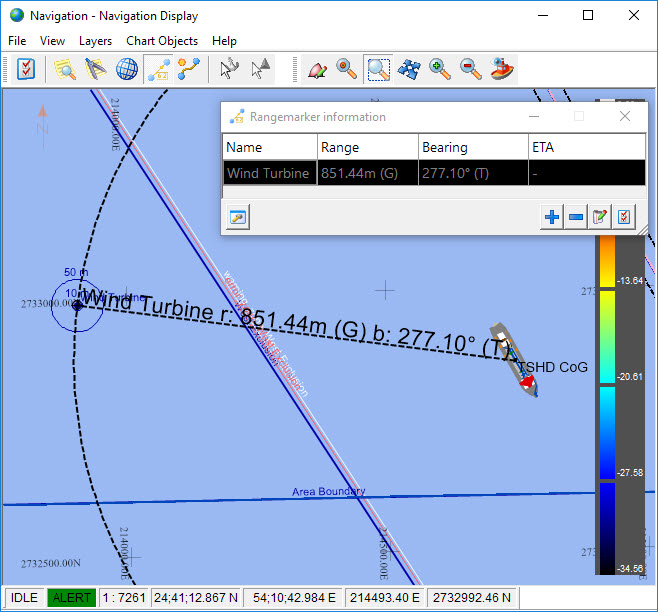
Range Markers
Use a range marker to see a continuous range and bearing measurement between two points. For example from a node on a vessel to another certain position. Multiple range markers can be placed.
All markers can be previewed in the Navigation Display by pressing Apply. Edits can then be made before closing the dialog.
The following steps describe how a range marker is added.

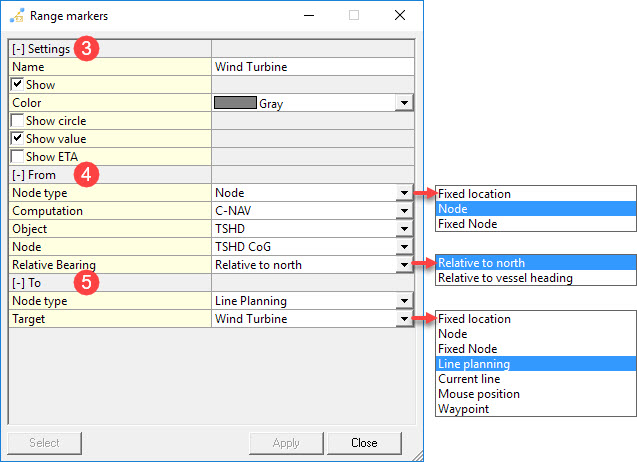
The circle is centered on the From point with radius equal to the distance between the From and To points.
Click to expand...
|
From |
|
|---|---|
|
Node type |
Node - Can be on any Object as defined in the template database created using the Database Setup program.
|
|
Computation |
Use the computation from one of the systems as set up in the Controller - Settings - Computation Setup.
|
|
Object |
Select an Object as defined in the template database.
|
|
Node |
Select a Node as defined in the template database.
|
|
Relative Bearing |
Select 'Relative to north' or 'Relative to vessel heading'.
|
|
Coordinate system |
Select Grid - Survey Projection or Geographical - Survey Datum or Geographical - WGS84. Only visible when Node type is set to Fixed location. Otherwise range and bearing are measured on the grid. |
|
Easting,Northing or Latitiude,Longitude |
Enter coordinates manually, or use the mouse cursor in the Navigation Display after pressing the |
|
Waypoint |
Select a fixed node which was defined in the template database.
|

Click to expand...
|
To |
|
|---|---|
|
Node type |
Fixed location - Enter manually or pick in the Navigation Display after pressing the <Select> button.
|
|
Coordinate system |
Select Grid - Survey Projection / Geographical - Survey Datum / Geographical - WGS84.
|
|
Easting,Northing or Latitiude,Longitude |
Enter coordinates manually, or use the mouse cursor in the Navigation Display after pressing the <Select> button.
|
|
Computation |
Use the computation from one of the systems as set up in the Controller - Settings - Computation Setup.
|
|
Object |
Select an Object as defined in the Database Setup.
|
|
Node |
Select a Node as defined in the Database Setup.
|
|
Waypoint |
Select a fixed node which was entered as a Waypoint.
|
|
Target |
The Target must have been defined in Waypoint planning or in the Line Data Manager beforehand.
|
|
Mode |
Select to which point along the current line: Start of line / End of line / Kp and Offset.
|
|
Line database |
Choose which database to select a waypoint from.
|
|
Waypoint |
Select a waypoint from the Line database created earlier.
|
|
|
Use this button in combination with the Easting,Northing or Latitiude,Longitude coordinates in the To and From panels and with the mouse cursor.
|

|
All items which can be changed can be previewed in the Navigation Display by pressing <Apply>.
|
|
|
Close the Range markers dialog. If changes have not been confirmed with |


Return to top of page.
Return to TSHD - Online Displays
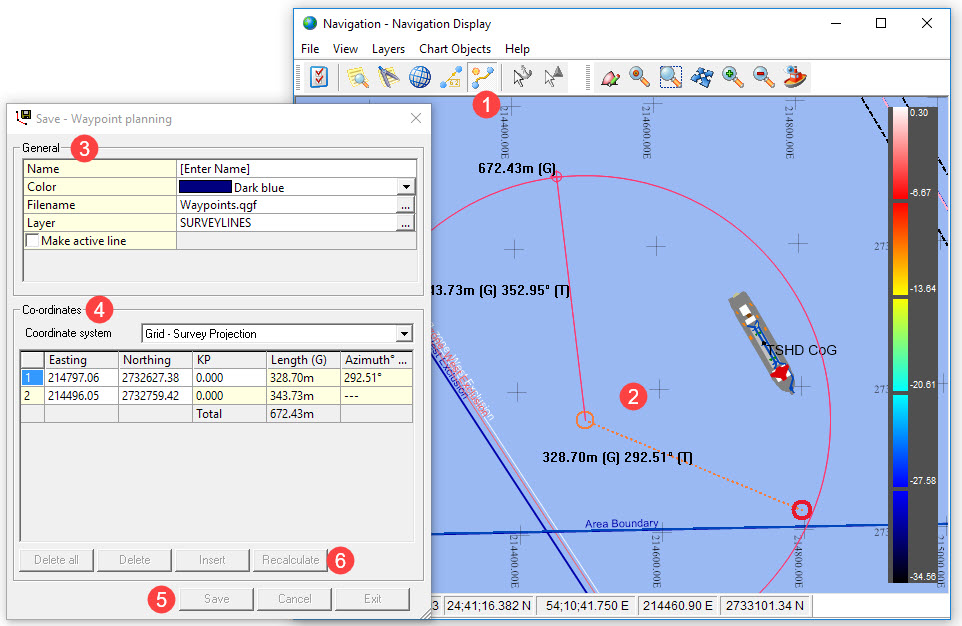
Waypoint Planning
Creating waypoints, lines and routes is simple. New ones are saved to a new line database or appended to an existing line database.
Take the following steps in order to create new waypoints, lines and routes.
....or click on the 
Note that the cursor takes on a new form 
For a single waypoint, click with the mouse on the main display window and then right click to end the selection process.
For a line, click with the mouse at the start of line and again at the end of line. Right click to complete the selection process.
For a route click with the mouse at each vertex. When done right click to end the selection process.
Position of waypoints, start and end of line and vertices, as well as distance and bearing is displayed in the Waypoint Planning dialog, and on the main display window.
Note that you can type in a new QGF file name when browsing under Filename.
Hovering the mouse over a waypoint; the cursor again changes form to allow each waypoint to be shifted in position by mouse
....or by typing in a new set of coordinates in the dialog box. Select either E/N or Lat/Long to do this.
A waypoint which is made Active cannot be edited. First activate another line using the <Page Up> and <Page Down> buttons or the shortcut menu in the Navigation Display.
The shortcut menu can be activated by using the right mouse button on the waypoint or line.
|
Delete all waypoints and legs in this file and start anew with <Insert> and Add Waypoints from the shortcut menu.
|
|
|
Delete the highlighted point. In the box it is highlighted in blue, in the Navigation Screen it is the red highlighted circle.
|
|
|
Insert a point between the selected point and the previous one. When the first point of a line is highlighted, the inserted point will be added before it.
|
|
|
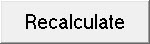
When the first point on the line is given a KP value, the KPs for the rest of the line will be recalculated when this button is pressed. |

|
Save the setup of waypoints and legs in a *.PRO file. Waypoints and connecting lines (legs) are shown in the Navigation Display. |
|
|
Ignore all changes and return to the Navigation Screen. |
|
|
Ignore all changes and return to the Navigation Screen.
|


Waypoints can not be drawn on top of each other.
Waypoints can not be defined on top of a leg line. (Use <Insert> if an extra point is needed in between existing waypoints. See for more possibilities the <Insert> option above.)
Right mouse menu
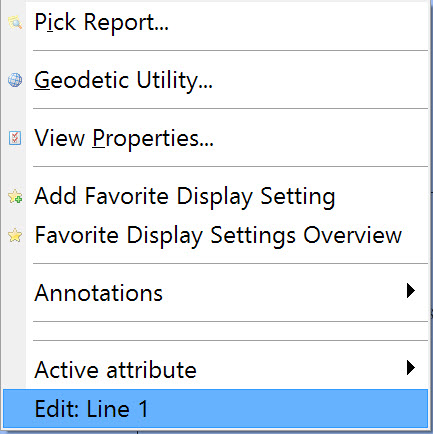
To edit existing waypoints, right-click on a point or leg line (a connecting line between two points) and select 'Edit' from the shortcut menu.
The following message is displayed:
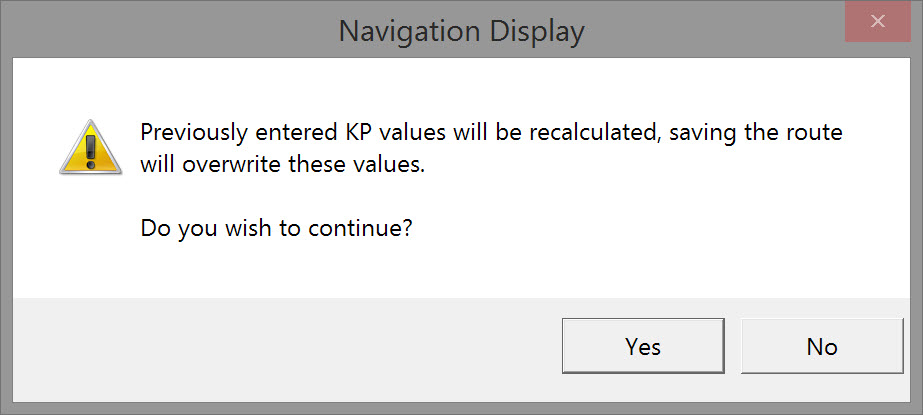
Clicking Yes opens the Save- Wave point planning dialog.
Existing points can be dragged to other positions with the mouse pointer or by typing in new coordinates.
Return to top of page.
Return to TSHD - Online Displays.
.
Anchors
Only available when a Tug Manager System has been defined in the Database Setup program and
....anchors have been added to the Controller - Settings - Session Setup.

or click on View Properties 

View Properties can also be opened by right clicking.
Three tabs provide options to customize visualization of the anchors being run in a dredging operation:
-
-
Anchor Settings
-
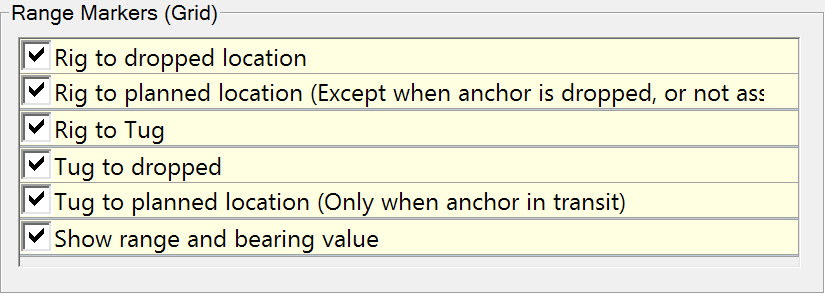
Range Marker Settings
-
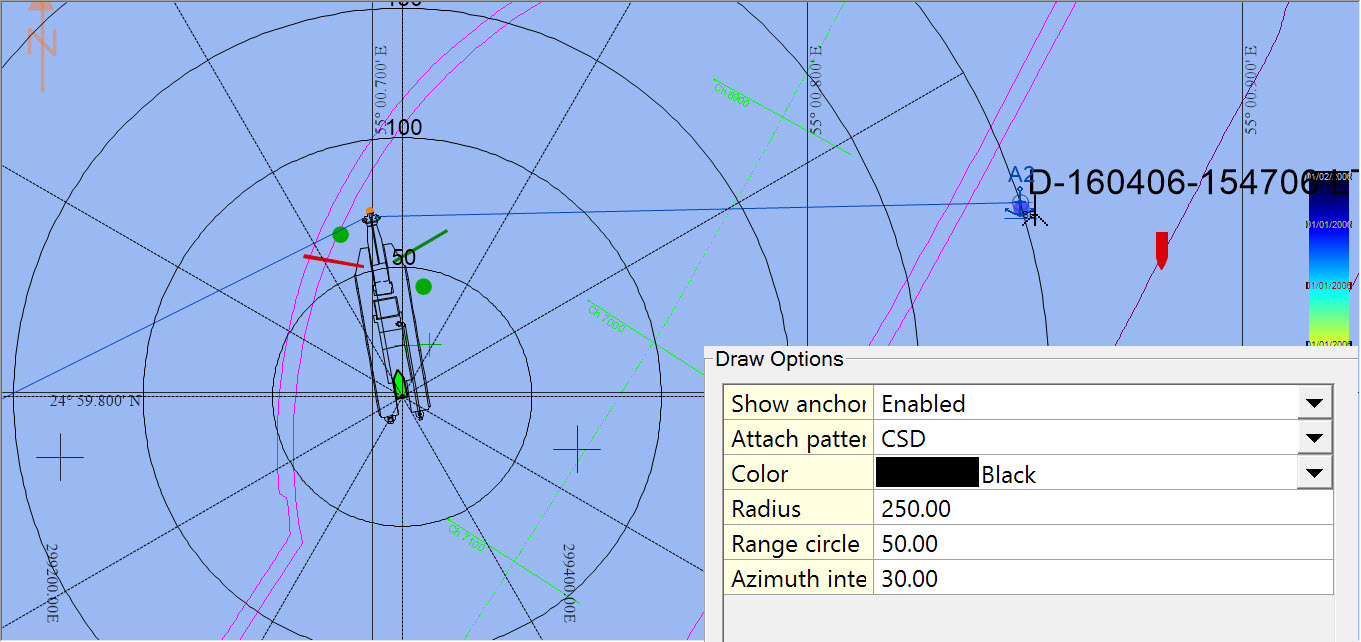
Anchor Pattern
-
Anchor information is retrieved from either the Anchor Settings in the Controller's Session Setup or is received from an anchor input driver.
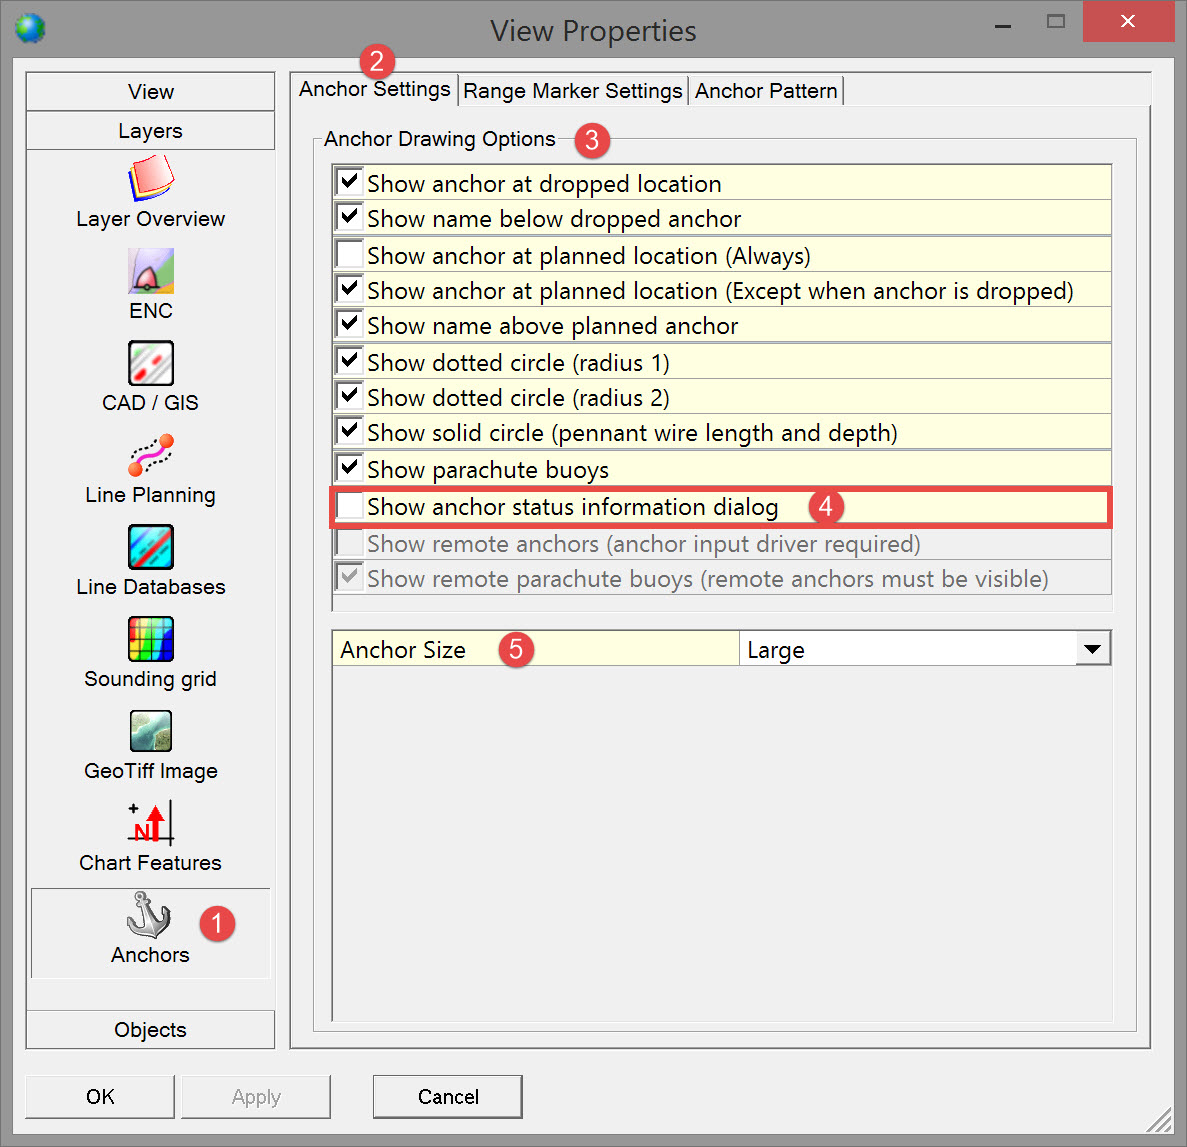
Anchor Settings Tab
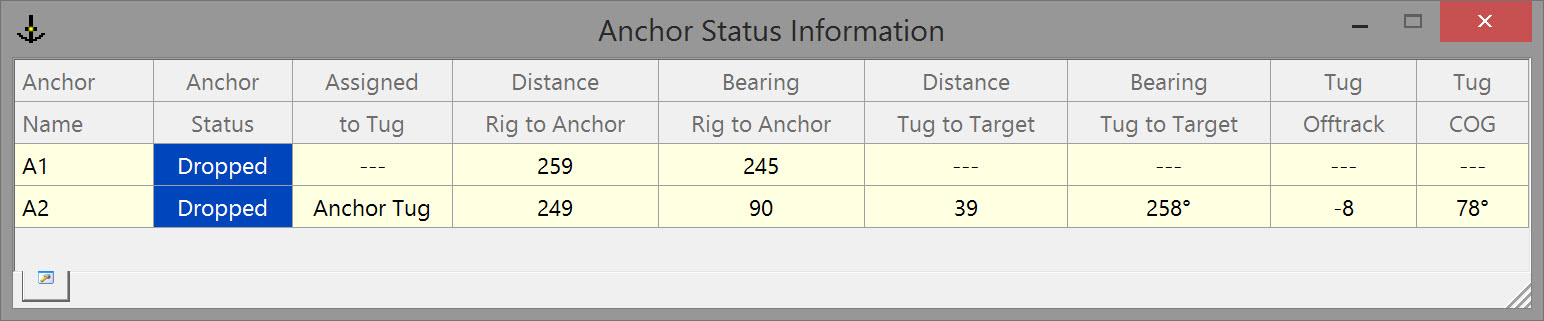
Numbers in this dialog update with movement of dredger and/or tug.
Range Marker Tab
Options here control which 'rubber band' lines and which annotations are shown.
Anchor Pattern Tab
A variant of a compass rose is display, centered on the reference point of a selected object.
Anchor Planning
This option is only available when anchors have been defined in the Controller - Settings - Session Setup, Vessel and Anchor Setup.

The mouse pointer changes form. Use it to drag an anchor to another location. When at the correct location right mouse-click to select an action to perform on the anchor.
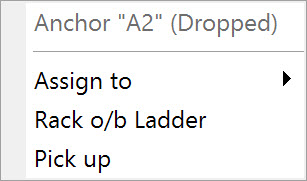
Additionally the right mouse button can be used to open a shortcut menu. Here a limited number of actions can be selected: Assign the anchor to a different vessel or change the status from Racked to Pick up.
Return to: top of page
Return to: TSHD - Online Displays