
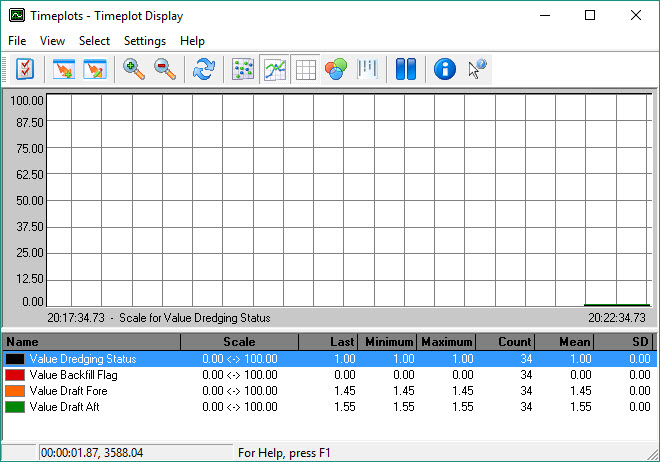
The Timeplot Display shows raw observation or computed data over a user specified period of time. Observations are displayed scrolling from right to left in a time series pane, with a numerical pane below showing Last, Maximum, Minimum, Count, Mean and SD values (the statistics of the plot view).
Multiple observations of different type can be displayed in one screen, each with its own associated vertical scale and midpoint value, i.e. various scales exist simultaneously. Click on an observation in the lower pane to see what its vertical scale and mid value are set at.
A fix number can also be displayed.
Take the following steps to create and configure a Timeplot Display:


This opens the Display Manager.


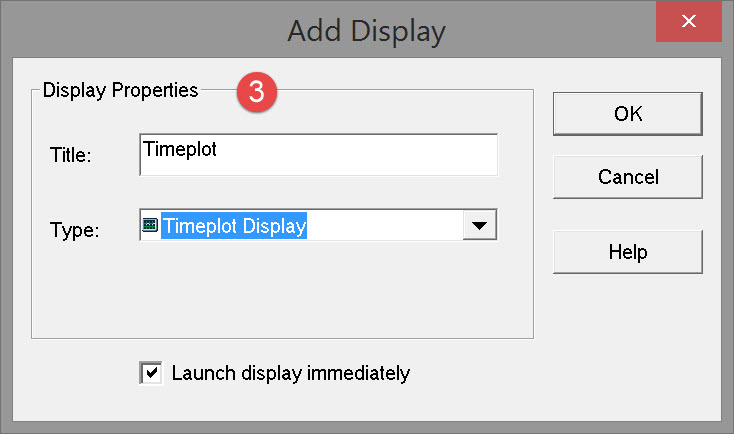

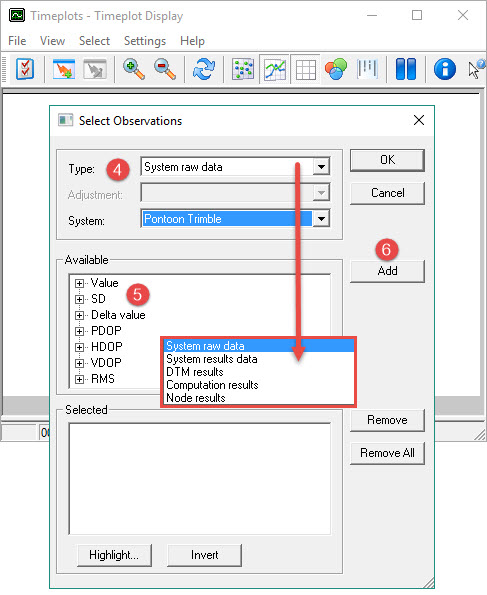
Pressing OK opens the Select Observations dialog on top of an empty Timeplot dialog:

-
-
System Raw Data: Raw observation values from any one or more of the systems defined in the template database.
-
System Results Data: Computed system observations.
-
DTM Result Data: Computed echosounder results (primarily multibeam).
-
Computation Results Data: Results from the position calculation.
-
Node Result: Computed node positions.
-
For dredging the observations likely of interest are:
-
-
System Raw Data: Dredging Sensors. For example Volume, Weight, Hopper Level, Status and Flag.
-
System Raw Data: Draft Sensors, motion sensors, pseudo-USBL, gyro and tide.
-
System Results Data: computed tide result.
-


|
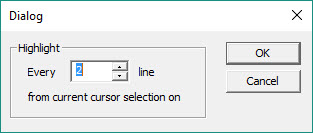
Highlight every nth observation in the list. When |

|
The previously highlighted items are deselected. |

Repeat these steps to add observations. Multiple observations from different types may be added to the selection list.
Select 
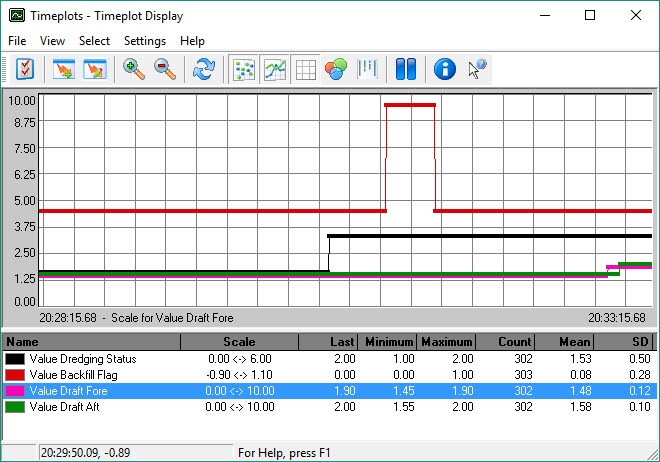
The values start to scroll from right to left. Initially vertical scales take on default values which in most cases need modification. Default colors may also need changing.


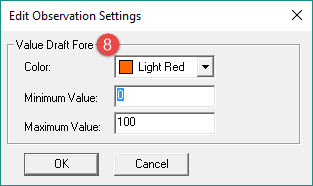
Select a Color and check the numerical values for Minimum, and Maximum. The Mean value in the lower panel can be used as a guide to entering Minimum and Maximum values.
The following picture uses a simulated situation but does provide an idea of what to expect.
|
Button |
Description |
|---|---|

|
Opens the Select Observations dialog where changes are made to add and remove Observations. |

|
Opens the Observation Settings dialog. Click on an Observation and press Edit. |

|
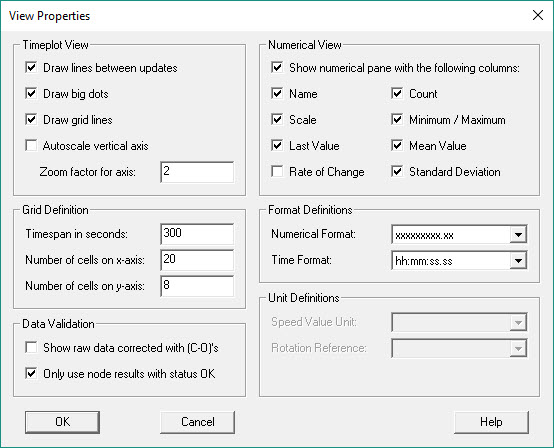
Opens the View Properties dialog. All parameters are fairly self explanatory. If not, expand the link below. |
Click here for a description of View Properties parameters...
|
Timeplot View |
|
|---|---|
|
|
Connect points with a line, showing the picture as a graph. |
|
|
Show points using more pixels. |
|
|
Draw a grid over the graphical view. |
|
|
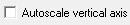
Adjust vertical scale to fit observation automatically. |
|
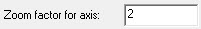
|
Enter a value. When zooming in, the vertical axis is shown N-times as large of small where N is the entered value. |


|
Grid Definition |
|
|---|---|
|
|
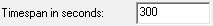
Enter a value for the horizontal axis. |
|
|
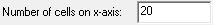
Number of grid cells overlaying the graph in horizontal direction. |
|
|
Number of grid cells overlaying the graph in vertical direction. |
|
Data Corrections |
|
|---|---|
|
|
Apply corrections from the template database to raw data. |

|
Numerical View |
|
|---|---|
|
Show numerical pane with the following columns |
Activate to show the numerical pane. |
|
Name |
Name of the selected observation. |
|
Scale |
Show vertical axis scale. |
|
Last Value |
Show last decoded or computed value. |
|
Count |
Show number of values in the graph. |
|
Minimum Value |
Show minimum value in the graph. |
|
Maximum Value |
Show maximum value in the graph. |
|
Mean Value |
Show mean value in the graph. |
|
Standard Deviation |
Show calculated standard deviation in the graph. |
|
Format Definitions |
|
|---|---|
|
Numerical Format |
Pull down menu with various resolutions for numerical format. |
|
Time Format |
Pull down menu with various resolutions for time format. |
|
Unit Definitions |
|
|---|---|
|
Rotation Reference |
Pull down menu with various rotation units. These units can be adjusted depending on the Selected Observations. |
|
Speed Value Unit |
Pull down menu with various speed units. These units can be adjusted depending on the Selected Observations. |
Return to: top of page.
Return to: BHD - Online Displays.