
PM View Windows
The Processing Manager provides several different windows in which to view data.




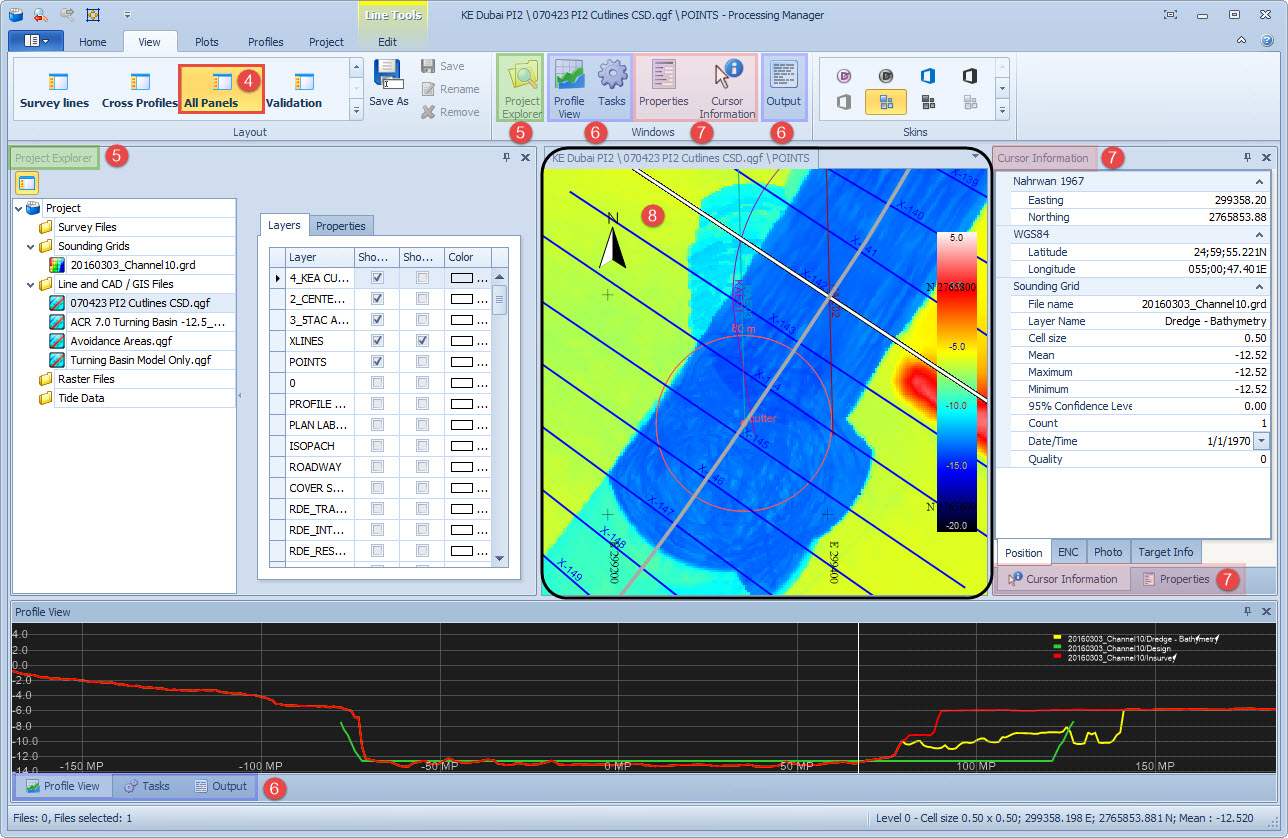


Notice that there are three options here: Profile View (showing), Tasks and Output.

The panel is shared between:
-
Cursor Information with these tabs

-
Properties.

Return to: top of page.
2D Plan View
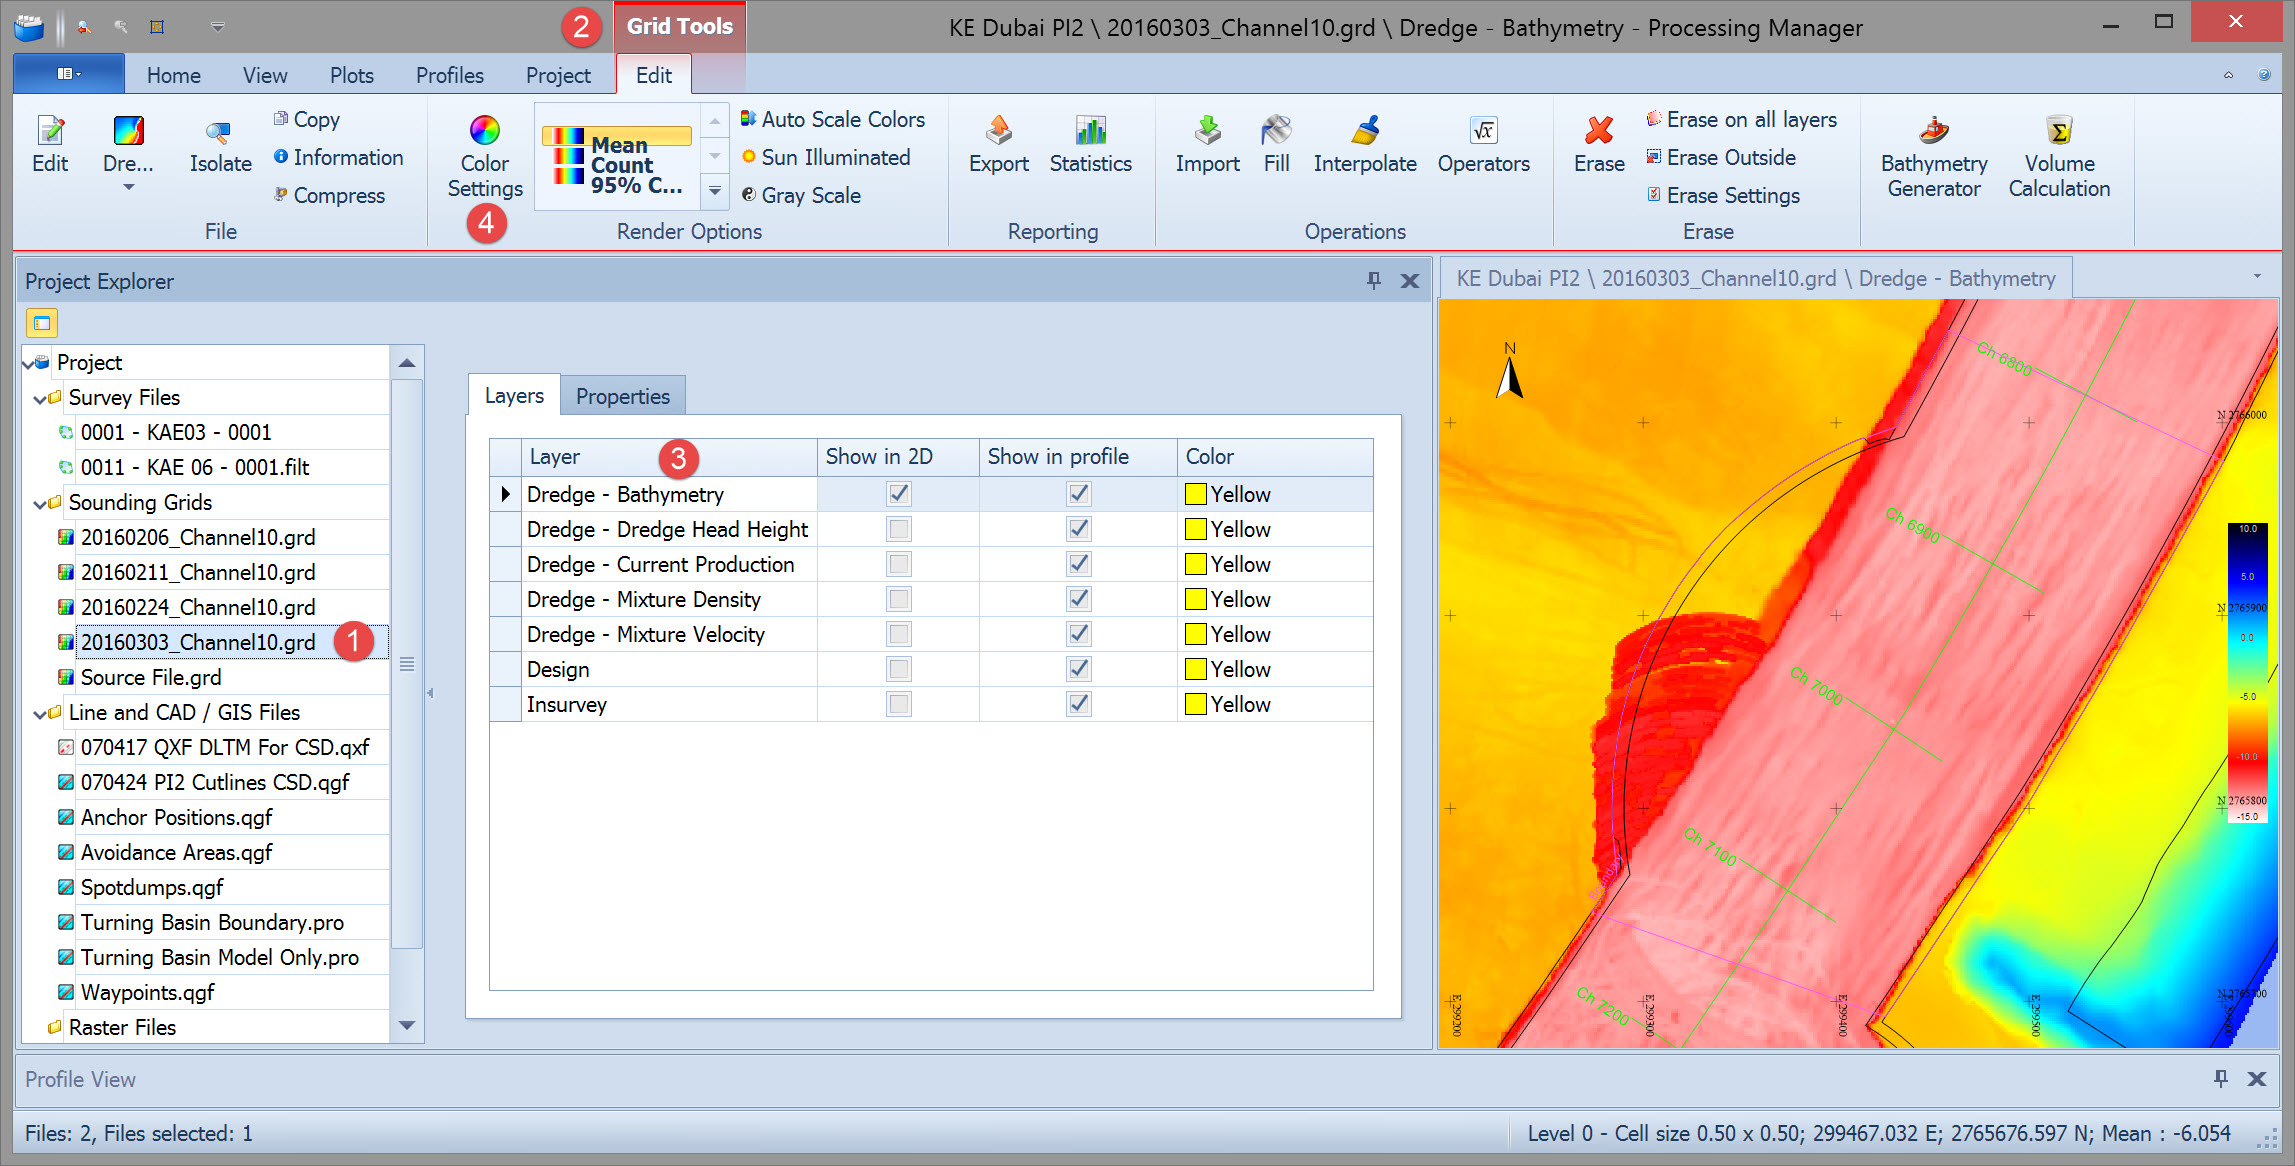

The 2D Plan View (also known as the Project Window or Project View) shows all project and background data for the project.
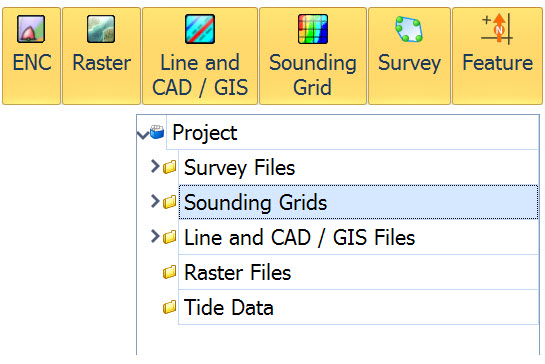
Layers include: ENC's, sounding grids, raster images, CAD / GIS data and survey data.
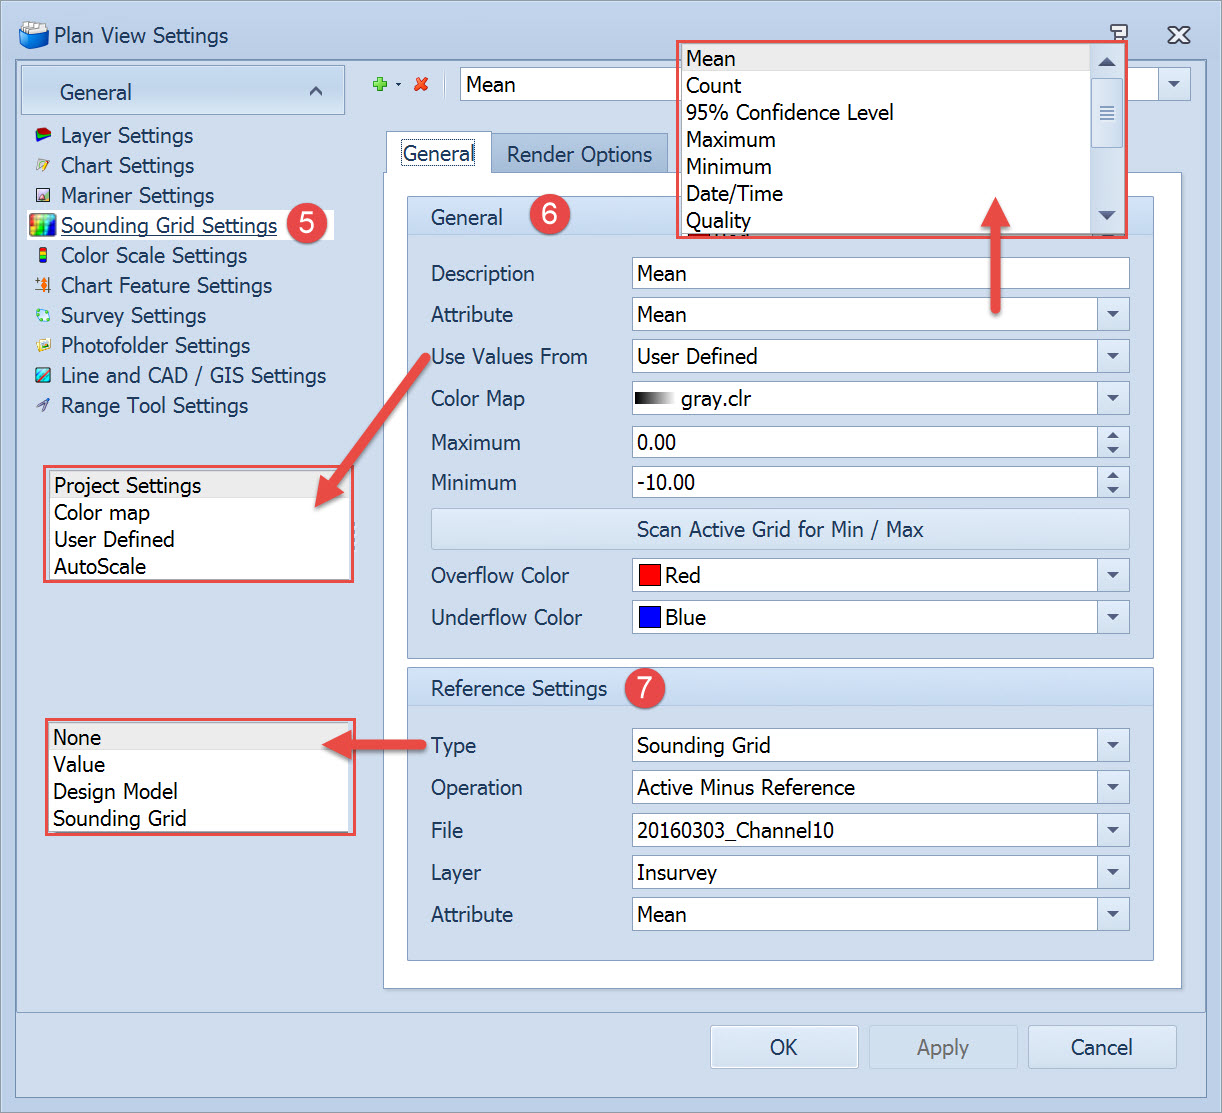
The order and presentation settings of the layers can be modified in the Plan View Settings dialog.
To quickly hide or show a complete category (for example the ENC layers) click the corresponding buttons in the Home ribbon tab.
Hiding or showing individual files or file layers is done in the Project Explorer pane by ticking the check boxes in the 2D column (shown in the image above).
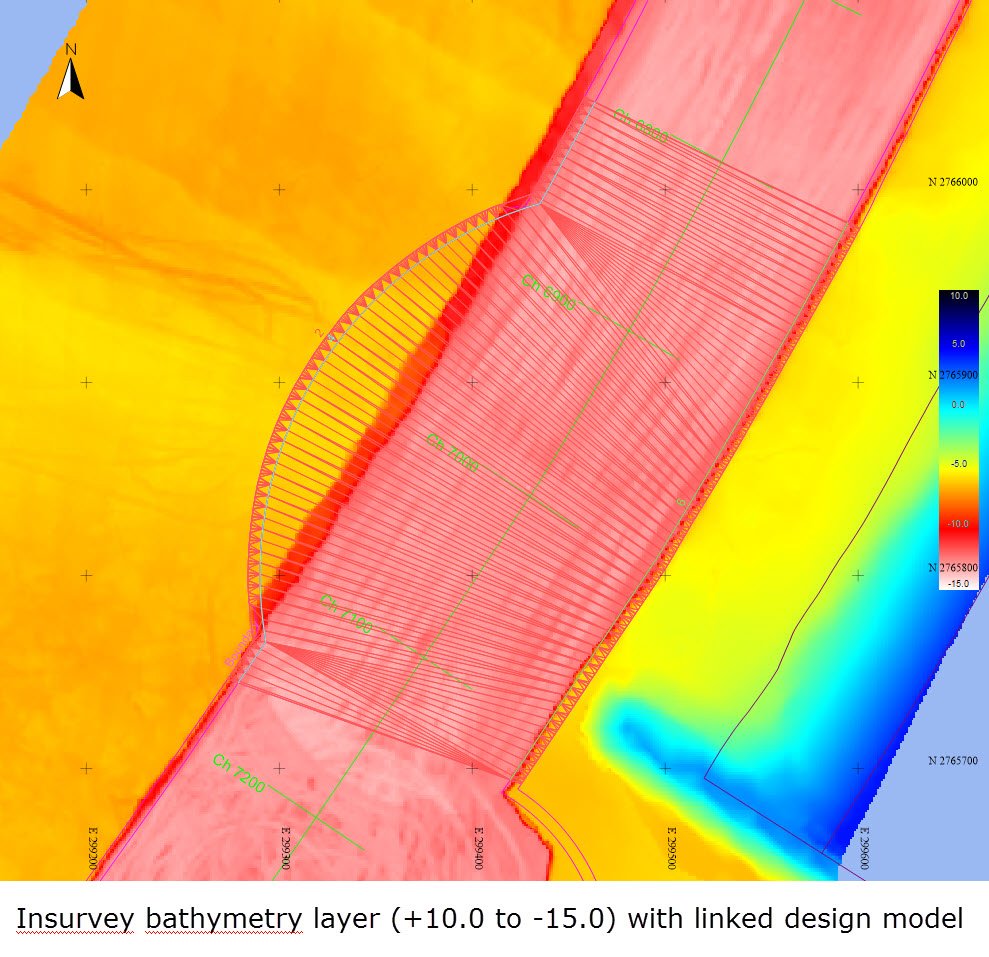
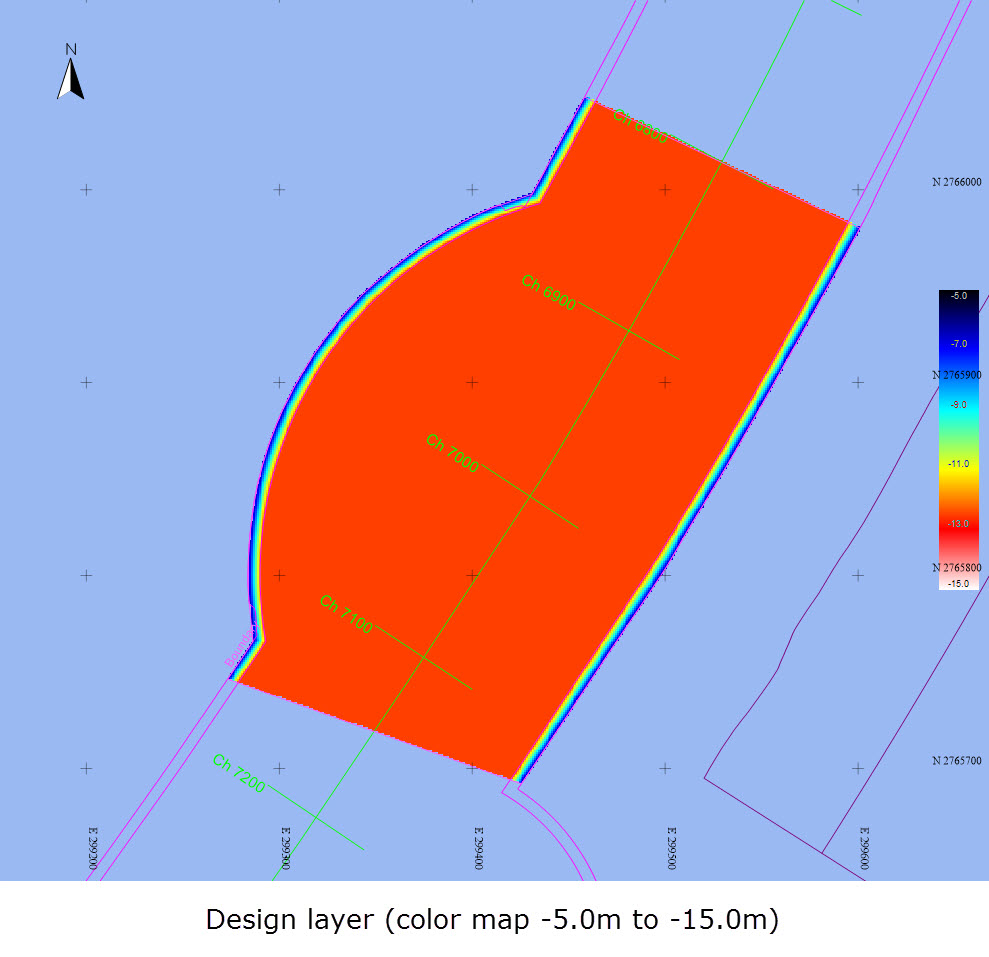
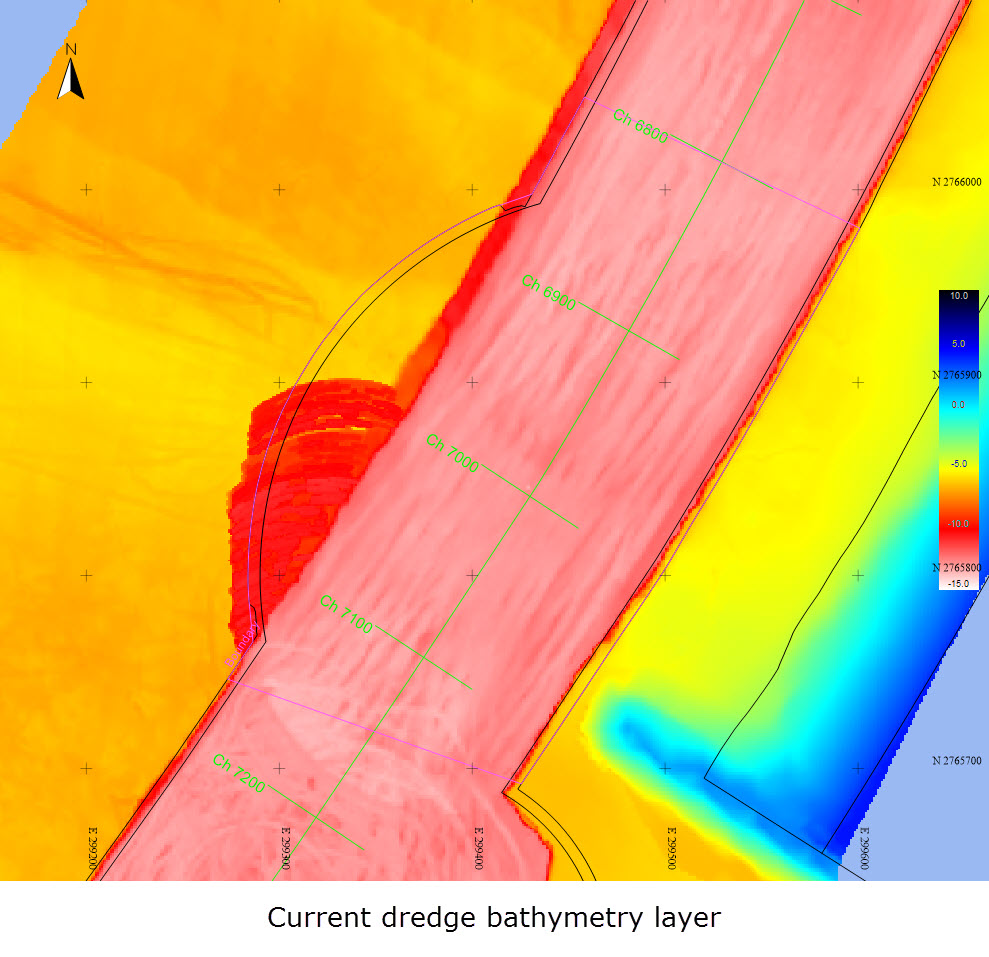
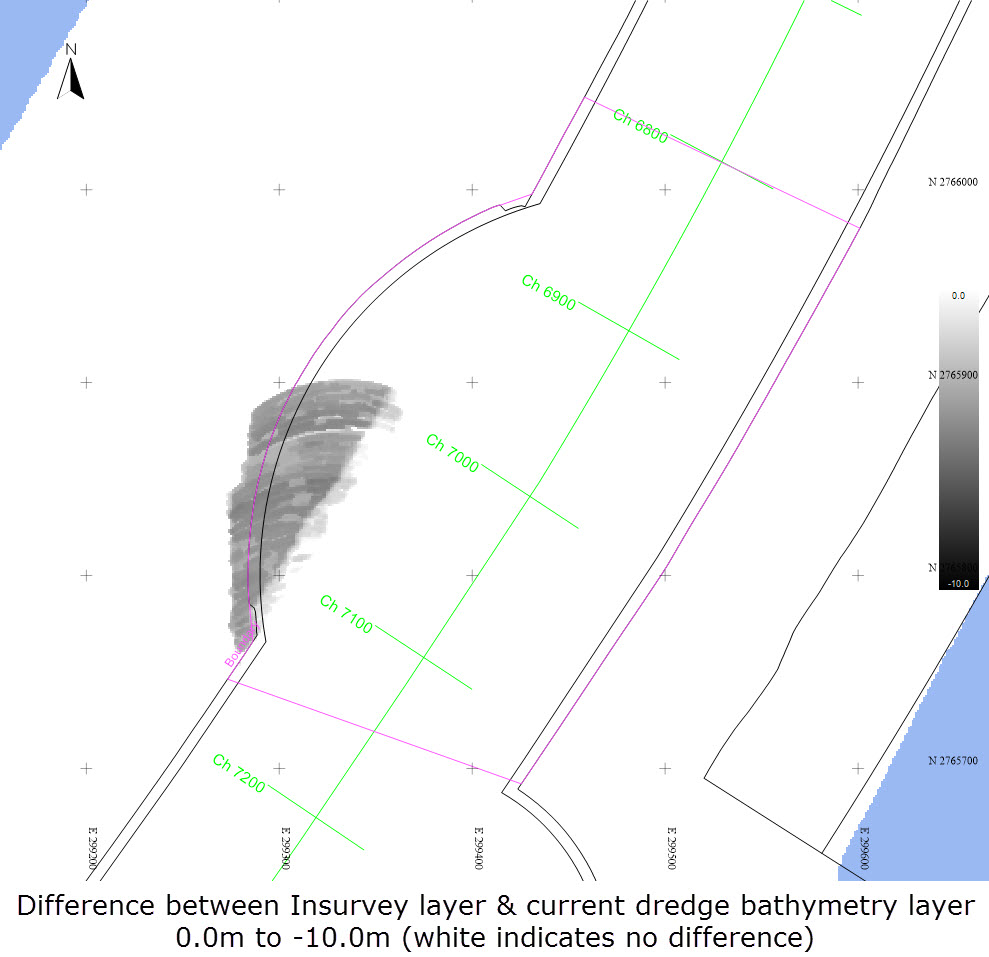
Referring to the four images below, in this example the purpose is to show:
-
The insurvey layer.
-
The design layer.
-
The dredge bathymetry layer (used during data acquisition to monitor the dredging operations.
-
The difference between the insurvey and dredge bathymetry layers, reflecting the volume excavated (or dumped). This requires the use of a Reference Layer - see Reference Settings below.
Note that different color maps and different min/max values are used to highlight specific features.
|
General Settings |
|
|---|---|
|
Description |
Enter a textual description for this configuration. The description is used to easily identify the configuration in the ribbon gallery. |
|
Attribute |
During data acquisition QINSy can be configured to maintain a track of various attributes per grid cell. If more than the Mean attribute was used select which should be presented in the View Plan.
|
|
Use Values From |
Project Settings - As entered in the Color tab of Global Settings accessed from the Console Settings menu.
|
|
Color Map |
Choose a set of colors from a predefined list. (This option is not available when Project Settings is selected in the line above.) |
|
Maximum |
Only when User Defined was selected above can this value be entered. For all other settings the value is shown. |
|
Minimum |
Only when User Defined was selected above can this value be entered. For all other settings the value is shown. |
|
Scan Active Grid for Min / Max |
Only when User Defined was selected above will this option be available. Use it to determine the minimum and maximum depths of the currently active grid. |
|
Overflow Color |
When depth values over the minimum are present they are colored as set here. |
|
Underflow Color |
When depth values below the maximum are present they are colored as set here. |
|
Reference Settings |
(not available for all Attributes) |
|---|---|
|
Type |
Choose None / Value / Design Model / Sounding Grid as the reference layer. |
|
Operation |
Choose to add or subtract the reference layer to or from the active layer. Only available when a Type was selected in the line above. |
|
Value |
Enter one value to compare the layer with. Only active when Reference Type was set to Value. |
|
File |
Select a file to compare the layer with. Only active when Reference Type was set to Design Model or Sounding Grid. |
|
Layer |
Select a layer to compare the layer with. Only active when Reference Type was set to Design Model or Sounding Grid. |
|
Attribute |
Select which type of data to place in the layer : Mean / Minimum / Maximum values. Only active when Reference Type was set to Sounding Grid. |
|
|
|
|
Return to: top of page.
2D Profile View
The Profile View is used to show a Quick Profile or to generate profiles from loaded Surveys, CAD and Sounding grid files.
Please refer to Processing Manager Help pages for a description of the Profile View functionality.
Quick Profile
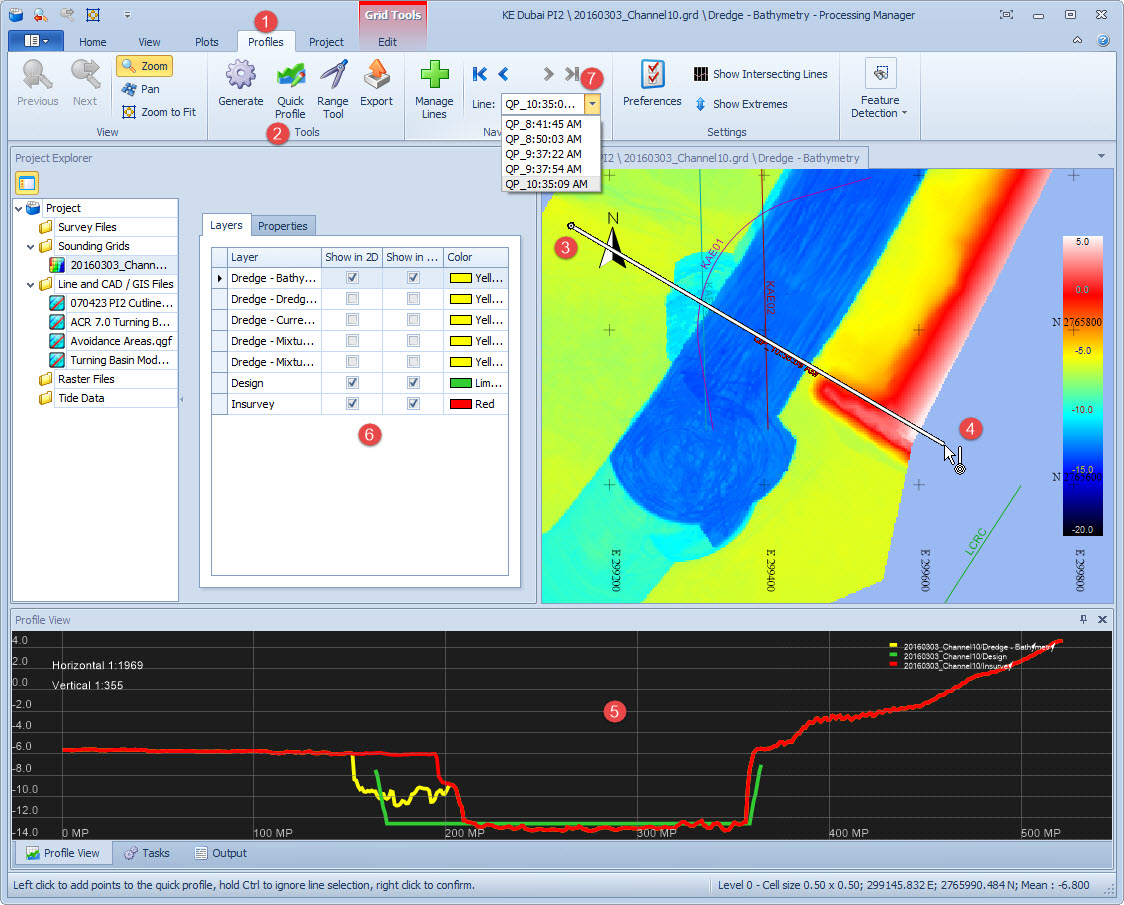

Right click with the mouse to finish creating the profile line/polyline.
Now you can analyse that data or create another profile line.
When no further Quick Profiles are needed press the 'Esc' button to cancel the profile line operation.
Creating a profile line from a Line Planning file
Line planning files are also used to create profile lines.
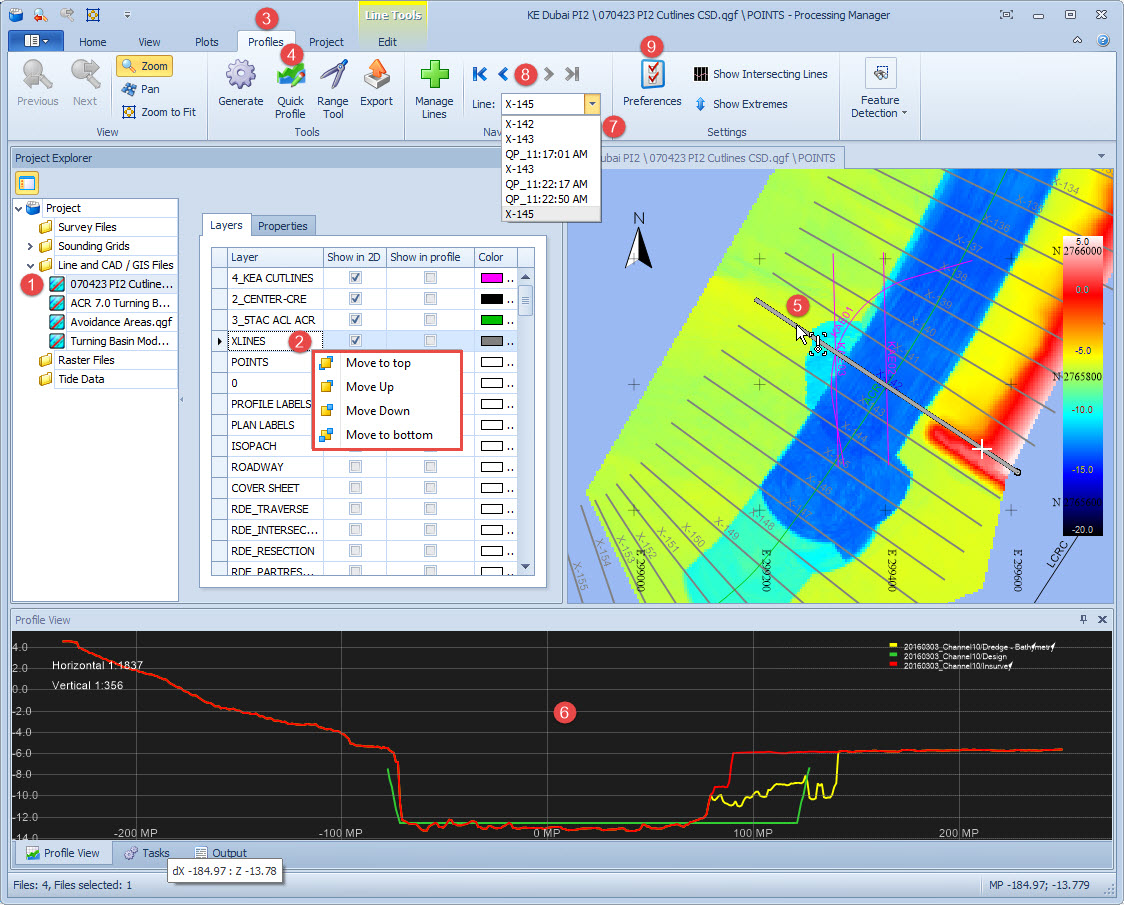
Right click to move the layer up or down, to make first or last.
Change layer Color if preferred.
By default, when moving the mouse over lines that are a part of a line planning file, the cursor style changes 
When lines are displayed but you want to generate a user-defined Quick Profile, holding Ctrl changes the cursor back to
, allowing you to locate start and end points close to, or identical with, a line from a QGF line file.

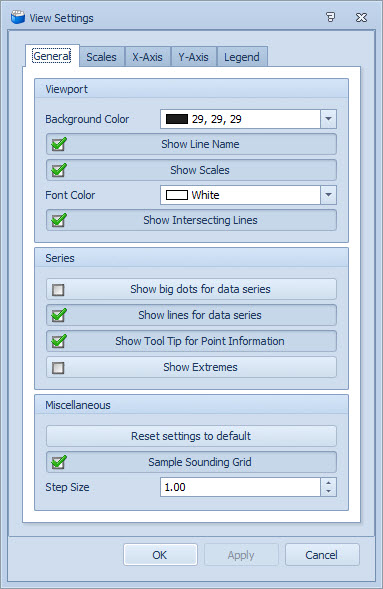
Return to: top of page.
Auto-Generation of Profiles
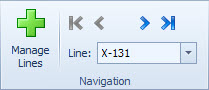
Use the Manage button 
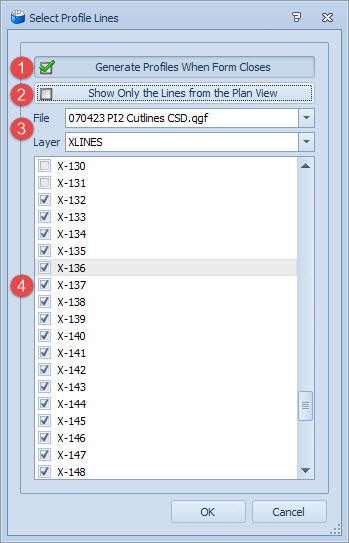

Make sure the CAD layer is switched on in the Project Explorer panel.
Click OK to begin the generation. Progress is display in the Profile View.
On completion the first line in the batch is shown. Use the drop down list and/or the scroll buttons to step through the profiles.
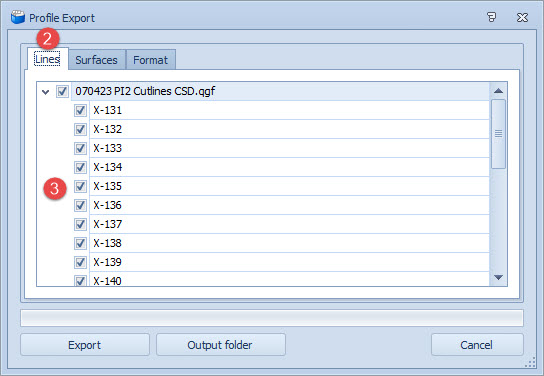
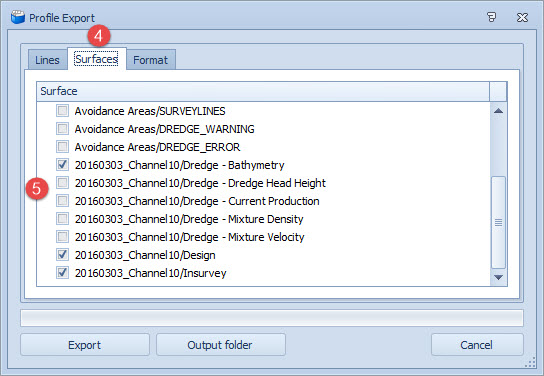
Export Profiles

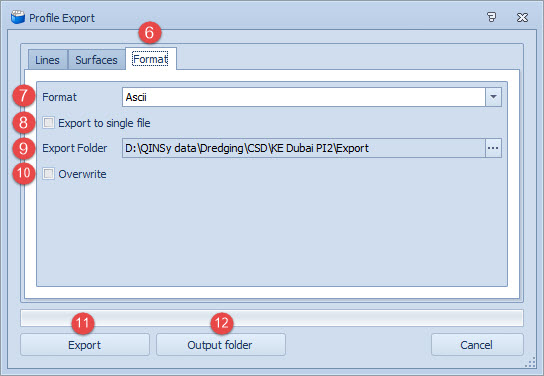
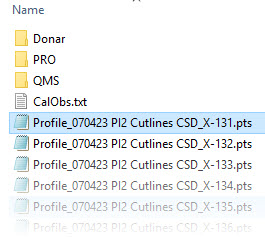
If ticked the exported files are output in one file named ProfileExports.pts.
By default this is the \Export folder of the current Project.
Only visible when Export to Single File was not ticked. Use the browse button to set another directory if needed.
Enter a file name. This option is only visible when Export to Single File was ticked. Use the browse button to set another directory if needed.





Return to: top of page.
3D View
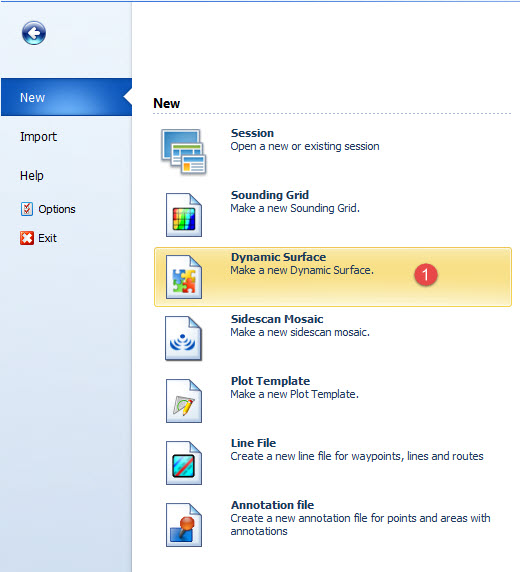
A Dynamic Surface (formally a Navigation Surface) is required in order to visualize the data in 3D.
Typically a Dynamic Surface is made directly from QPD Survey Files. However, in Cutter Suction dredging, QPD files do not contain soundings per se. But a QPD file is mandatory.
There is a way to make a QPD from a sounding grid layer as follows.
Import Grid Files
The purpose is to create a new *.QPD file by importing the contents of a sounding grid file (*.GRD).
This option is useful if you don't have the DB file and QPD file available, but only XYZ or grid files.
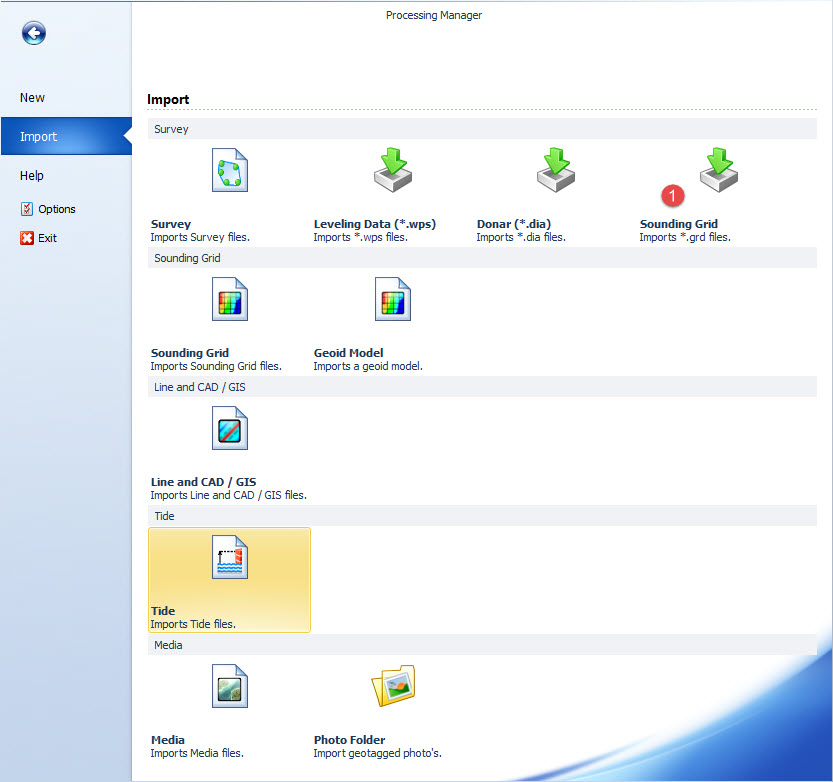
The Select Sounding Grid File dialog defaults to the \GridData sub-folder of the current project folder.
Multiple *.GRD files may be added.
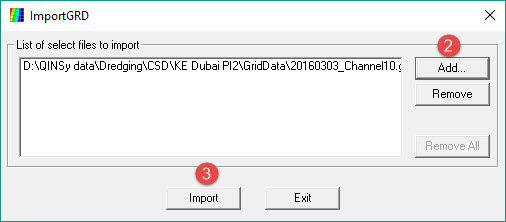
Click on the Close button once the import process is finished.
Import Results
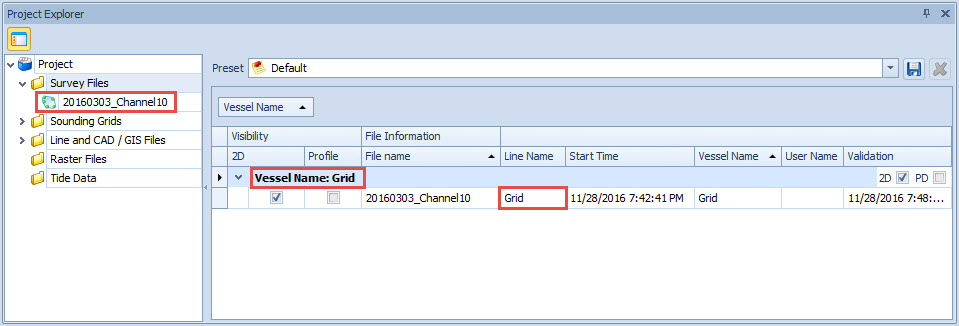
In the Project Explorer pane note that:
-
A new *.QPD file is listed under Survey Files. It bears the same name as the *.GRD file. Only the first layer of the grid is imported.
-
The data is linked to a new vessel with the name 'Grid'.
-
The data is linked to a line named 'Grid'. This is the enclosing rectangle of the grid data. This line is embedded in the *.QPD, and can be used as a scroll reference line in the Validator.
-
The data is linked to a new sensor system called 'Sounding Grid'.
-
Date and time of the data are the moment of import into the *.QPD file.
-
The X,Y,Z values are the values of the mean depths of each grid cell.
Making the Dynamic Surface
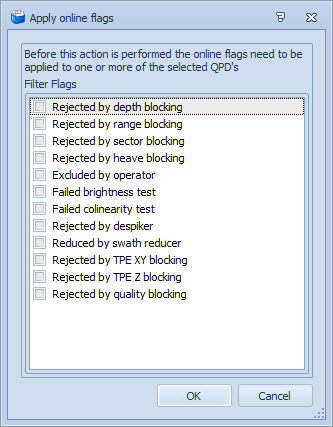
The Apply Online Flags dialog is displayed first. Click OK.
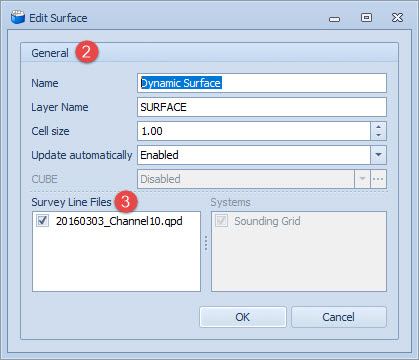
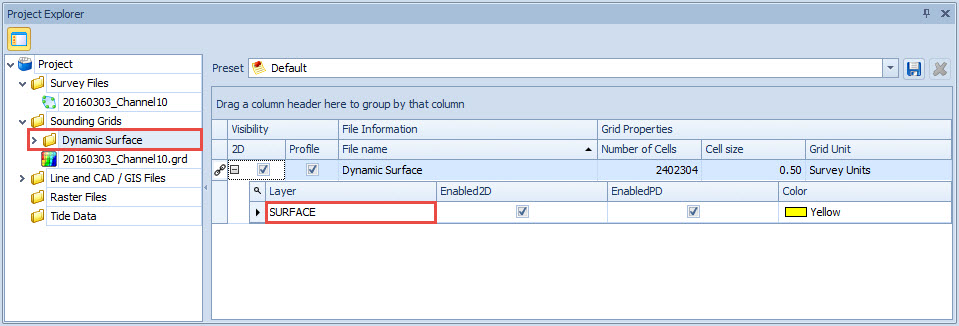
A new sounding grid is created as shown in the Project Explorer pane:
3D Visualization
The Perspective window shows only the Dynamic Surface selected in the Project Explorer in 3-dimensional view.
3D View reflects live updates of the Dynamic Surface.
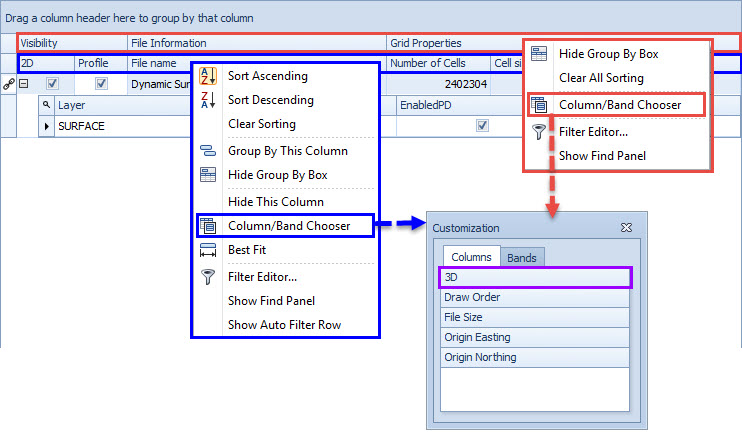
If that check box is not immediately visible, right click the upper column titles row (red outline) or in the second row of column titles (blue outline).
Each shows a different menu but both contain the Column/Band Chooser. Both options lead to the same Customization dialog.
Double click on 3D to load that column.
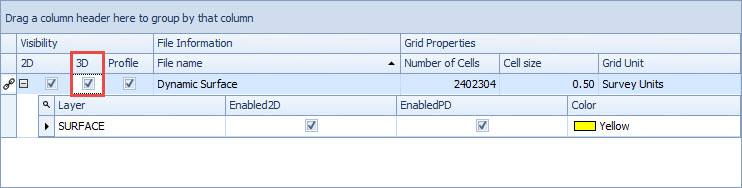
The additional column is added:
Return to: top of page.
Return to: CSD - Dredging Results.