
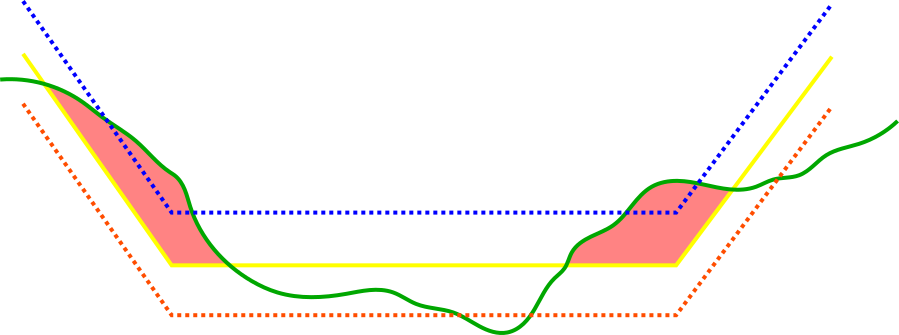
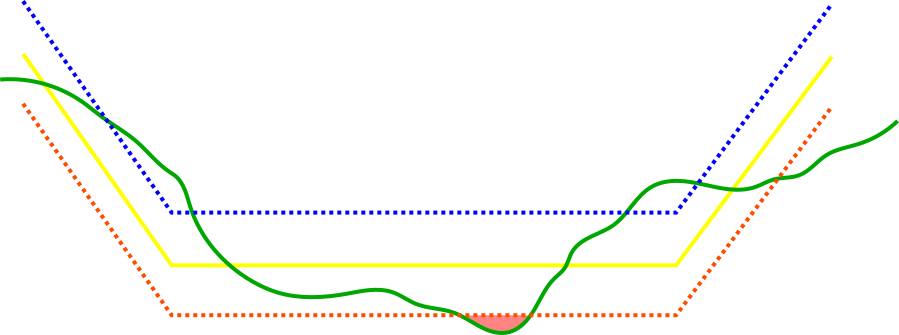
When using a design model the following illustrations refer to the volumes calculated :
-
-
The green line represents the Survey.
-
The yellow line represents the Design.
-
The blue line represents the upper tolerance.
-
The orange line represents the lower tolerance.
-
|
Above design Everything that is above the design height |
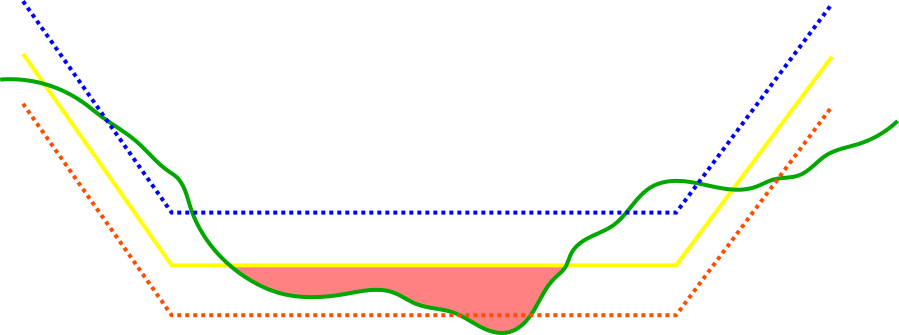
Below design Everything that is below the design height |
|
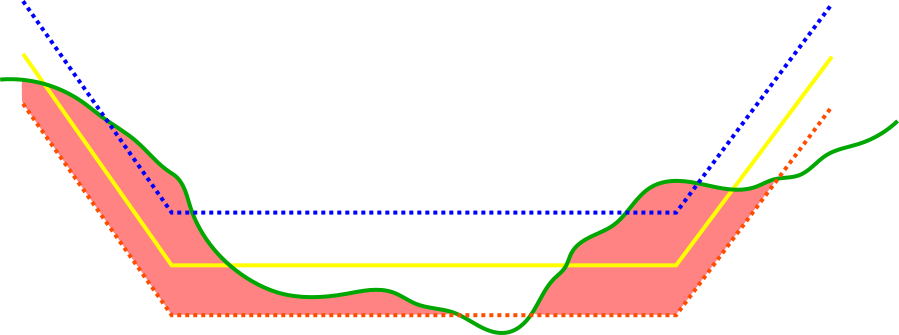
Over design Everything above the lower tolerance (only calculated when the tolerances are used) |
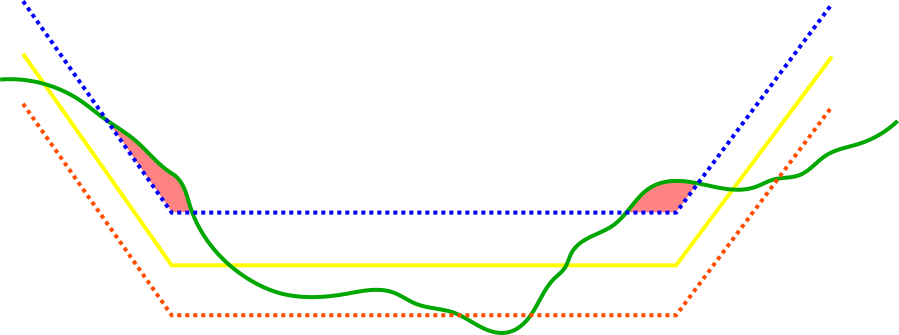
Above tolerance Everything above the upper tolerance (only calculated when the tolerances are used) |
|
Below tolerance Everything below the lower tolerance (only calculated when the tolerances are used) |
Return to top of page.
Return to CSD - Dredging Results.