
Introduction
In this release, we introduce additions to Qimera command, Grid Coverage, Grid Date/Time, Grid Overlap report, beam average intensity gridding and more. Read on below for more detail.
Please contact our Sales team if you'd like to arrange for an evaluation of Qimera.
Qimera-command
A new add-on is required on your license to run qimera-command.exe, reach out to our Sales team to have this add-on added to your license.
Ten new jobs have been added to Qimera-command:
-
Configure the specified grid for visualization (
configure-grid) -
Remove files from grid (
remove-from-grid) -
Remove source files from project (
remove-from-project) -
Export the grid to ascii xyz (
export-grid-ascii) -
Export the grid to a floating point geotiff (
export-grid-floating-point-geotiff) -
List the available colormap files (
list-colormaps) -
List the source files in the project (
list-source-files) -
List the grids in the project (
list-grids) -
List the SD Objects in the project (
list-sd-objects) -
List the vessels in the project (
list-vessels)
In addition, a configuration mode was added to qimera-command. The --config flag is used to specify a path to a JSON file that contains a list of jobs to be run along with arguments.
# EXAMPLE - Running a config of multiple jobs in a JSON file
"C:\Path\To\bin\qimera-command.exe" ^
--config="C:\\Path\\To\\config.json"
# EXAMPLE - JSON Config to run a collection of jobs that will create a project,
# add all the files in a specific folder, and create a dynamic grid

{
  "project-folder": "C:\\Users\\username\\QPS-Data\\Projects\\test",
  "jobs": [
    {
      "job": "create-project",
      "epsg-code": 32610
    },
    {
      "job": "add-raw-sonar-files-db",
      "folder-path": "C:\\Users\\username\\Documents\\sonarfiles"
    },
    "auto-process",
    {
      "job": "create-dynamic-grid",
      "name": "Dynamic Grid",
      "cell-size": 0.25
    }
  ]
}
Grid Coverage and Date/Time attributes
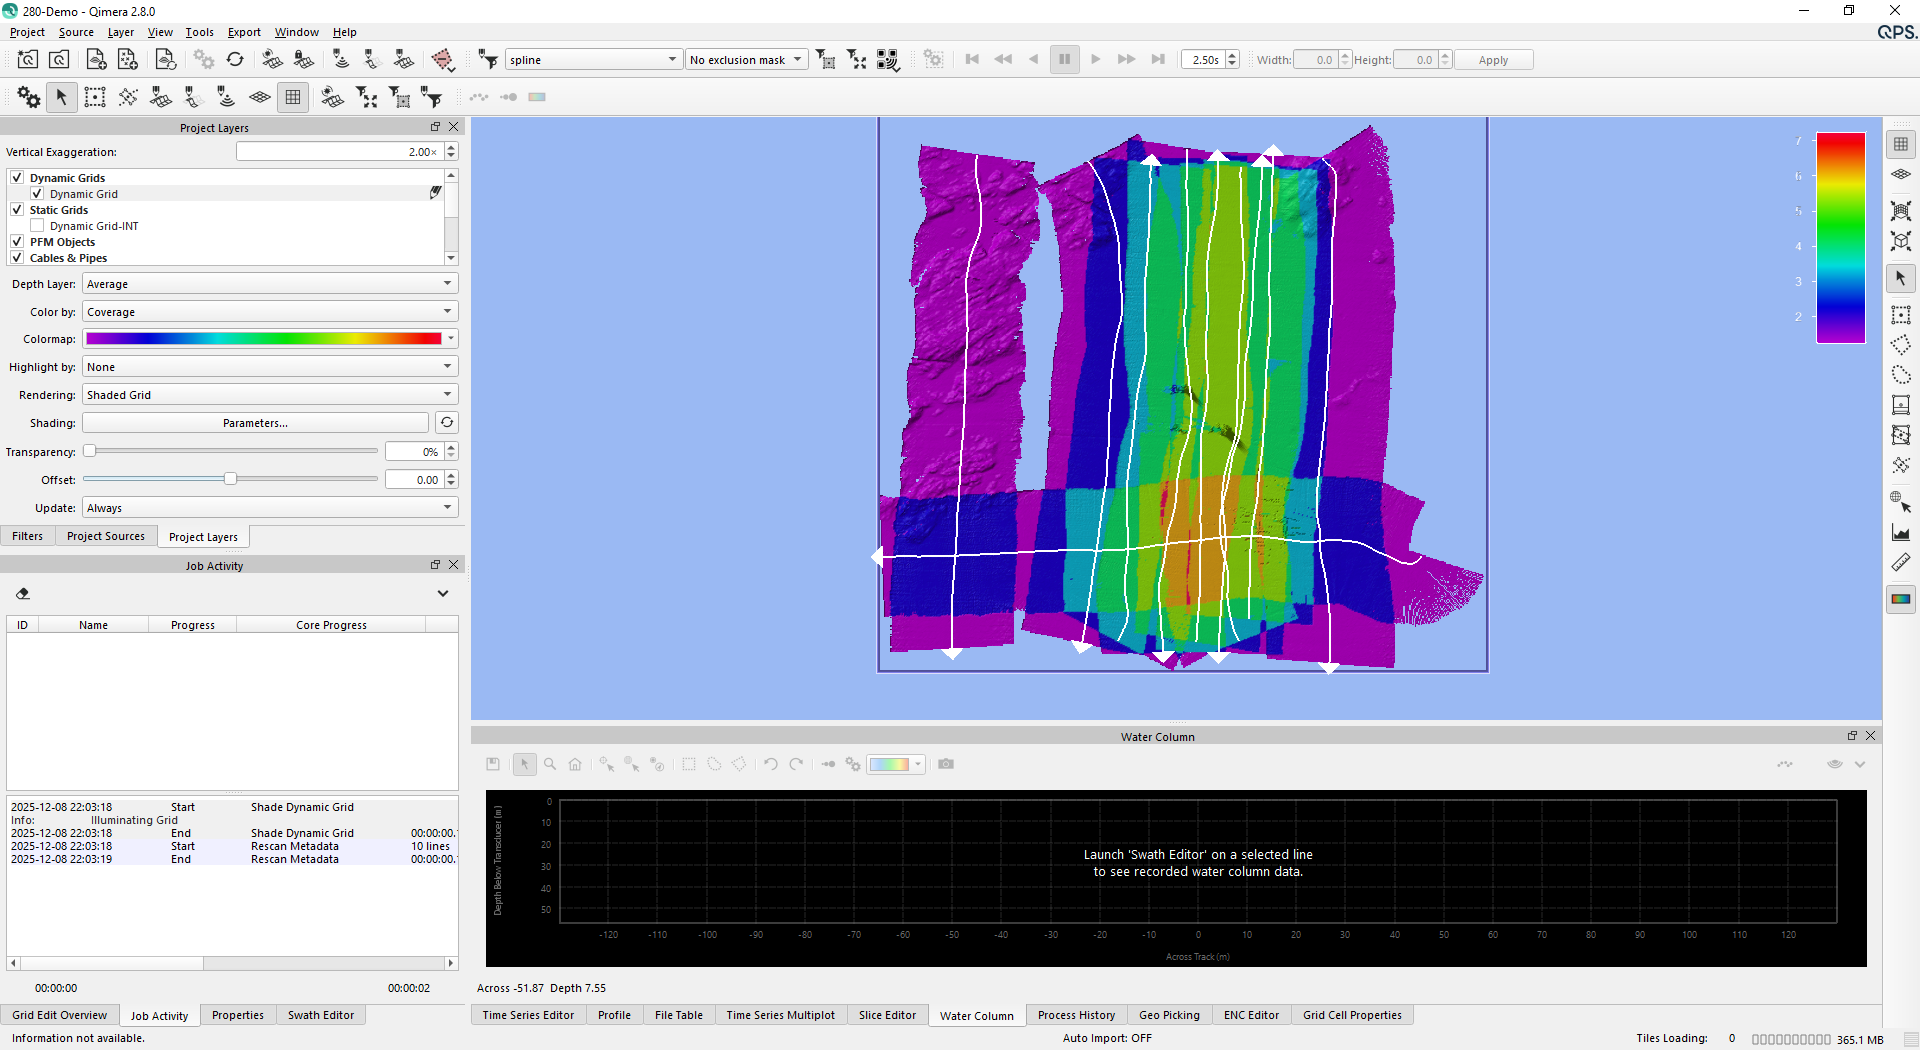
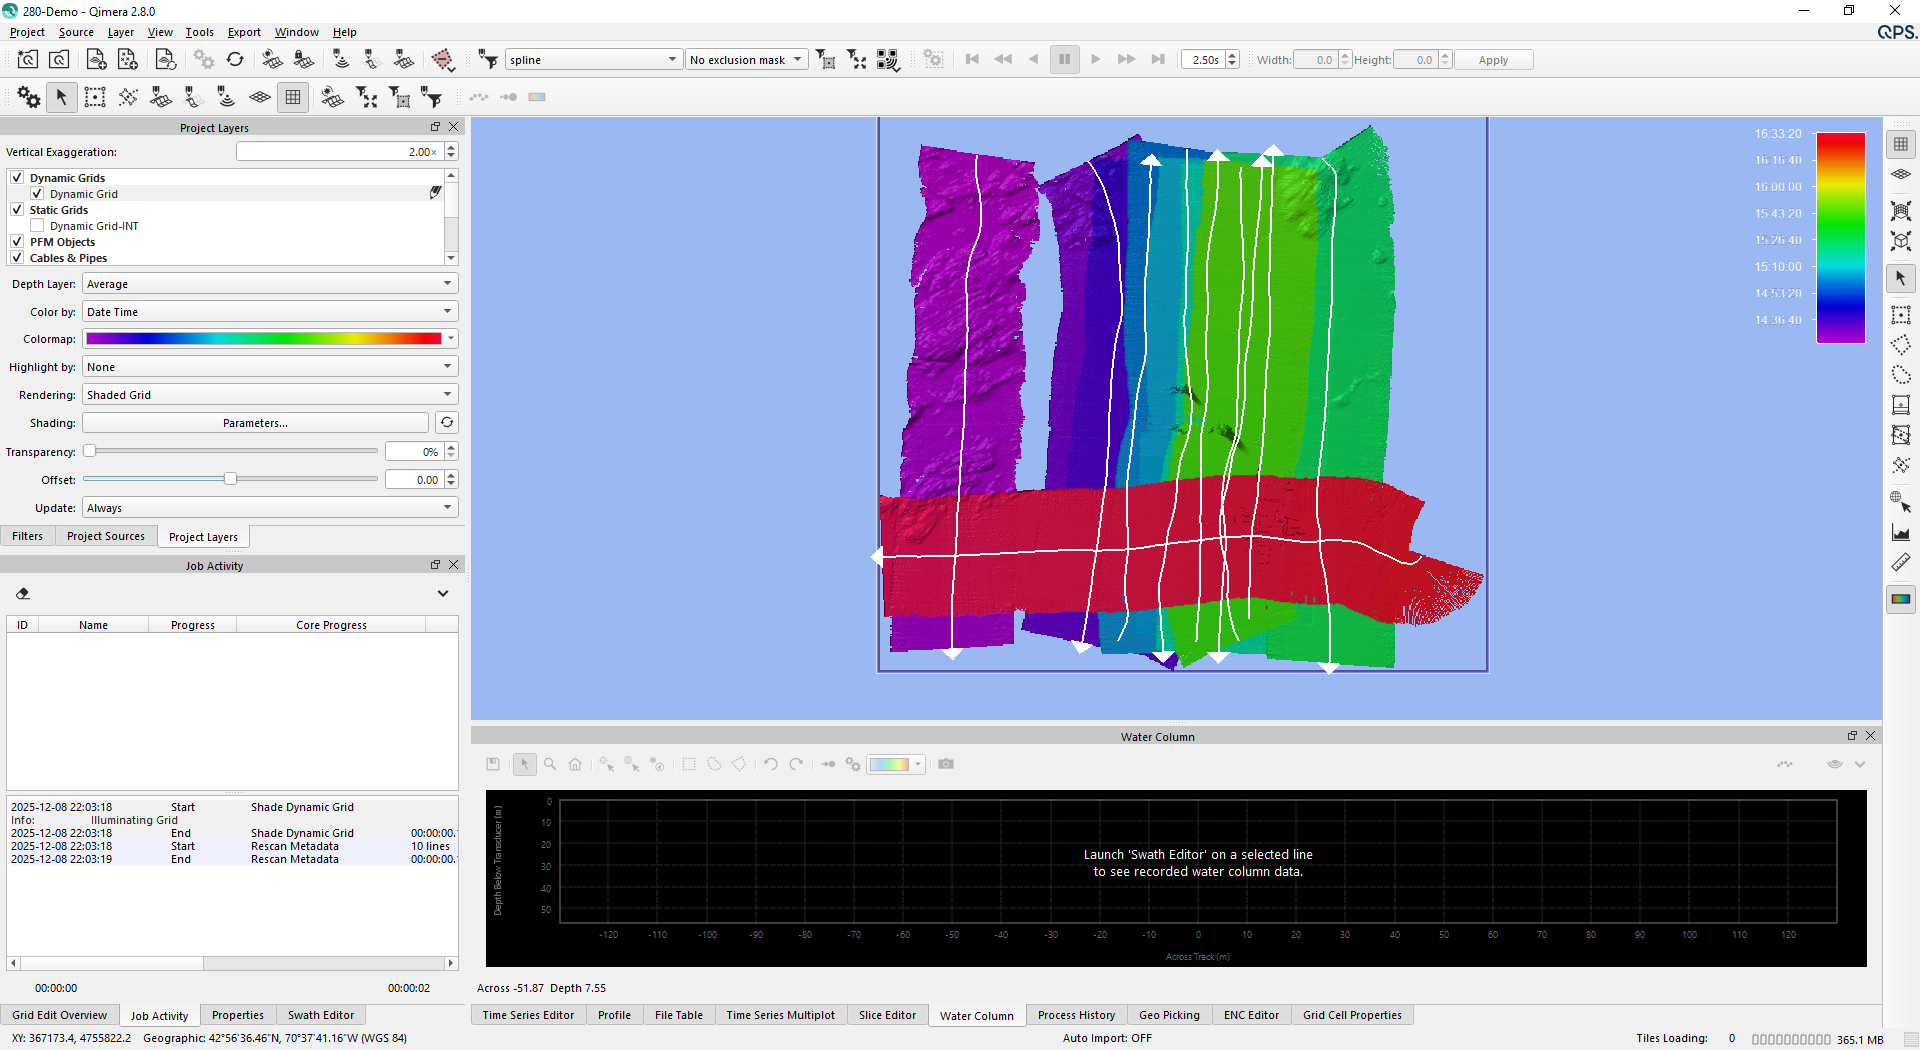
Grid coverage and date/time attributes have been added to new Dynamic Grids. These new grid attributes are optional, and will use slightly more disk space. If coverage and date/time attributes are included when creating a Dynamic Grid, these attributes are displayed by selecting them in the Color By: attribute of the selected Dynamic Grid.
Grid coverage is the number of times a grid cell has been covered by a unique survey line.
Grid date/time is the latest timestamp from a footprint that contributed to the grid cell.
Grid Overlap Report
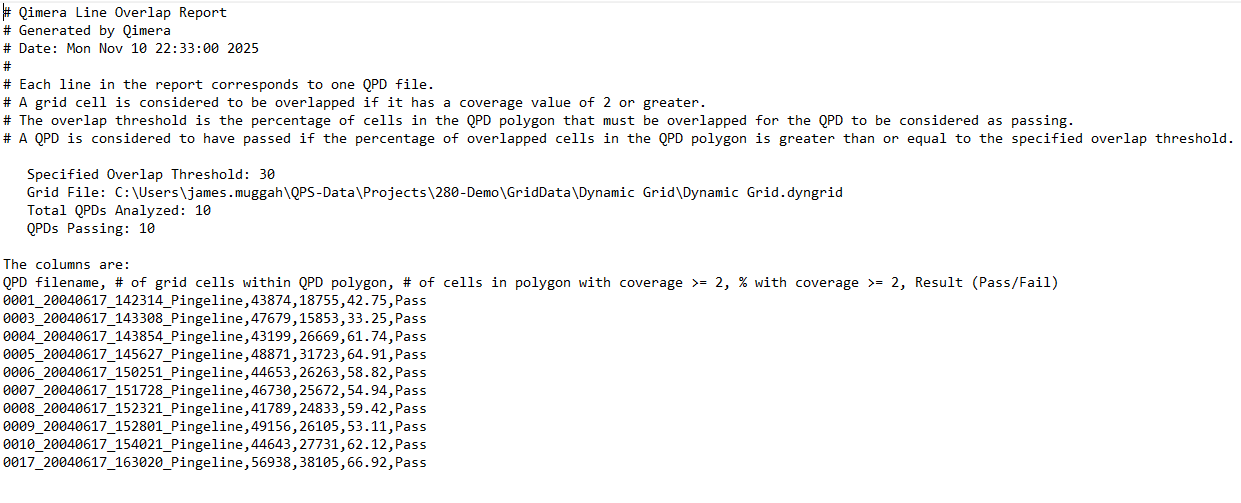
A new grid overlap report generates an ASCII text report outlining the amount that a given line is overlapped by other lines. It uses a user defined percentage which determines if a given line meets an overlap percentage criteria. The resulting text file lists the line name, number of grid cells within the line, number of grid cells with coverage >= 2, percentage with coverage >= 2, and a pass/fail result. You can generate this report by right clicking on a Dynamic Grid > Grid Operations > Generate Overlap Report… Note that the Dynamic Grid must contain Coverage and Date/Time attributes.
Beam Average Intensity Gridding
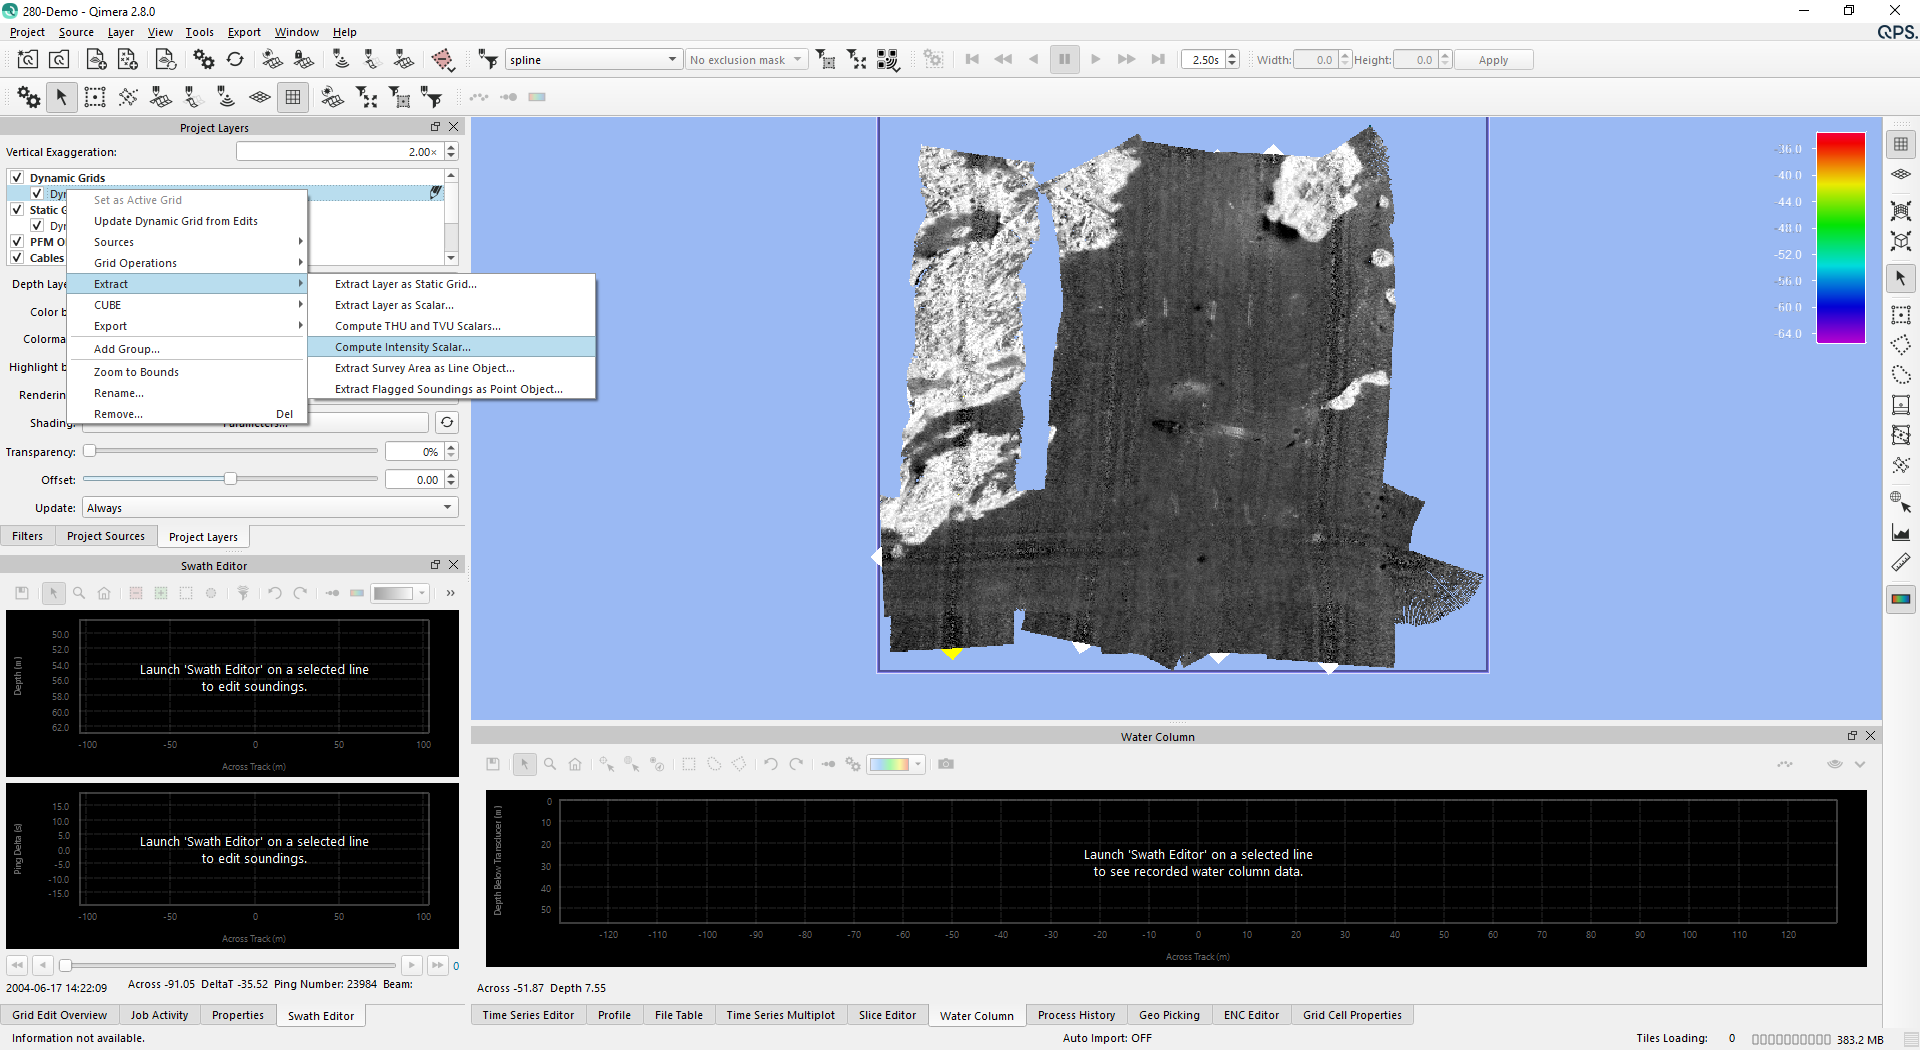
A new option was added to grid beam average intensities if present in the source files. You can create an intensity grid by right clicking on a Dynamic Grid > Extract > Compute Intensity Scalar…
Geo Config - EPSG Version 12
As part of the X.8 Release we updated the EPSG database version to 12.025.
.png?cb=a292656109ac9fb43a5c76336ad04658)
Geo Config - New workflow for adding/creating Geoid models
A new workflow has been added to the Geodetic Configuration UI, which makes it easier to add or create Geoid models. It is available in Qinsy, Qimera and Fledermaus X.8.