
Qinsy 9.6.0 - New Functionality
Console
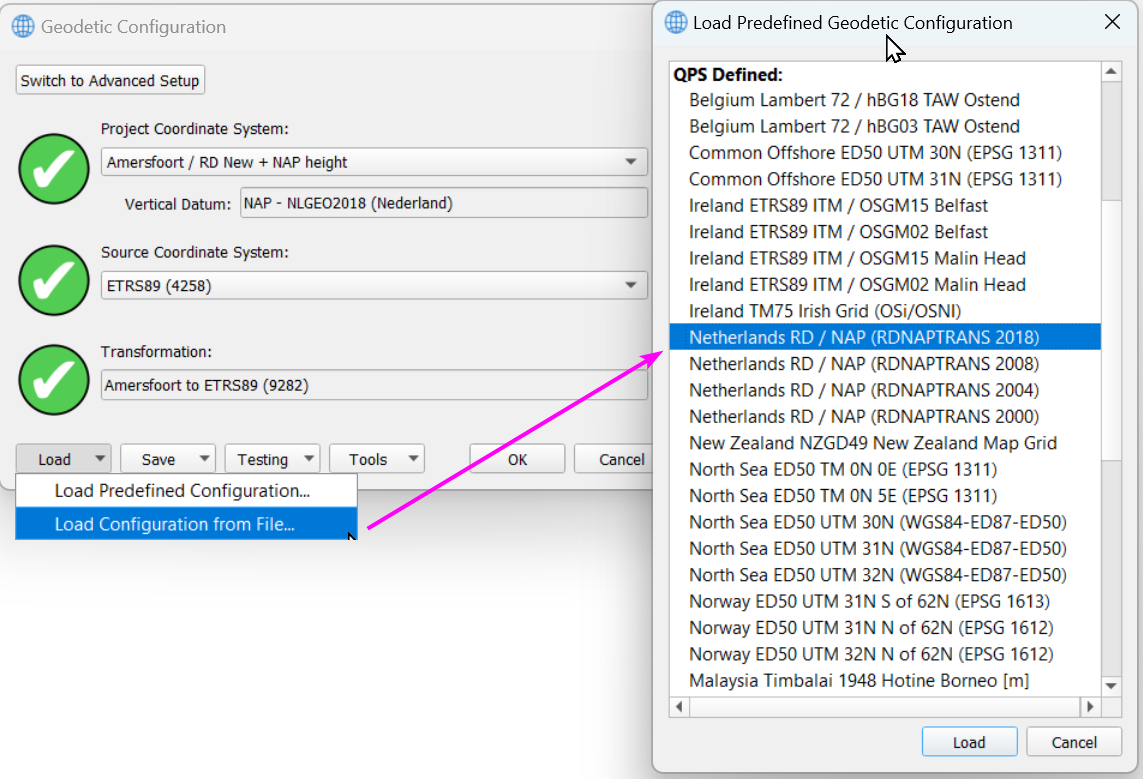
Geo Config - EPSG Version 10
We now supports EPSG database version 10 and it is default included in
Qinsy 9.6
Qimera 2.6 and
Fledermaus 8.6.
See “Important Notes” page of these release notes for more details
Geo Config - ITRF2020 added
ITRF2020 datum and transformations are now available
Drivers
ADCP - Nortek - Signature VM

The drivers supports the Nortek VM Operations 333kHz vessel mounted ADCP and and other Signature VM systems outputting the related ASCII format which is based on NMEA formatted messages.
The following records are included in this estimation:
NMEA Prefix | Description of content |
|---|---|
CODE
| General Information |
CODE
| Velocity data per Cell |
CODE
| Quality and performance figures |
CODE
| Current Speed and Direction |
Driver Manual:
Nortek Signature VM (UTC)
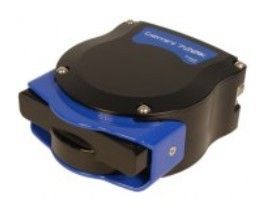
Cable Tracker - SMD Artemis

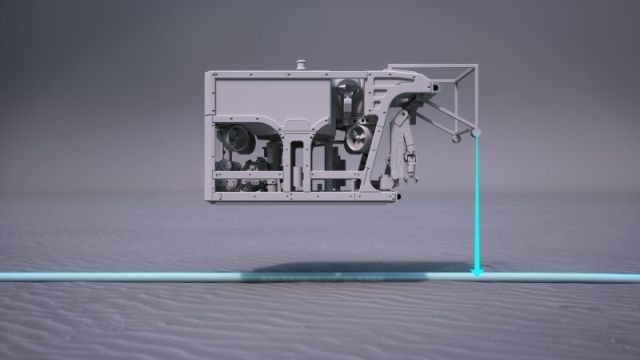
SMD Artemis
Driver to decode data from the Artemis Cable Tracker, manufactured by SMD, capable of detecting and locating buried power cables and pipelines under the seafloor.
Decoded cable tracker data can used in Qimera with the Top Of Product (TOP) detection tool .
Driver Manual:
SMD Artemis Cable and Pipe Tracker (Aft Dual or Single Solution) (UTC)
DVL - Nortek - Nuclues 1000
Nuclues 1000 DVL
The driver (was released on January 25th, 2022 with Qinsy 9.5.4.) supports the following formats:
DF3
DF21
DF22
Driver Manual:
Network (TCP) - Nortek Binary (Speed) (UTC)
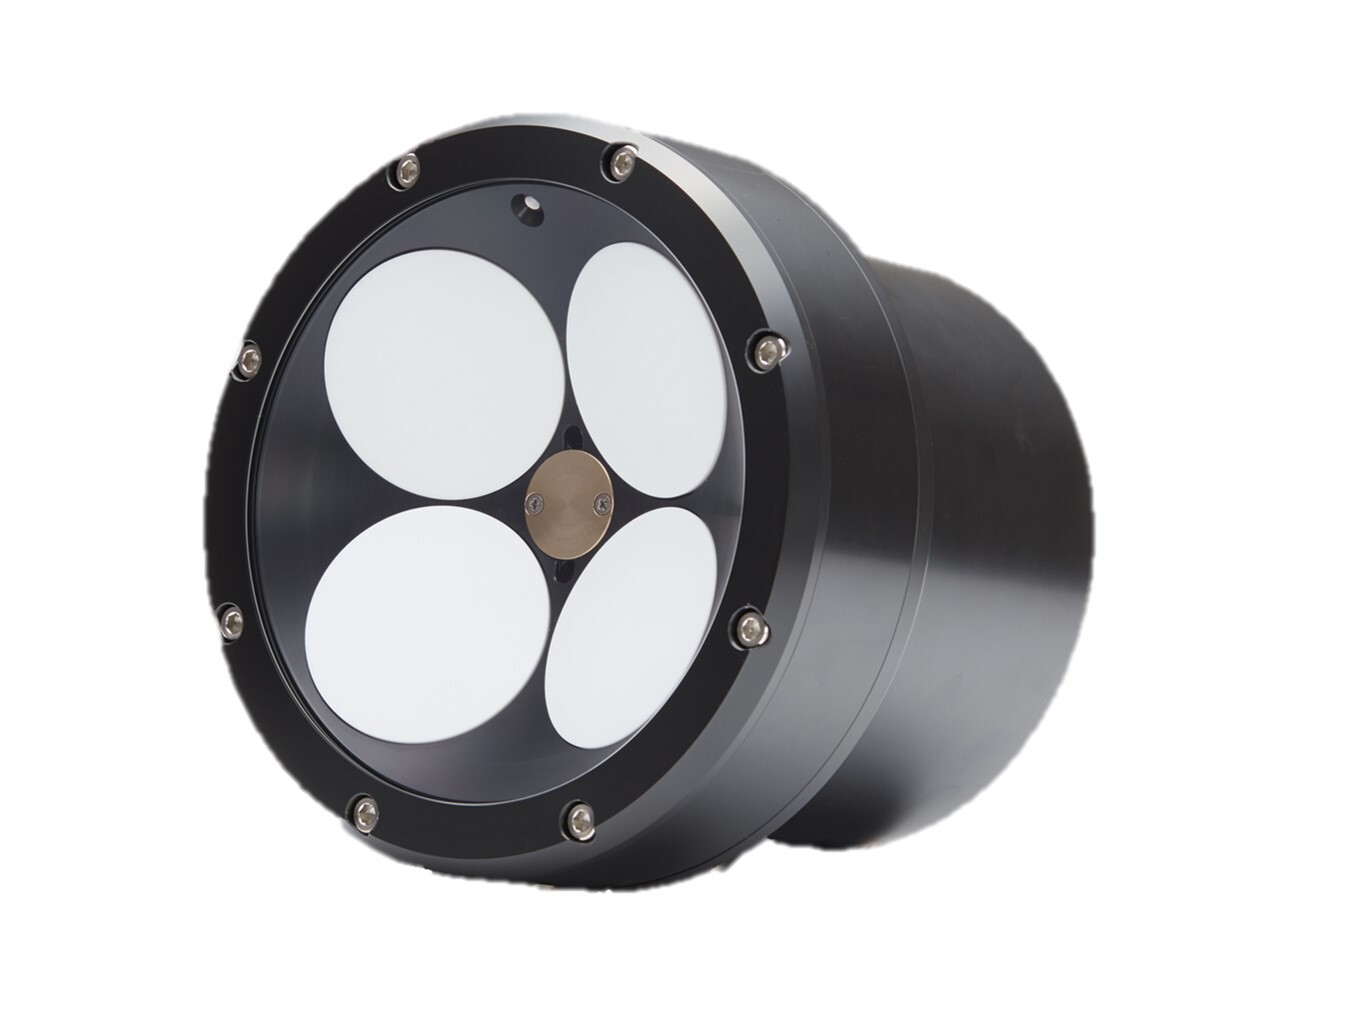
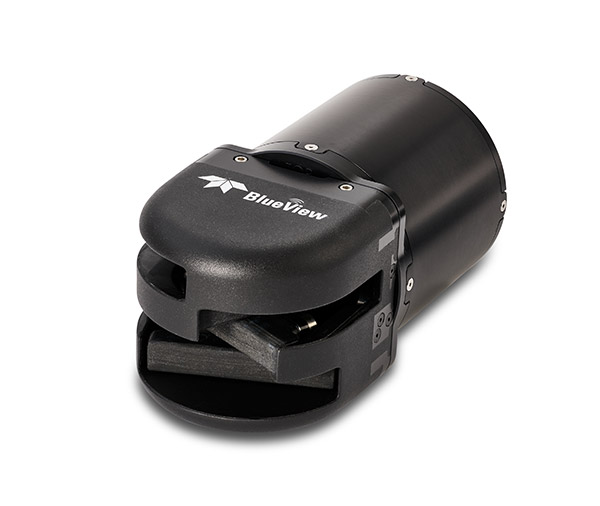
Forward Looking Sonar (FLS) - Teledyne BlueView

Including options for decoding of Pan and tilt values
Driver Manual:
Teledyne Blueview M900 (Forward Looking Imaging Sonar)
Forward Looking Sonar (FLS) - Tritech Gemini

Driver Manual:
Tritech Gemini (Forward Looking Imaging Sonar)
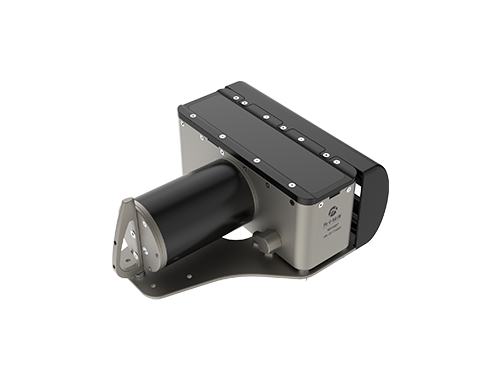
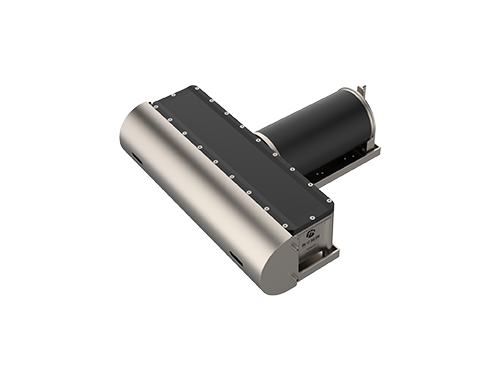
Laser - Riegl - VUX-1HA22
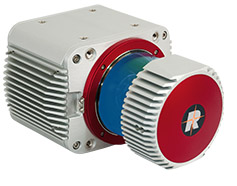
Driver to control and decode the real-time data-stream from a RIEGL VUX-1HA²², a compact, very lightweight and highly accurate laser scanner.
Driver Manual:
Laser Scanning - RIEGL VUX-1HA-22 (UTC)
Laser - Riegl - miniVUX-HA
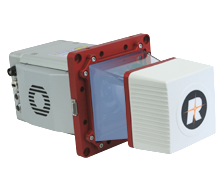
Driver to control and decode the real-time data-stream from a RIEGL miniVUX-HA, an extremely lightweight and compact highly accurate laser scanner.
Driver Manual:
Laser Scanning - RIEGL miniVUX-HA (With UTC)
MBES - Hydro-Tech - MS400P / MS400U / MS8200

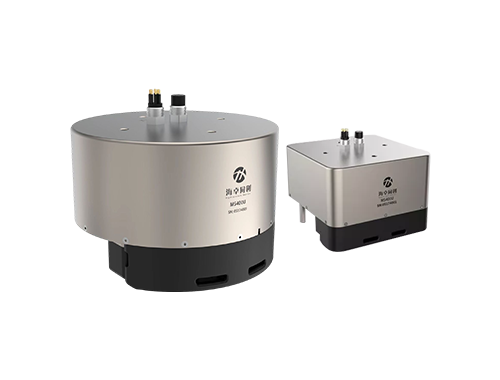
MS400U
MS400P
MS8200e
This new drivers support various models of Hydro-tech Marine.
This release does not support the Water Column Data (WCD) yet, but is on its way for the next release.
Please contact us if you want to test the WCD recording for us.
Drivers Manual:
Hydro-Tech - MBES
Miscellaneous - Wind Calculator for Offshore Construction (DNV)

Driver with user-interface, typically used on board of construction vessels involved in offshore operations where it is important to monitor the current wind speed at any level above the sea surface.
The formula used is based on the guidance notes from Det Norske Veritas AS (DNV)
Drivers Manual:
Wind Calculator
Output - AutoPilot - UDP version
The driver has exactly the same functionality as existing Serial and TCP drivers
Showing autopilot track is now default enabled in a new created navigation display
Online
Forward Looking Sonar (FLS)
This is a first release of the Forward Looking Imaging Sonar functionality.
We now offer FLS drivers for 2 Imaging systems
Teledyne BlueView
Tritech Gemini
For these systems we upgraded our database to support the Forward Looking Imaging Sonars as a dedicated system and not to confuse them with the already supported Forward Looking Bathymetry Sonars that are part of the Multibeam systems like:
Far Sounder
Coda Octopus (older versions)
For Forward Looking (Imaging) Systems (FLS) we:
Store the received observation as raw data in the DB.
Show the received (raw) data for verification in the:
Raw Multibeam Display (see below under Displays)
Observation Physics Display
In the upcoming Qinsy 9.7.0 release we will make more options available.
Displays
Forward Looking Sonar (FLS)
Raw Multibeam Display showing FLS imaging data
We modified the Raw Multibeam Display to show the Forward Looking (Imaging) Sonar data.
Surface Navigation (Beta)
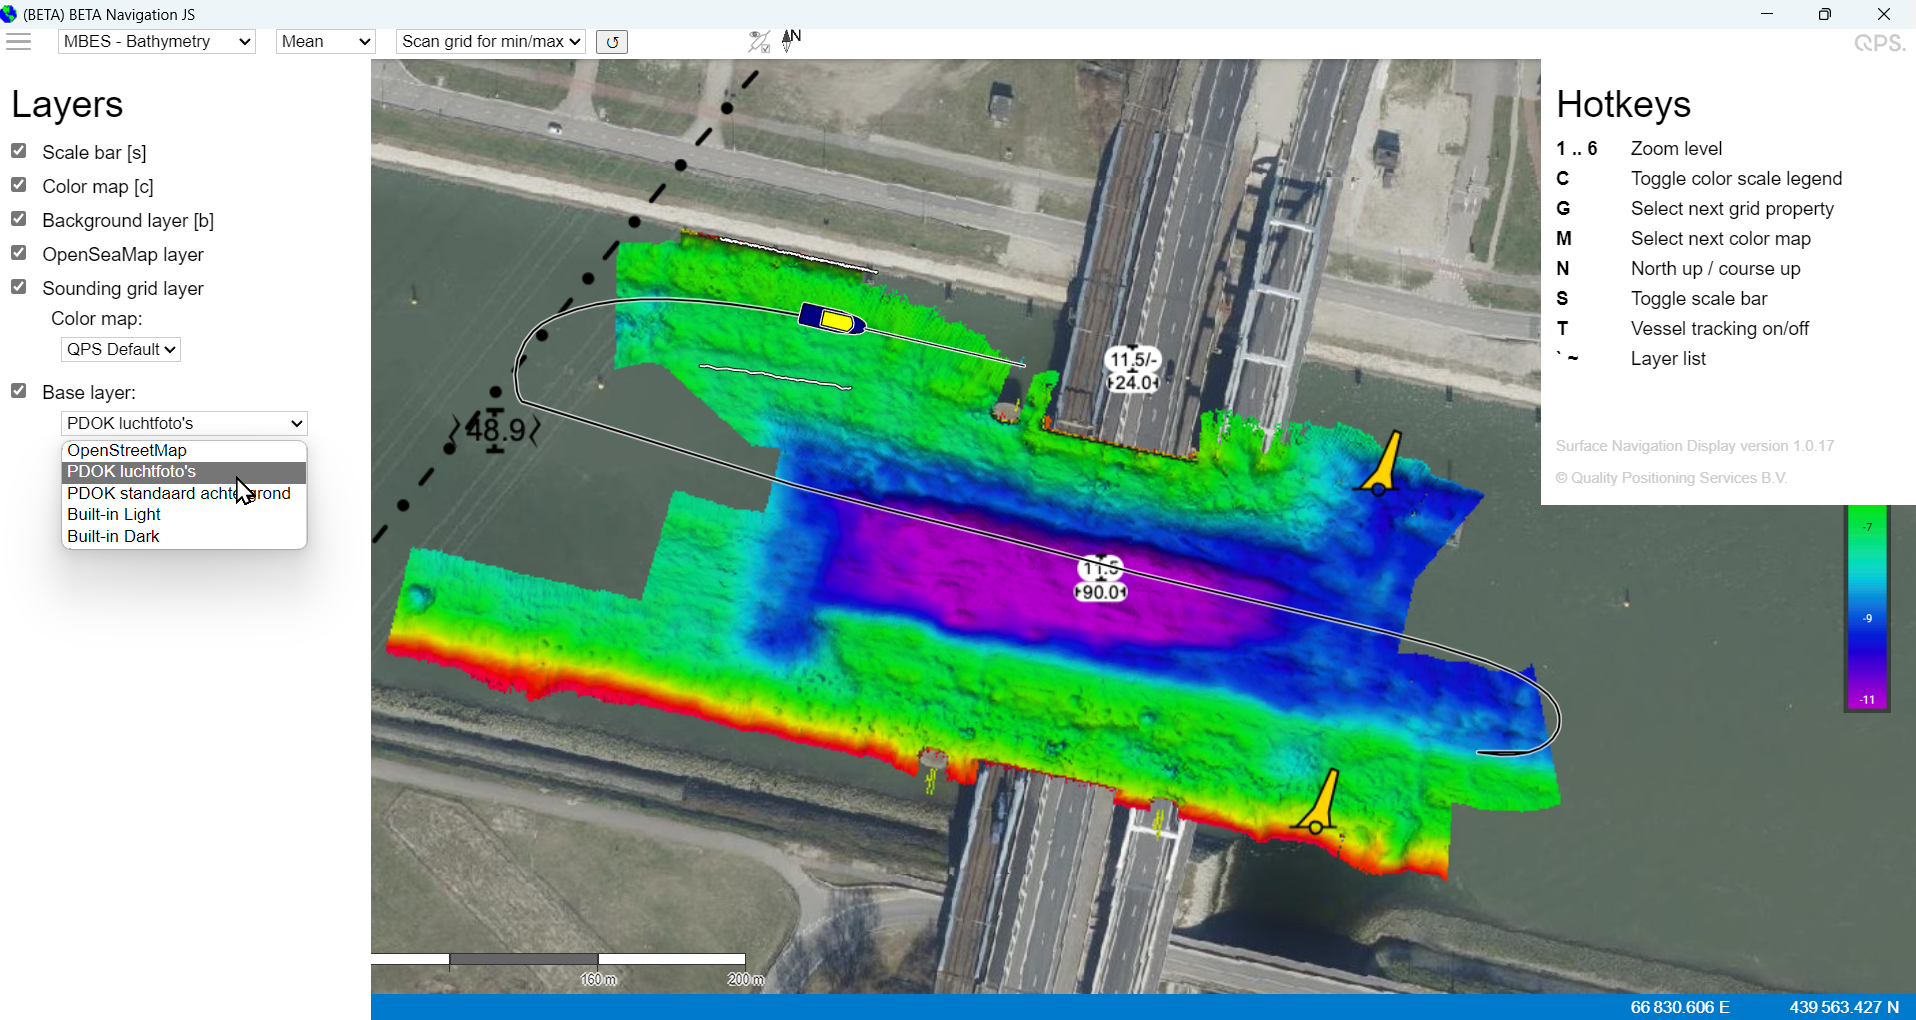
Short cut key support
In principle, all sources supported by OpenLayers can be displayed. In practical terms, the most likely candidates to garner interest are:
Raster tiles (or slippy tiles) – such as OpenStreetMap and OpenSeaMap.
Vector tiles (or MVT) – such as Google Maps.
WMTS – Commonly found on PDOK and many other sources
Survey Manager
Active Reference Line (Route)
Make Route Active show KP / Offset
You can now make a route an active reference line and we can then show KP/Offset of the mouse cursor.
Advanced Volumes
Qinsy 9.6.0 offers a new Advanced Volumes option that can safe you many hours on a project figuring out the different type of volumes
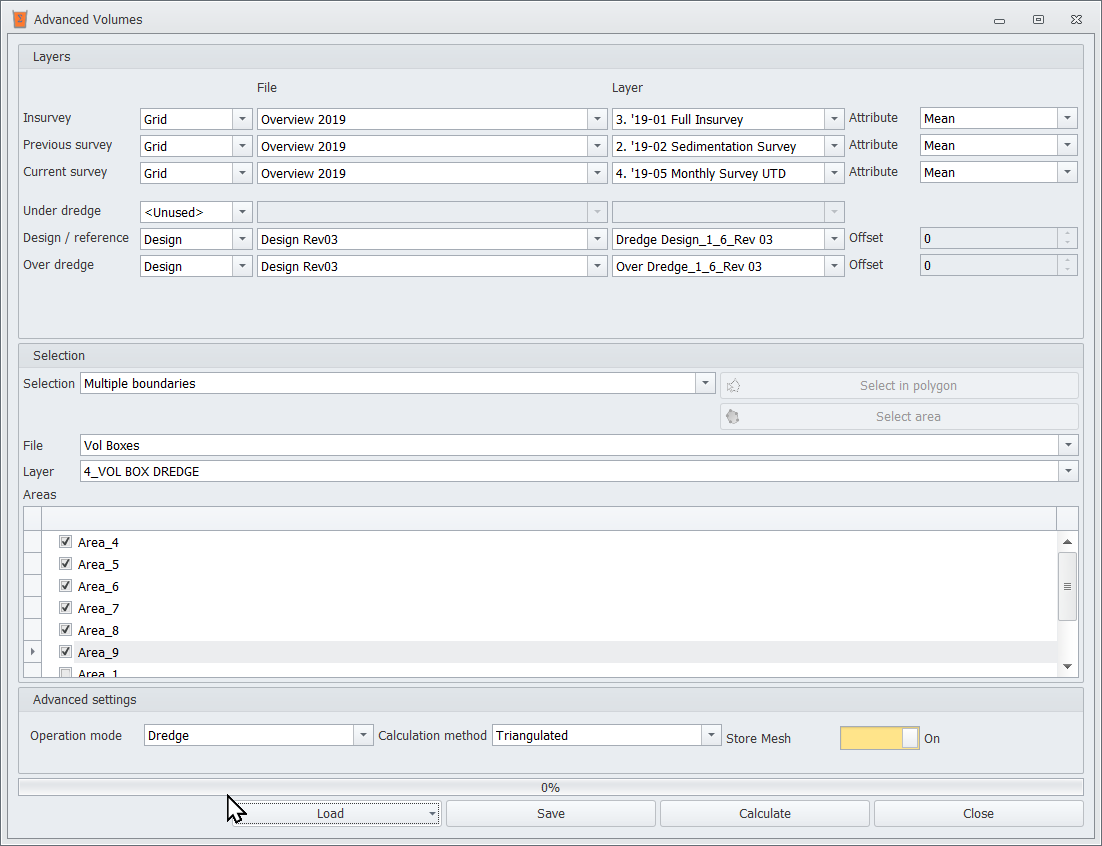
Advanced Volume input form
In the Layers section you can select survey and design layers you want to use in the calculations.
You always need to select a:
“Current survey” layer
“Design / reference”
(this is similar to the Basic Volumes).
All selected layers need to be different, the application does not accept selecting the same grid or design layer for multiple purposes.
Layers | Description | Note |
|---|---|---|
Insurvey | Represents the start of the project. The contractual volumes are determined, using the “insurvey” and “design / reference” layer. | Optional. |
Previous survey | Represents the previous survey. This can be used to measure monthly progress. | Optional. |
Current survey | The current state. This can be an intermediate survey or an out survey. | Mandatory. |
Under dredge | The layer above the design layer, indicating the minimal dredge depth. | Optional. |
Design / reference | The layer containing the designed depths. | Mandatory. |
Over dredge | The layer below the design layer, indicating the maximum dredge depth which will paid. | Optional. |
You can choose to store the created meshes we use for the volume calculations. The meshes (.qgfdes) are stored in the temp folder of your project.
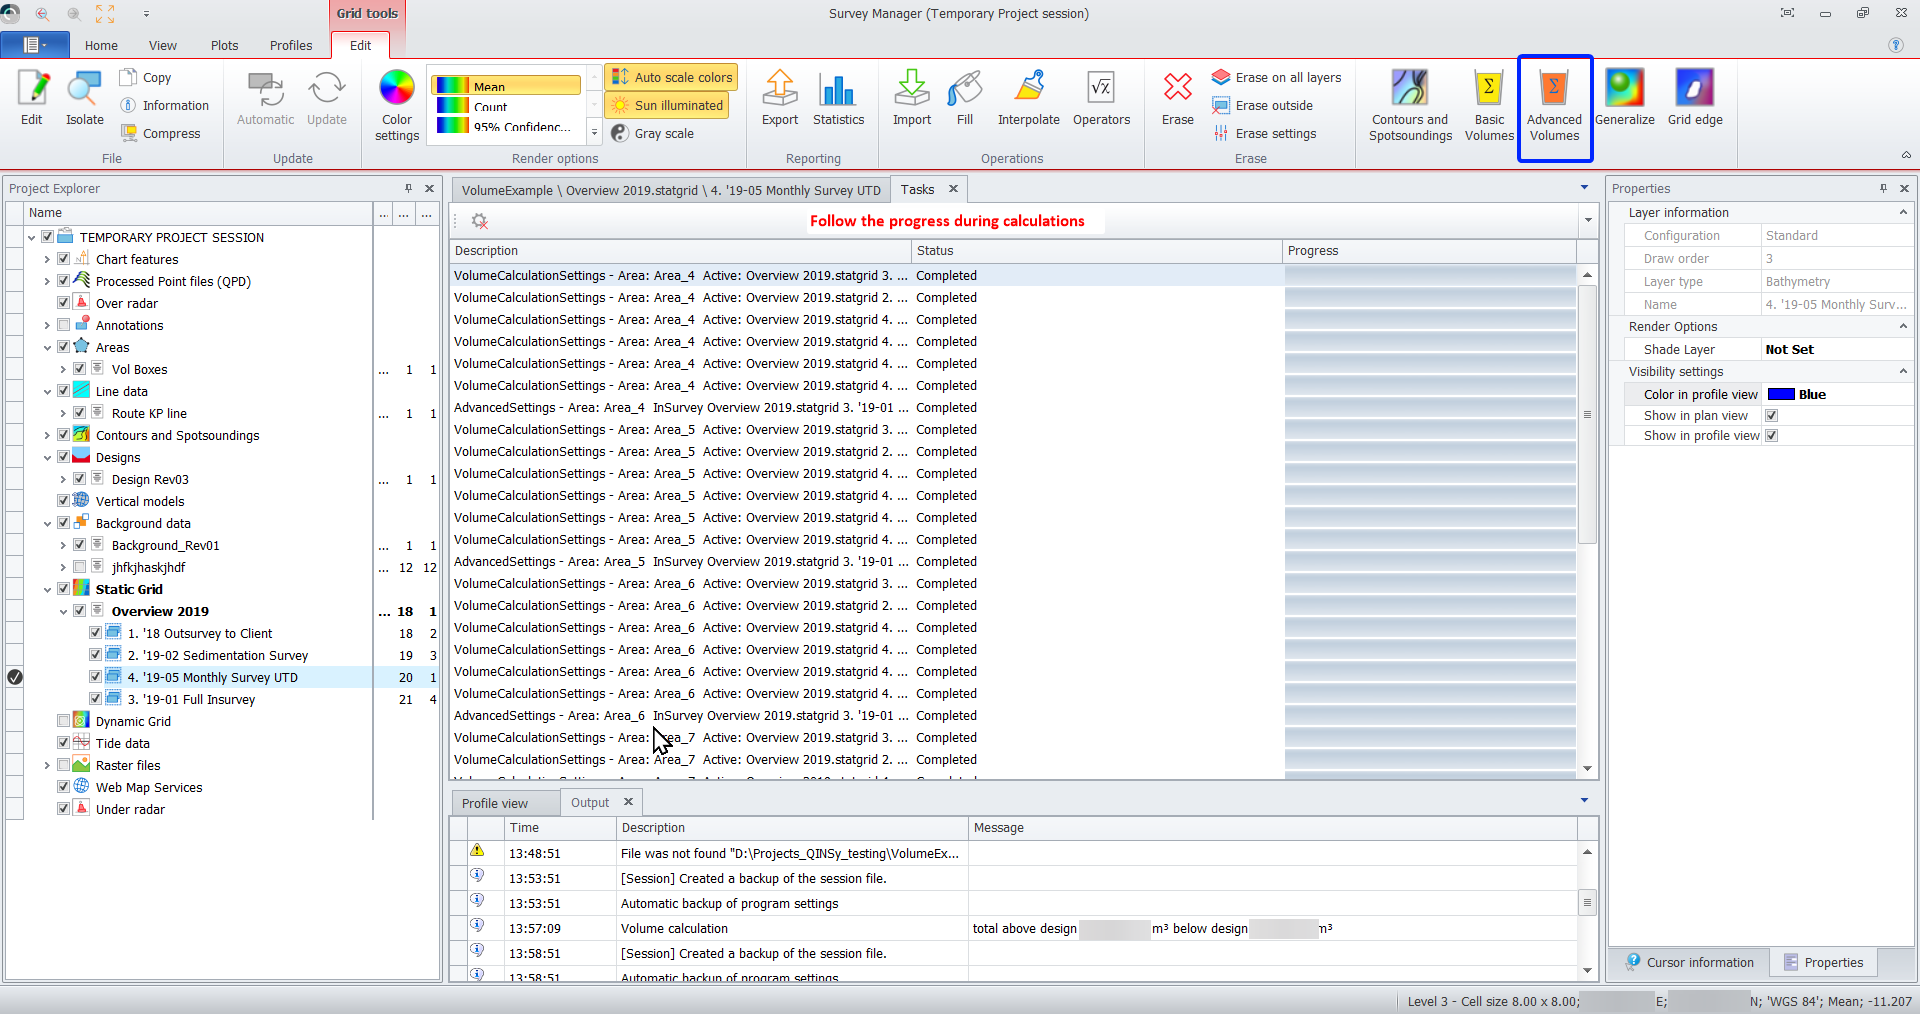
Follow the computations progressing
After the advanced volume calculations are finished, the results are shown in a new dialog.
Depending on layers selected in the Advanced Volume Calculation form, the amount of columns can vary. The columns are grouped.
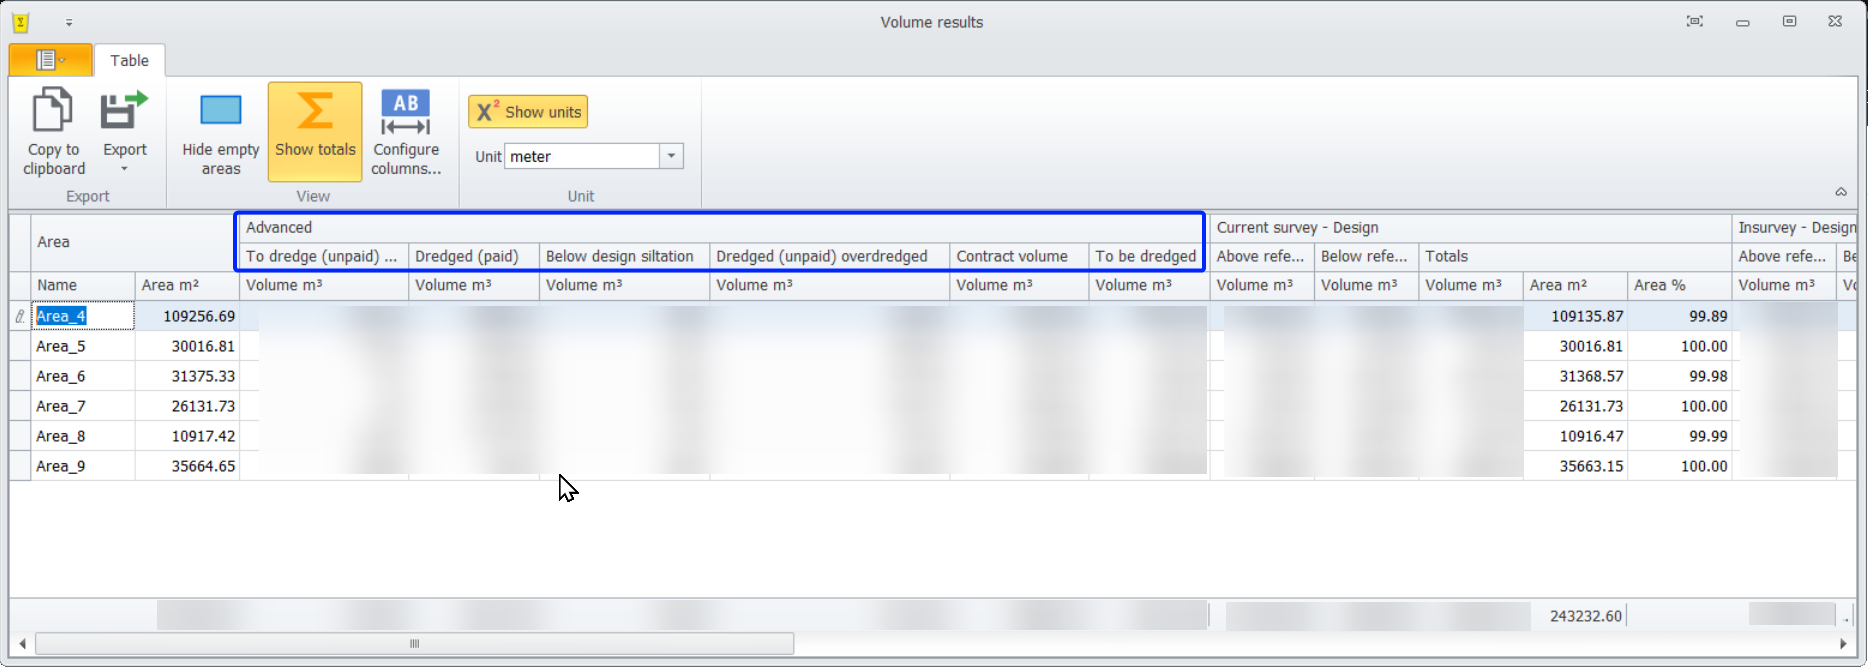
Results Display
All columns and groups can be individually sized, renamed and toggled. The default column names can be changed to fit your language or company specific terminology by using the using the configure columns.
The results can be exported to Excel and other formats
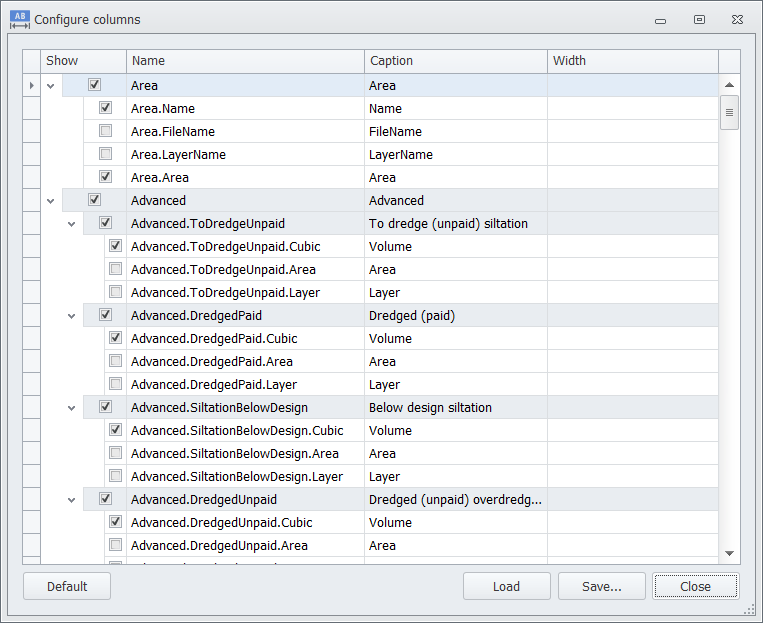
Select and Configure Columns
The column configuration can be saved to an XML file, which is by default stored in the project’s Support folder. This way the column configuration can be distributed to other projects or computers.
Line Planning - Add option to show KP Labels / Flags
Create KP Flags
Plotting
The plotting options have been improved with many new features and allow you to quickly make basic charts and profiles which can be printed and exported to PDF or DXF
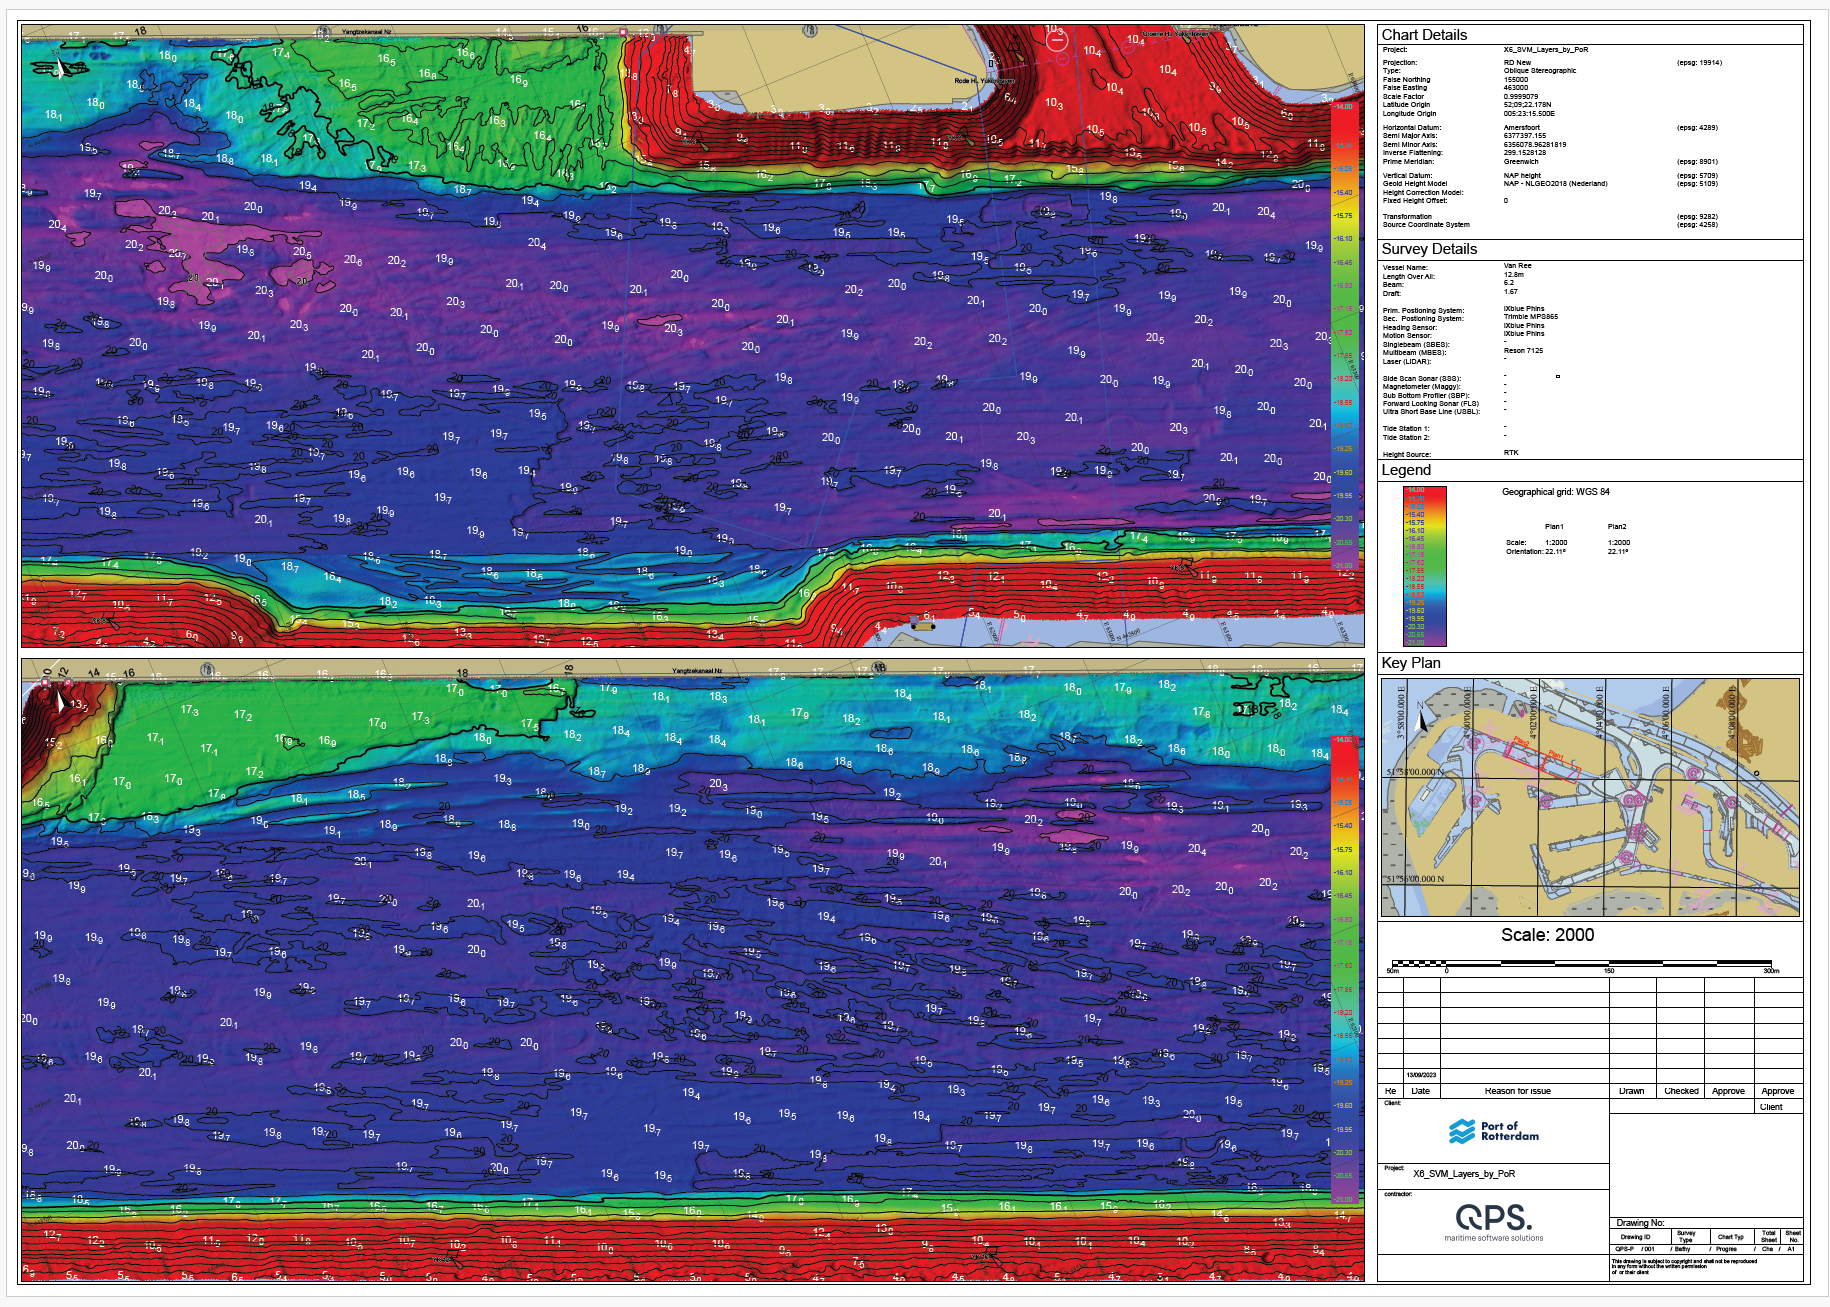
We have added a few templates to Qinsy 9.6.0 to help you on your way. The example above is one of them.
Other examples you can see in the videos below.
Plotting - General
Geographical Grid
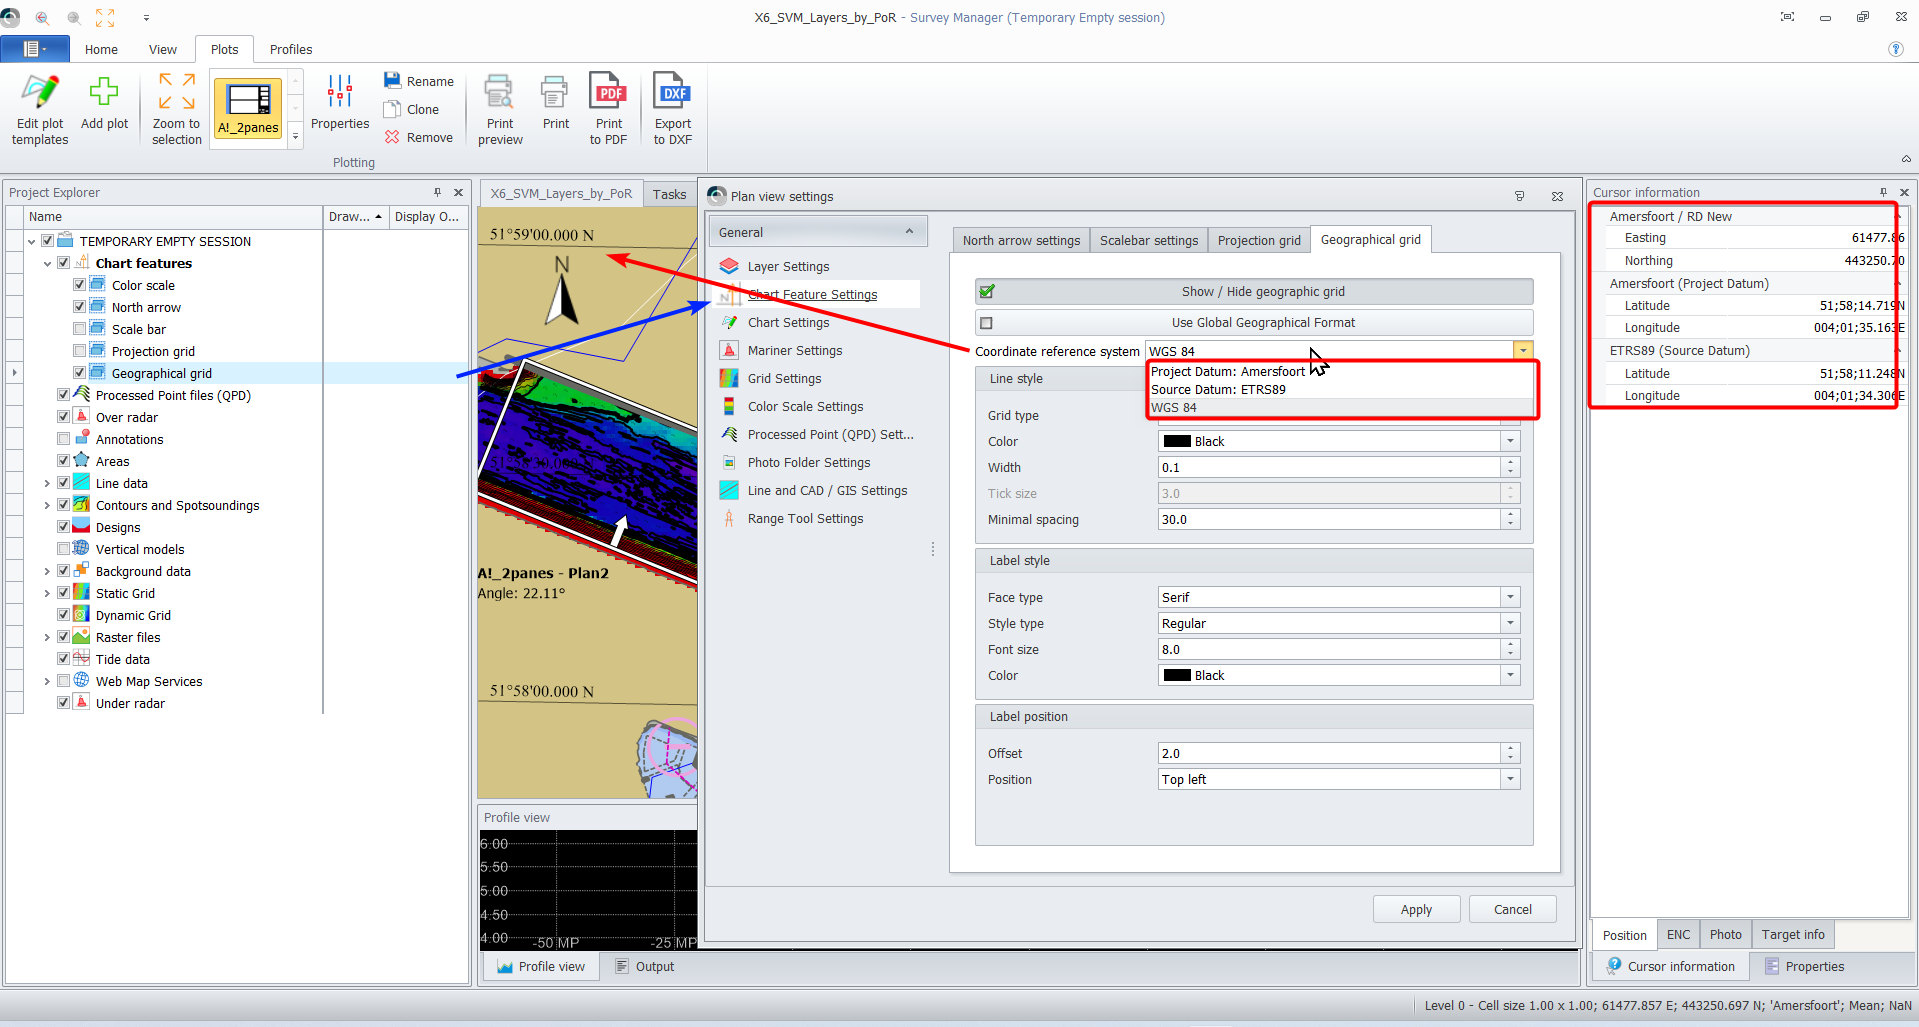
Select Geographical Datum for Geographical Grid
You can now choose the datum you want to use for your Geographical Grid lines/markers
The selection is then also uses for plotting the lines in your charts.
You can choose from:
Project Datum (used for projection)
Source Datum (common GNSS datum in your setup)
WGS84
There is a merge field available that can indicate in your legends what datum was used for the Geographical Grid lines/markers
Plotting - Template Creation
When you create a template (*.qplotini) it is stored under:
<Active Project Folder>\Support
<Common Files Folder>\Support
New Elements
Key Plan
Charts
Plan views of multiple charts
Highlighting the plan views with on the chart
Profiles
Show all the lines the of profiles within that plot series
Highlight the line(s) the of profile(s) on the current page
Image/Logo
Was added for better support of Images than the Rich Text Panel and to allow export to DXF
Basic Text
Was added for better support of text export to DXF than the Rich Text Panel
Merge Fields
This can be used to (auto) populate information in the legends of your profiles and charts.
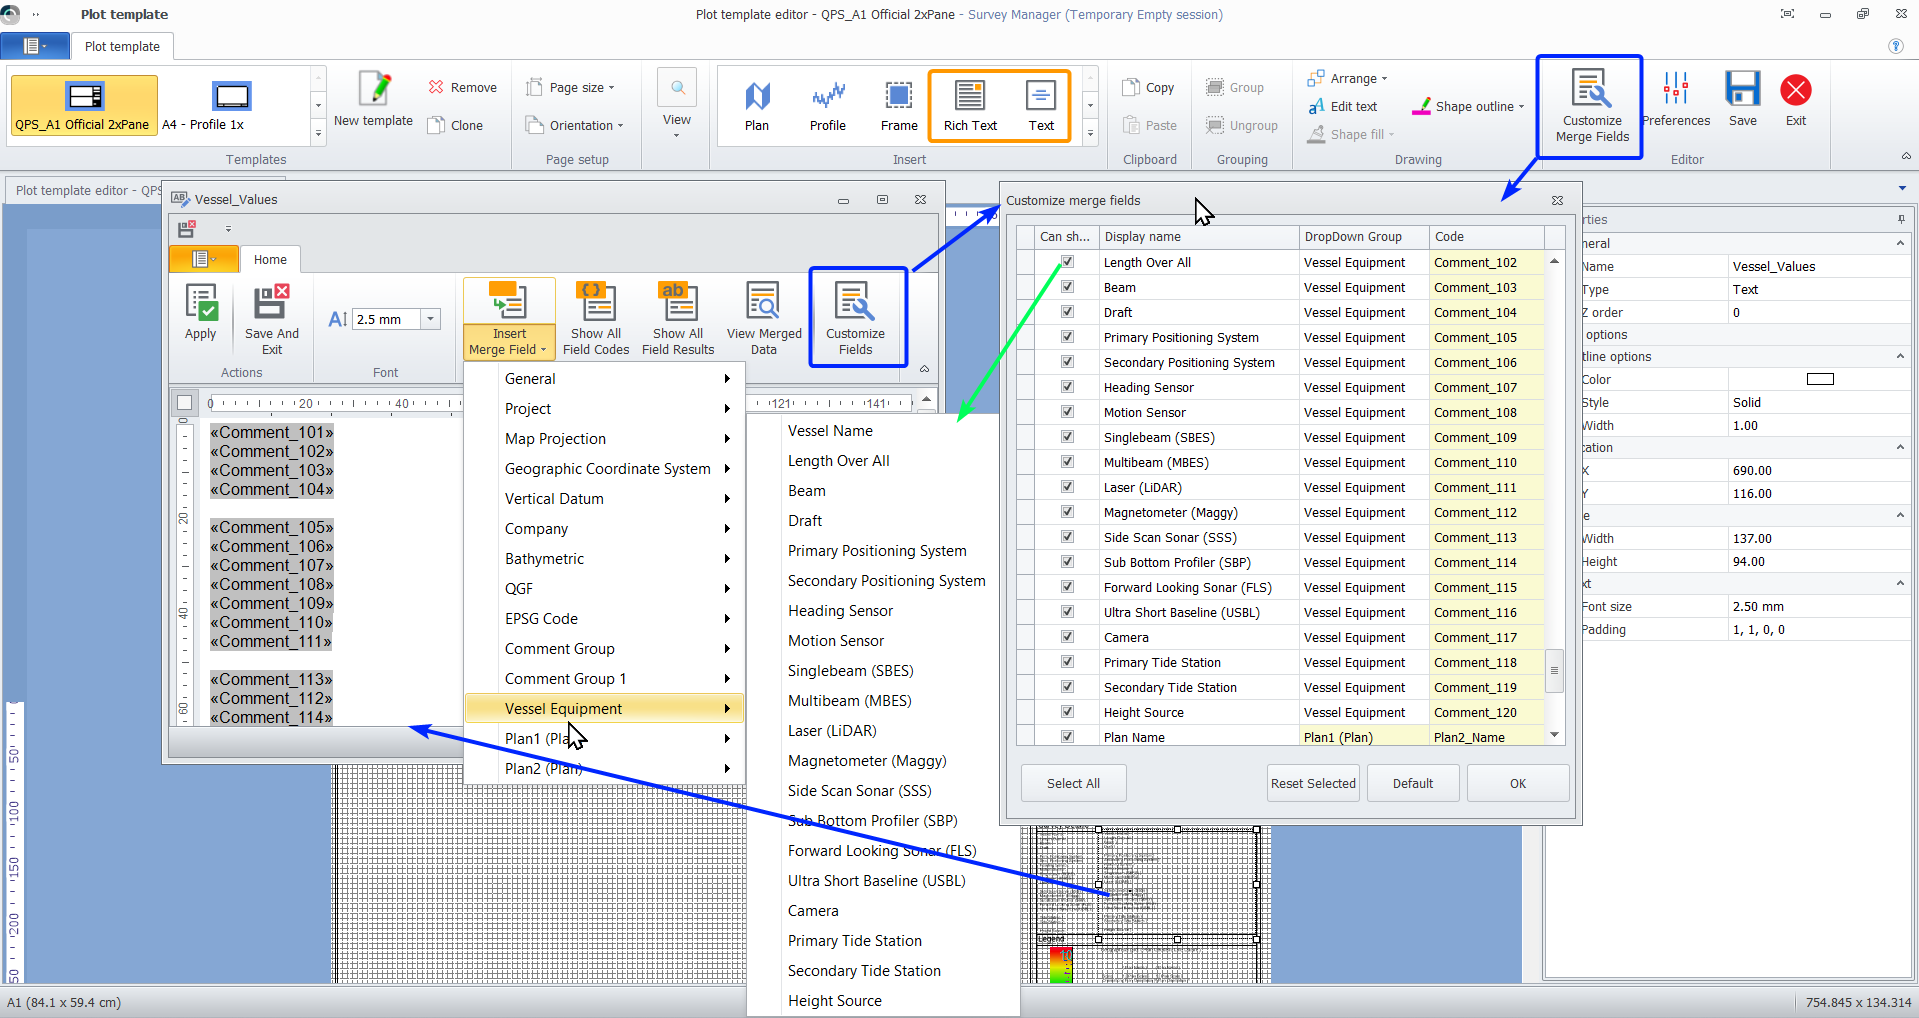
Merge Field in Plot Template Editor
There are a 100 user definable fields and you can add then to user definable groups, with their own group alias.
Example of merge fields setup
There are two main applications for Merge Fields
automatically populate information;
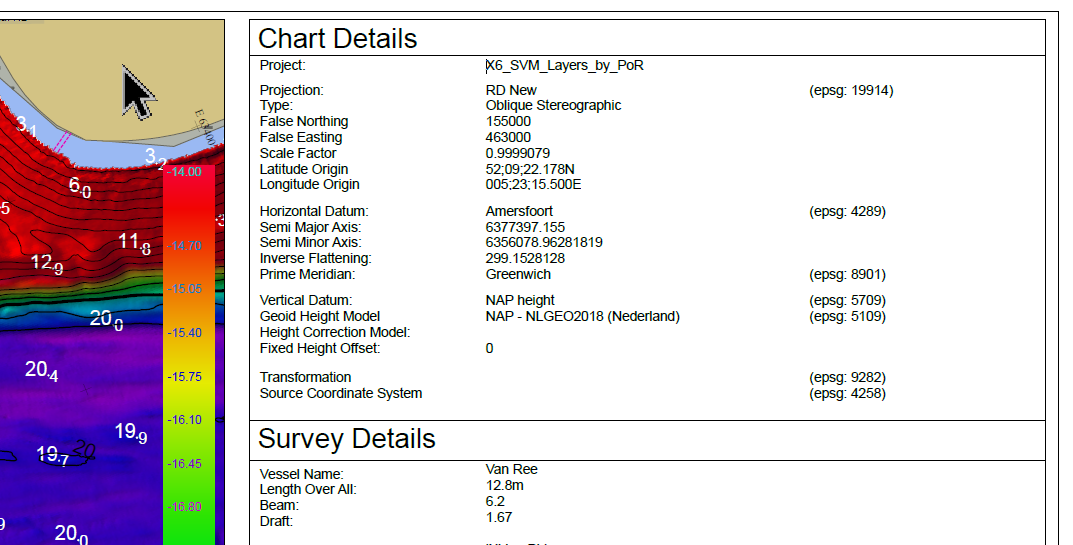
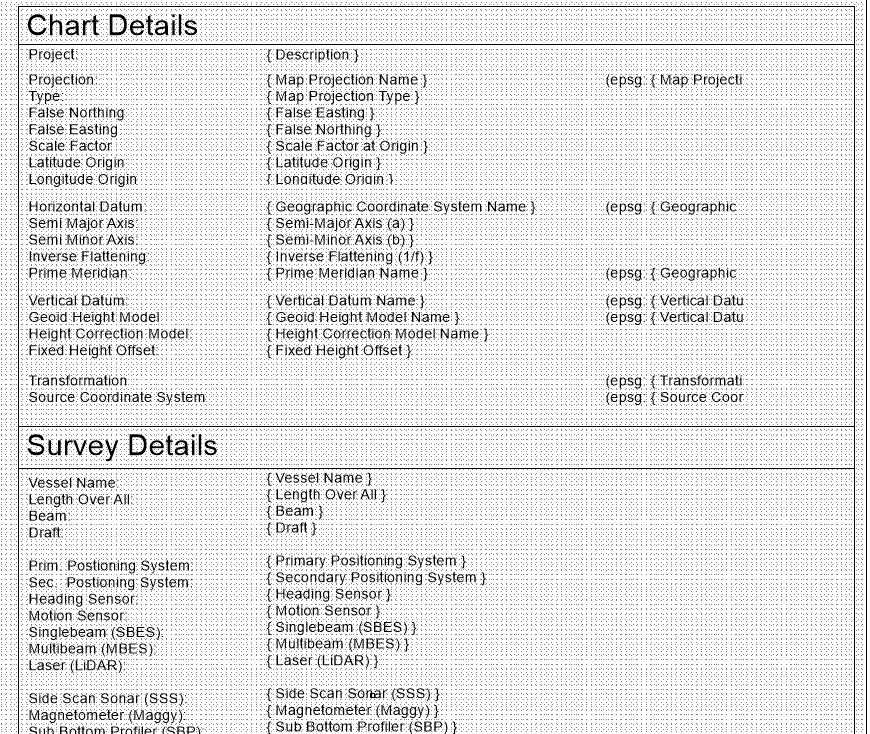
Geodetic Information and EPGS codes automatically populated
Used as an input form
Merge Fields used as input form
Grouping Frames
We added functionality for grouping and ungrouping elements
Plotting - Add Plot to project
When you add a plot to project, a copy of the template with the your entered name will automatically be located into:
<Active Project Folder>\Mapping
<Common Files Folder>\Mapping
That location will also contain two files for each plot:
Plot Template (*.qplotini)
Plot Data Preferences (*.qplotdataini)
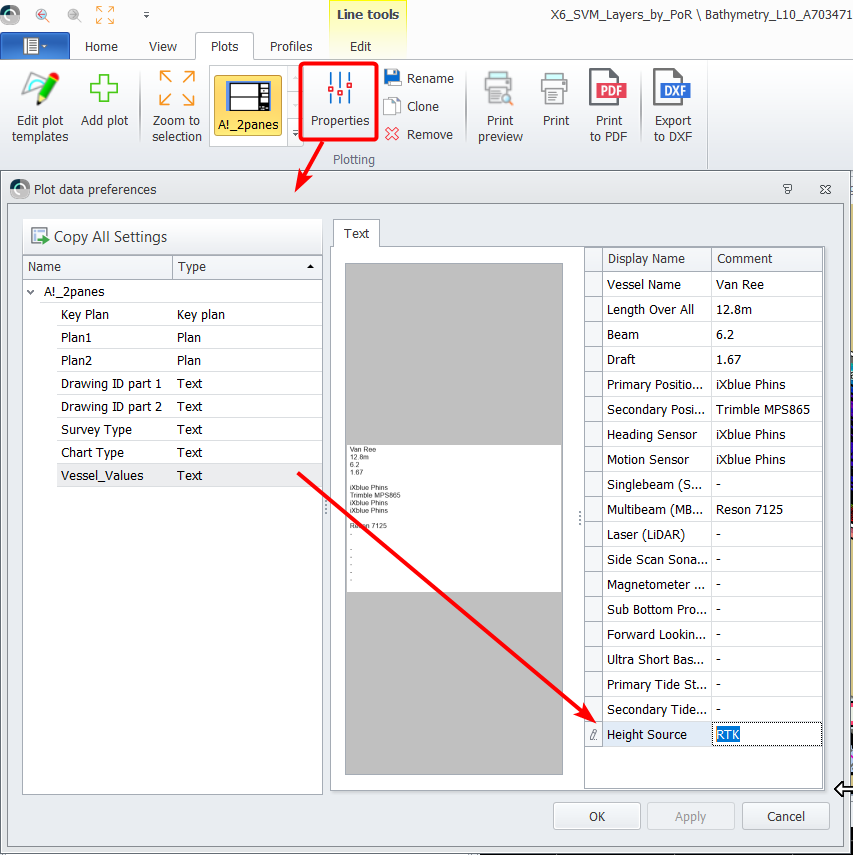
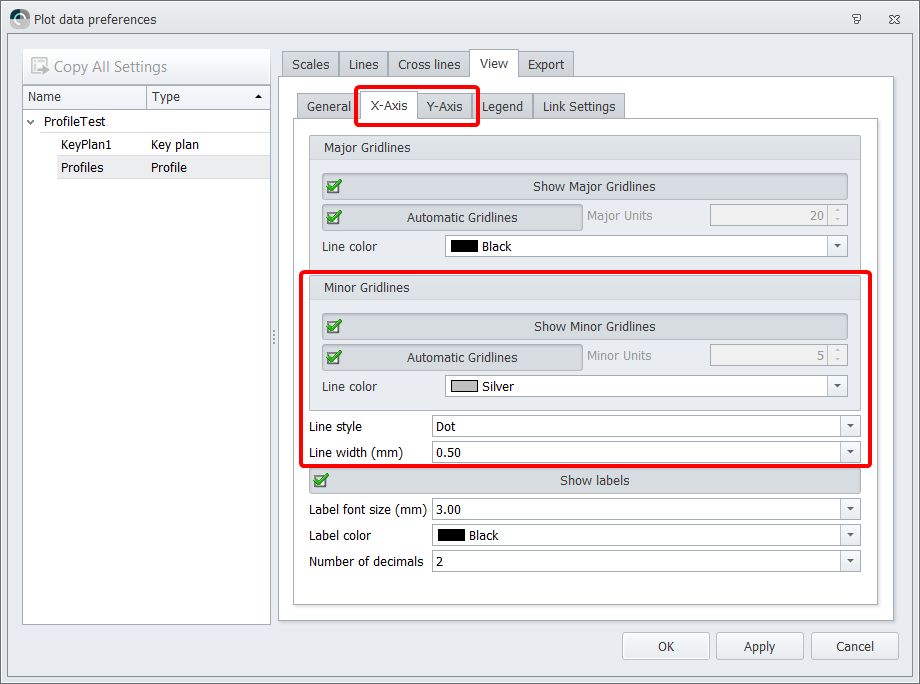
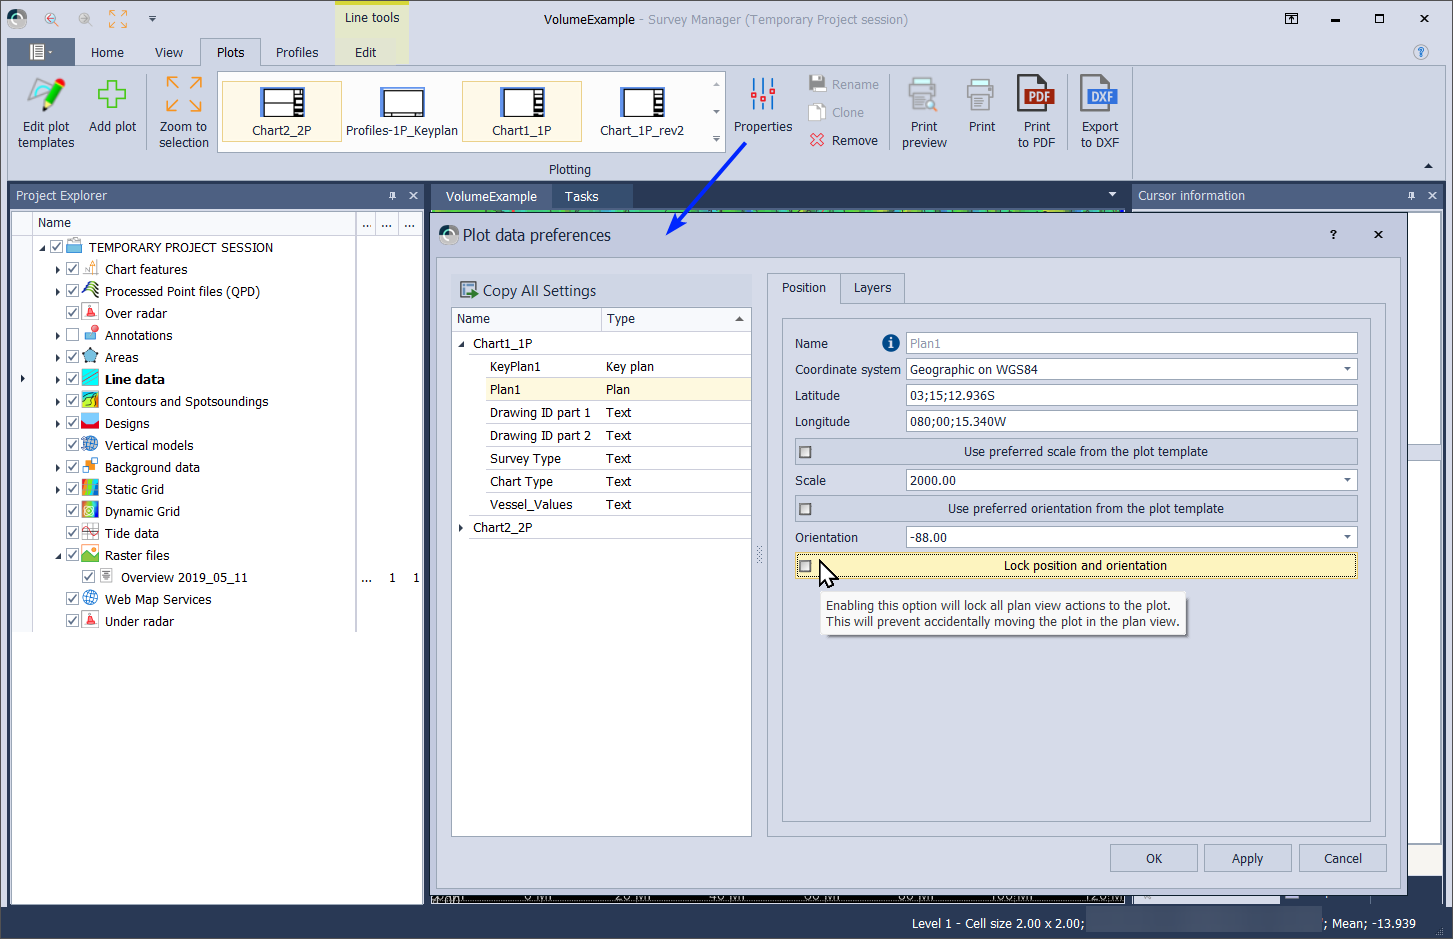
Plotting - Plot Data Preferences
Profiles - Settings for major and minor grid lines
(Key) Plan - Option to lock Position and Orientation
Plotting - Plot to PDF
Chart to PDF
Multiple Charts to 1 PDF
Profiles to PDF
Plotting - Export to DXF
Export Charts to DXF
(multiple view ports)
Chart Template to Paper Space
Scale bar
Colormap
Logo’s
Legend
Text (merge fields)
Multiple View Ports
Key Plan View Port
Profiles
Data to model space
CAD/Vector (QGF)
Line Planning (qgfline)
Contours and Spotsoundings (qgfcont)
Background
Design
GeoTiff (Static Grids)
QPD Survey Data
Option to auto generate profile naming
WMS support
We added support to add WMS layers which can be added by simply Drag and drop a WMS link from your web browser:
WMS - Drag and Drop GEBCO
https://www.gebco.net/data_and_products/gebco_web_services/web_map_service/previous_wms.html#gebco_2021_wms
https://www.gebco.net/data_and_products/gebco_web_services/2021/mapserv?request=getcapabilities&service=wms&version=1.3.0
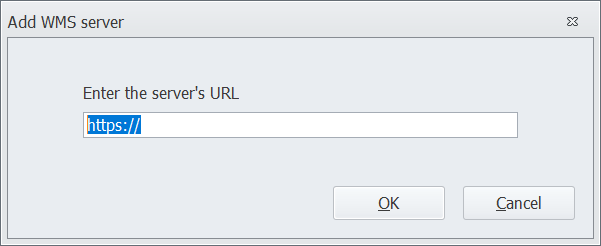
Or right-click the category and select “New” to manually enter the URL.
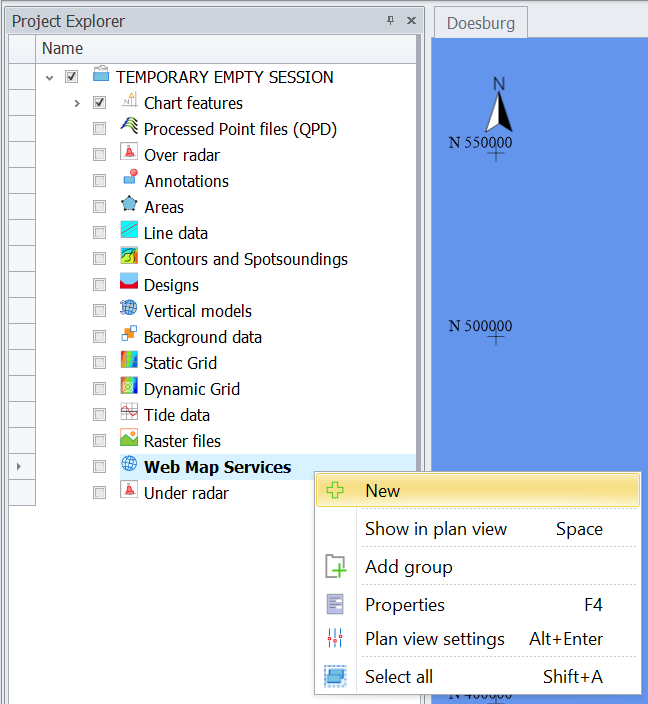
Another type of online map service is WMTS. This type is currently not supported in the Survey Manager.
When adding a new service, one of the first things the application asks for is a list of supported projections. If none of them is a good match for your current project, you will be asked to choose one:
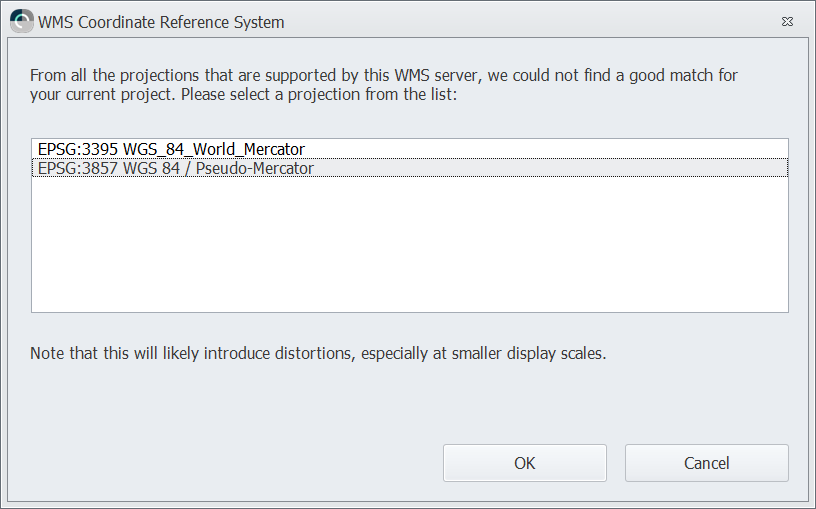
All options will compromise the map display in one way or another, so be aware that some distortion will be introduced.
Another example:
WMS - Drag and Drop
Try it yourself by creating a project with these geodetic Settings:
Just drag and drop the following links:
Drone no-fly zones
https://service.pdok.nl/lvnl/drone-no-flyzones/wms/v1_0?request=GetCapabilities&service=WMSRD-Info WMS
https://service.pdok.nl/kadaster/rdinfo/wms/v1_0?request=getcapabilities&service=WMSBRO Geomorphological Map (GMM) WMS
https://service.pdok.nl/bzk/bro-geomorfologischekaart/wms/v2_0?request=getcapabilities&service=WMS
Session
Now creates an auto recovery session and offers you to alter the Autosave interval
Static Grids - Create layers with TVU / THU / SV / Intensity / Quality
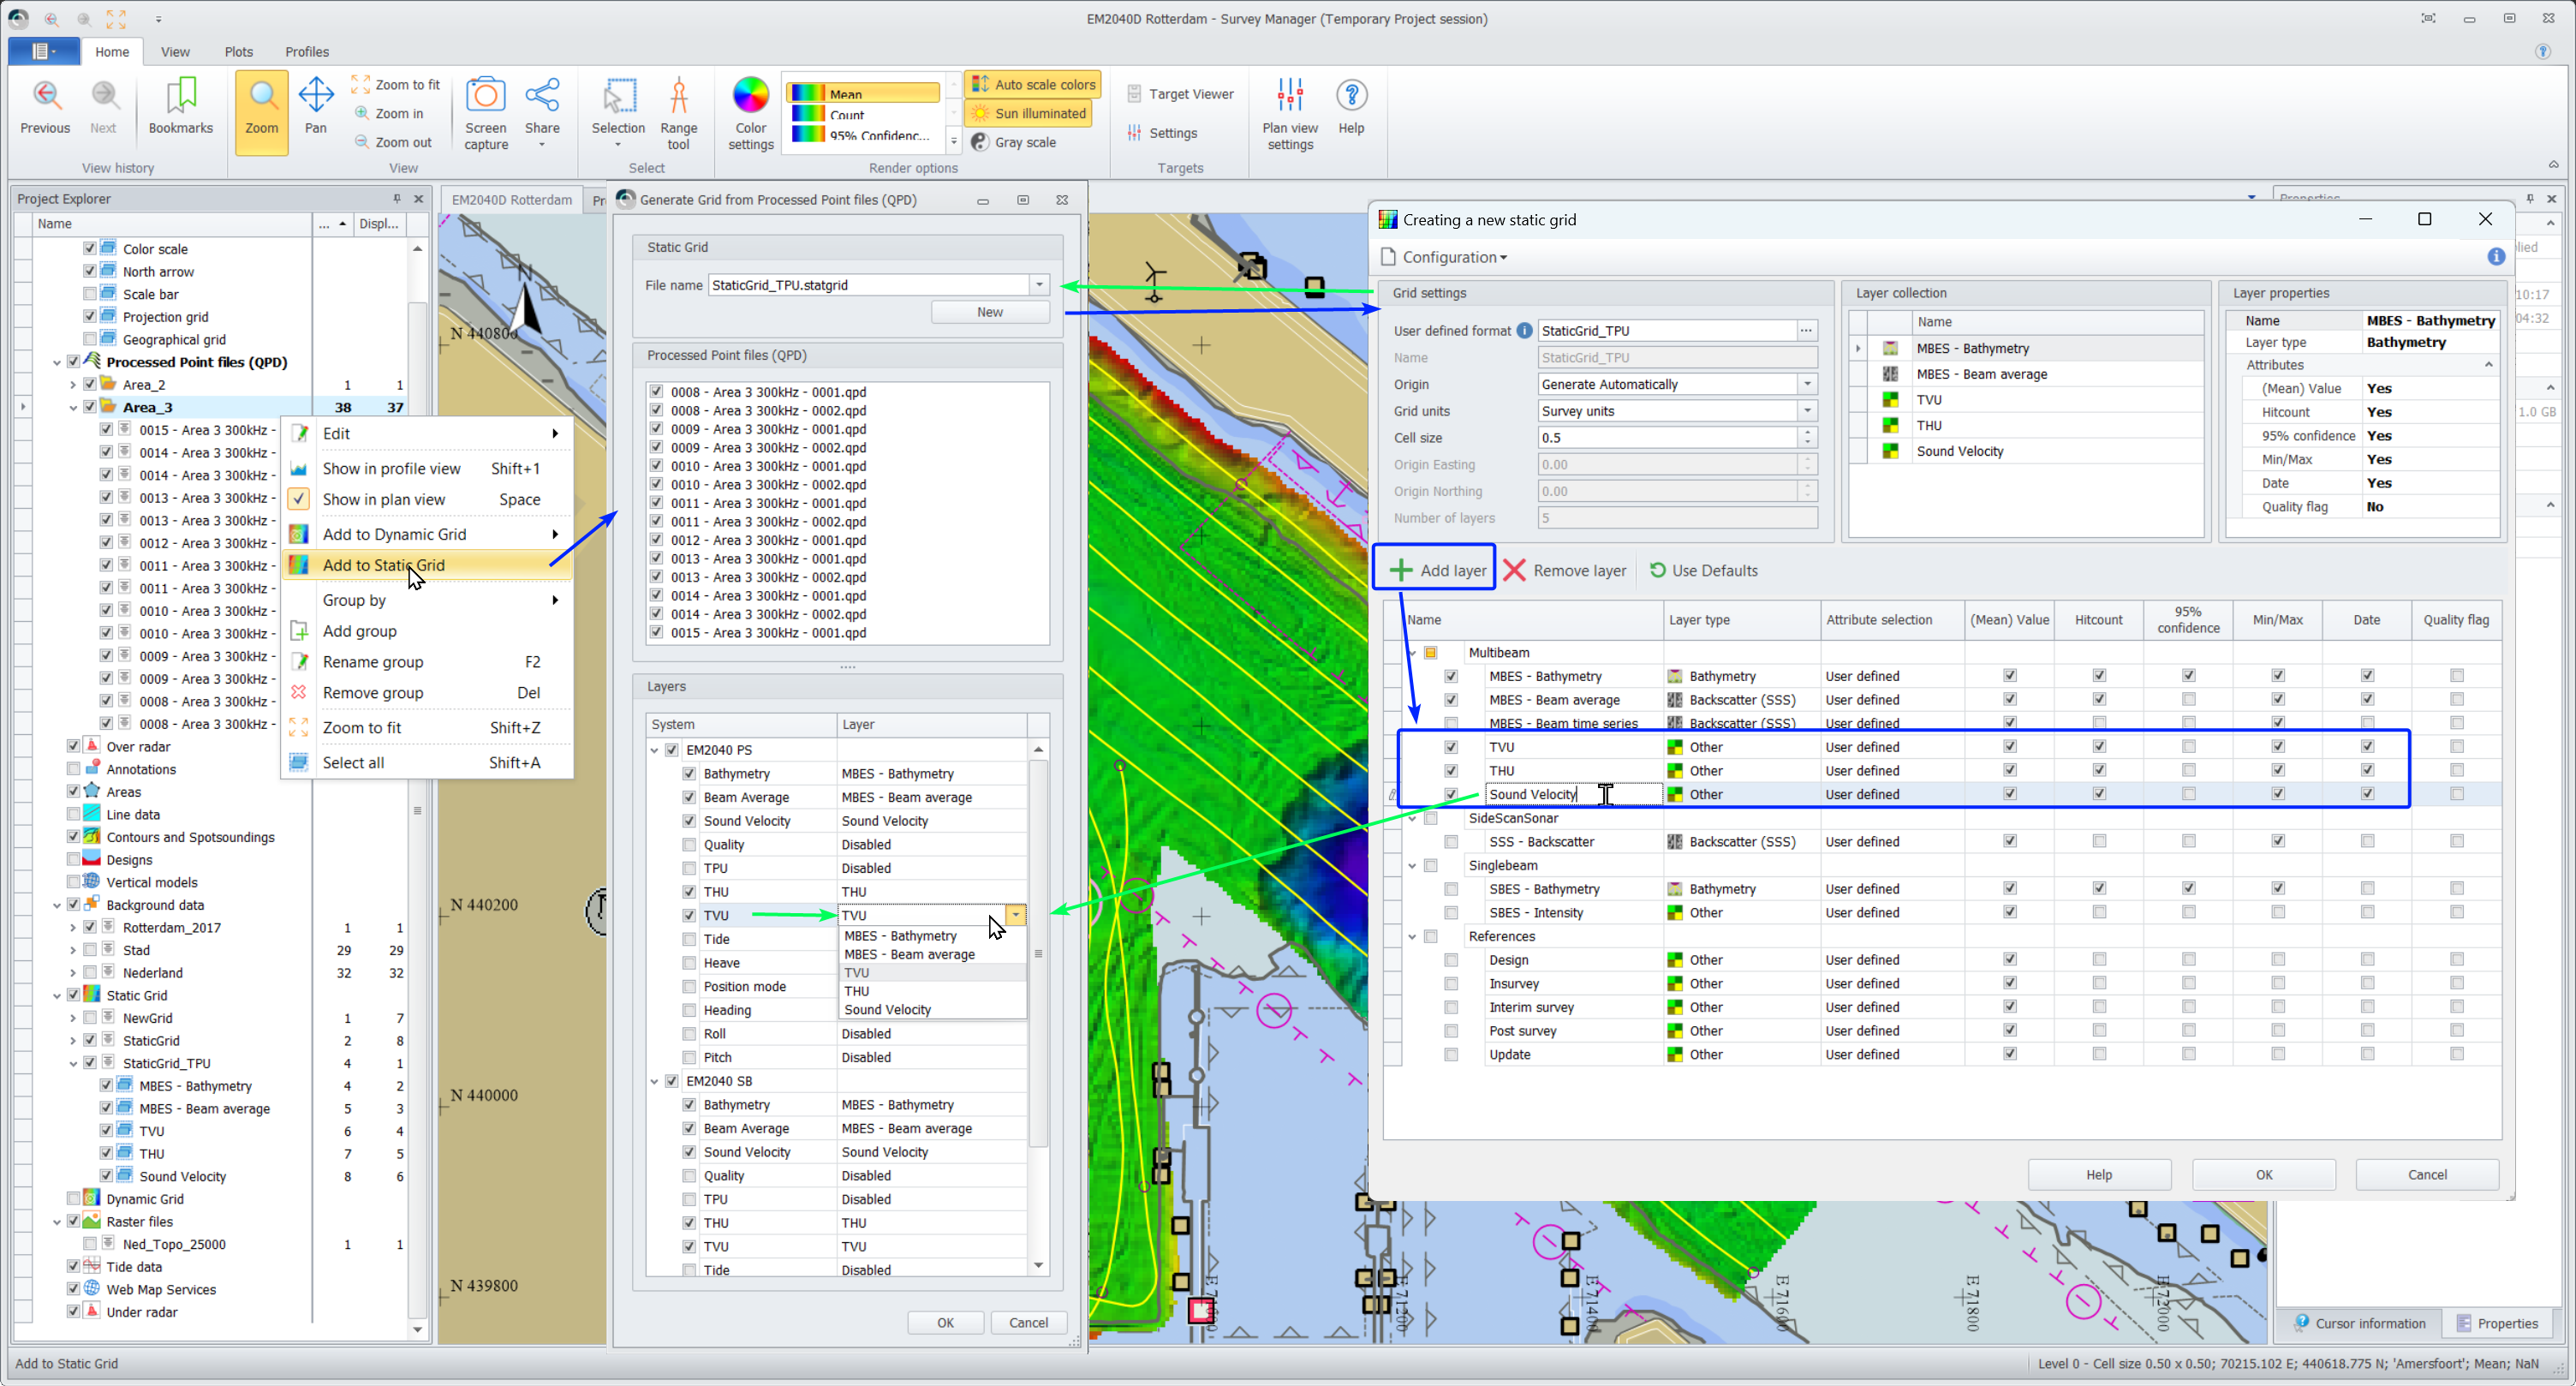
Static Grid - Add TVU, THU and SV attributes from QPD
QPD - Add to Static Grid
We made is possible add more items from the QPD into a Static Grid:
Bathymetry / Backscatter / Magnitude (was already possible)
Beam Average or Intensity
Not available for Magnetometer systems.
Sound Velocity
Not available for Magnetometer systems.
Quality
Also used with Laser systems
TPU
THU
TVU
Tide
Heave
Position mode
Heading
Roll
Pitch
Side-scan sonar systems are not supported in this dialog, please Generate a Sidescan Mosaic if you wish to export side-scan sonar systems.
New Grid (layer configuration)
The first when you create a new grid you need to add the layers you would like to fill with data from the QPD’s. Please use the name of the attributes as layer name. The layer configuration and settings will be save and the next time you create a new grid in the Survey Manager or Online in the Session Setup, the layers will already be available and selected with their activated attributes.
Layers
If you already you already modified your Static Grid layer configuration you can skip the step above.
Select your Static Grid and directly start, in the bottom panel, to select the items you would like to add on layers from each system.
When enabling items to add, it will automatically try to select the best matching layer. For example, Bathymetry was enabled and MBES - Bathymetry was automatically selected because it was the best match in the found layers of the grid. The found match must also be at least 75% similar or the layer will remain Disabled. In that case you can manually select the layer from the drop down list.