Description
Driver to decode data from the Nortek Signature VM system.
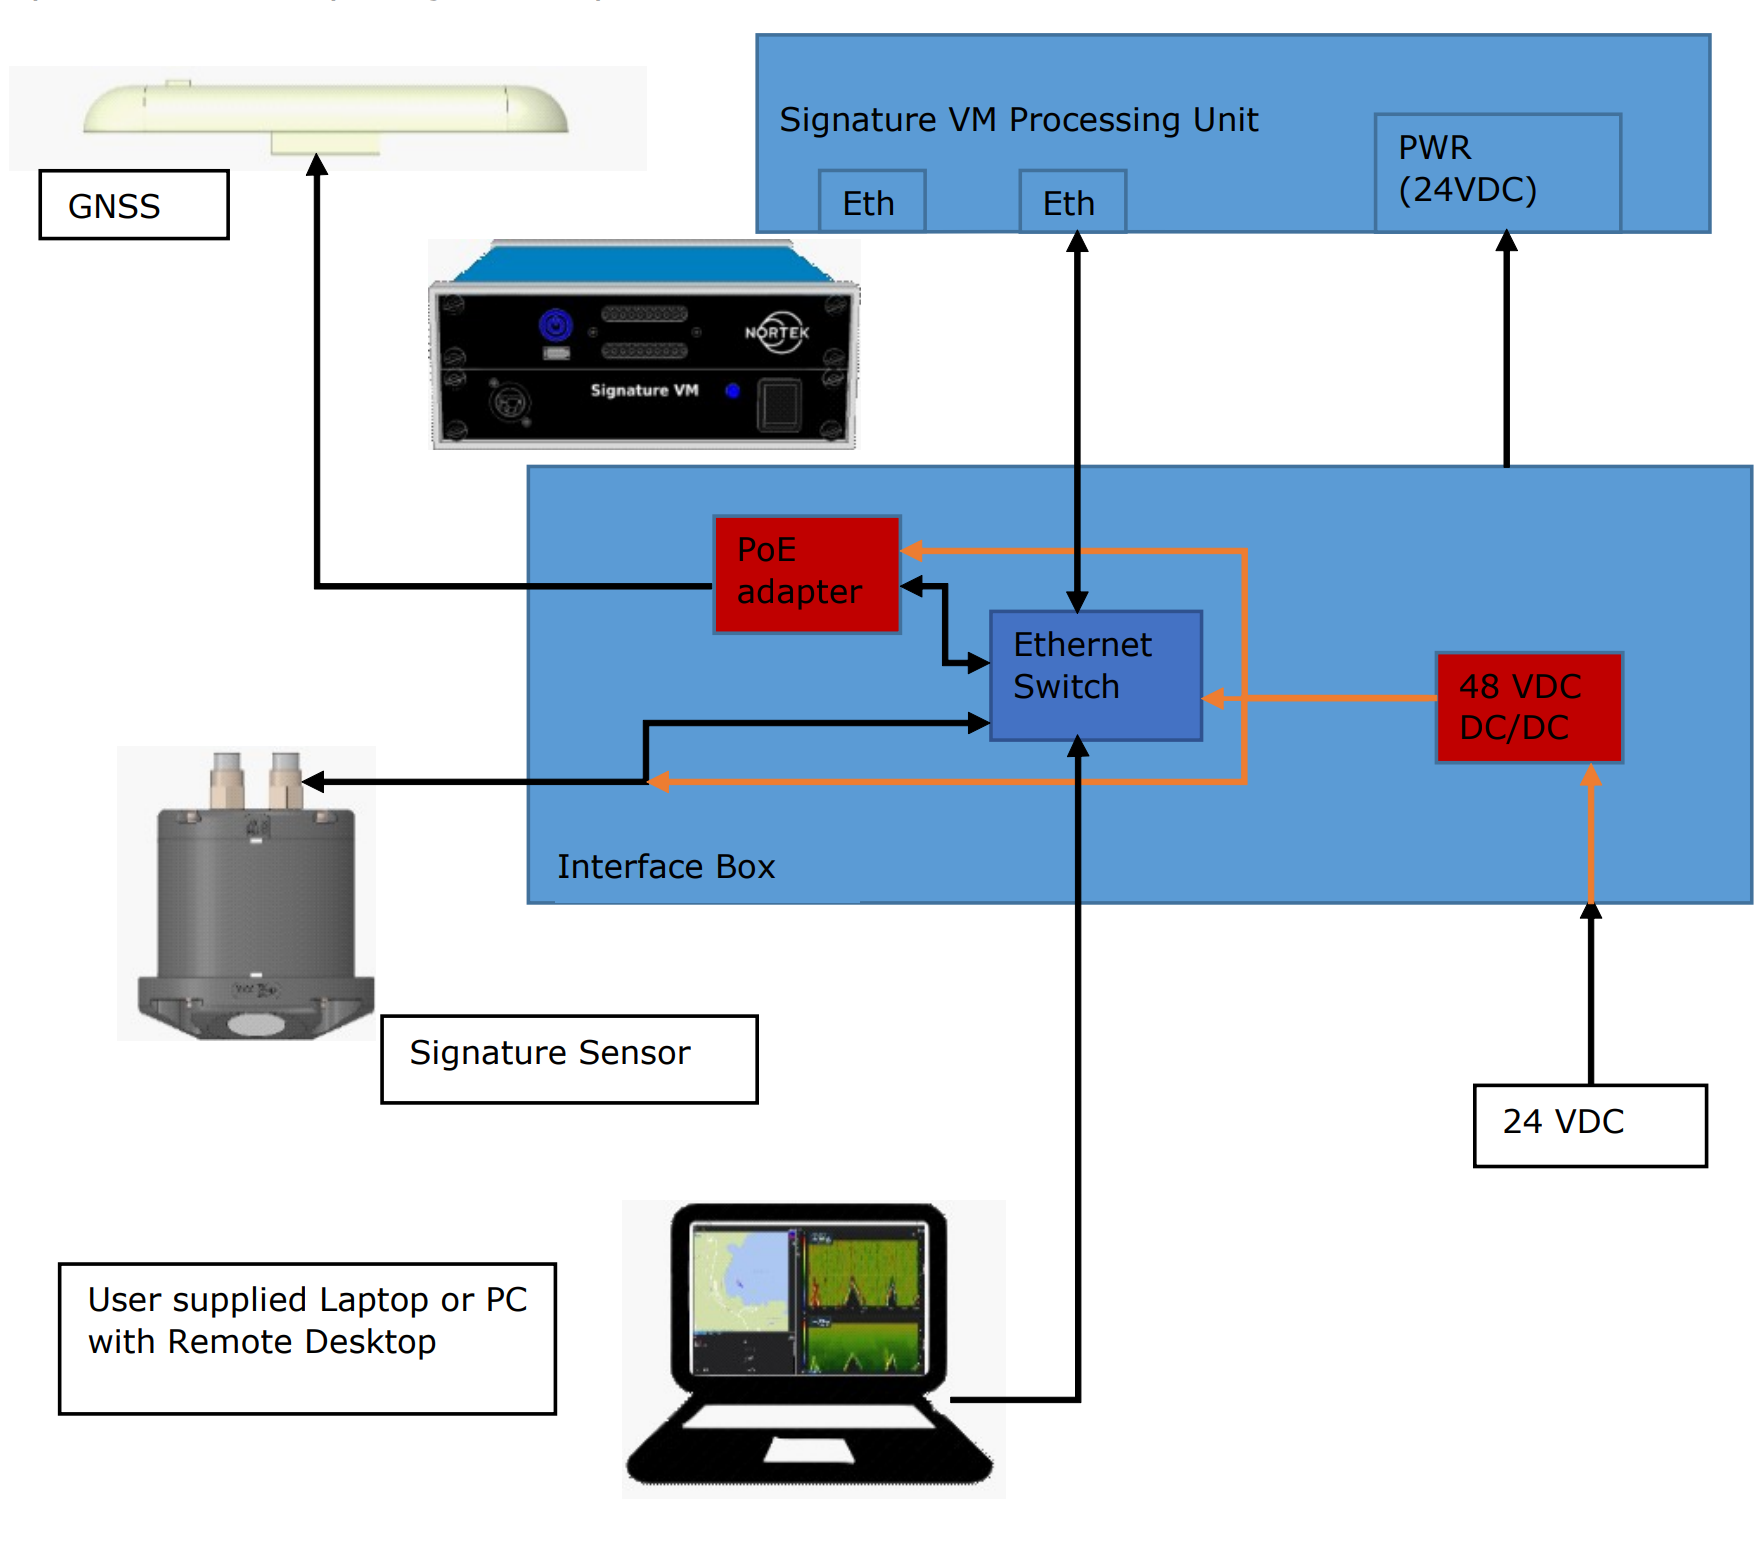
The system consists of a GNSS, a Signature series ADCP sensor (e.g. VM Operations (333 kHz), Signature1000 or Signature55) and dedicated computer with the Signature VM software.
Driver Information
Click to expand...
|
Interface type |
Serial |
|---|---|
|
Yes and No |
|
|
Input / output |
Input |
|
Related Systems |
|
|
Related Pages |
|
Decoding Notes
System Setup
Qinsy Database Setup
Click to expand...
In the Qinsy Database Setup program, the following systems and observations can be created for this driver:
-
Miscellaneous Systems
-
Acoustic Doppler Current Profiler
For all drivers the following applies:
-
When using the driver with '(UTC)' in the name, the time as found in the message will be used.
-
If the driver is selected without '(UTC)' in the name the time of arrival in Qinsy will be used.
-
All drivers should use either with or without '(UTC)'. They should not be mixed.
Miscellaneous System
The driver is capable of decoding a number of miscellaneous observations from the input message.
In order to decode any of these miscellaneous observations:
-
Add a Miscellaneous System to your template and select the driver "Nortek Signature VM".
-
Select the appropriate serial port.
-
Set the appropriate serial port parameter. Instrument defaults are 9600 baud, 8 data bits, 1 stop bit and no parity.
-
Select the appropriate value for the 'Slot 1' field.
Available are:
|
Slot 1 |
Observation |
|---|---|
|
VALIDCELLS |
Number of valid cells |
|
ERRORCODE |
Error code |
|
STATUSCODE |
Status code |
|
POSITION |
Position quality indicator |
|
HEADING |
Heading quality indicator |
|
SOG |
Speed over ground quality indicator |
|
TIME |
Time quality indicator |
|
HPR |
Heading Pitch Roll quality indicator |
|
BOTTOM |
Bottom track quality indicator |
|
VELOCITY |
Burst velocity quality indicator |
|
ECHO |
Echosounder quality indicator |
|
AMPLITUDE1 |
Average amplitude beam 1 |
|
AMPLITUDE2 |
Average amplitude beam 2 |
|
AMPLITUDE3 |
Average amplitude beam 3 |
|
AMPLITUDE4 |
Average amplitude beam 4 |
|
CORR_1 |
Average correlation beam 1 |
|
CORR_2 |
Average correlation beam 2 |
|
CORR_3 |
Average correlation beam 3 |
|
CORR_4 |
Average correlation beam 4 |
|
FOM_1 |
Figure of merit beam 1 |
|
FOM_2 |
Figure of merit beam 2 |
|
FOM_3 |
Figure of merit beam 3 |
|
FOM_4 |
Figure of merit beam 4 |
|
HDG_TRUE |
True north heading |
|
HDG_MAG |
Magnetic north heading |
|
SPEED |
Speed |
Acoustic Doppler Current Profiler
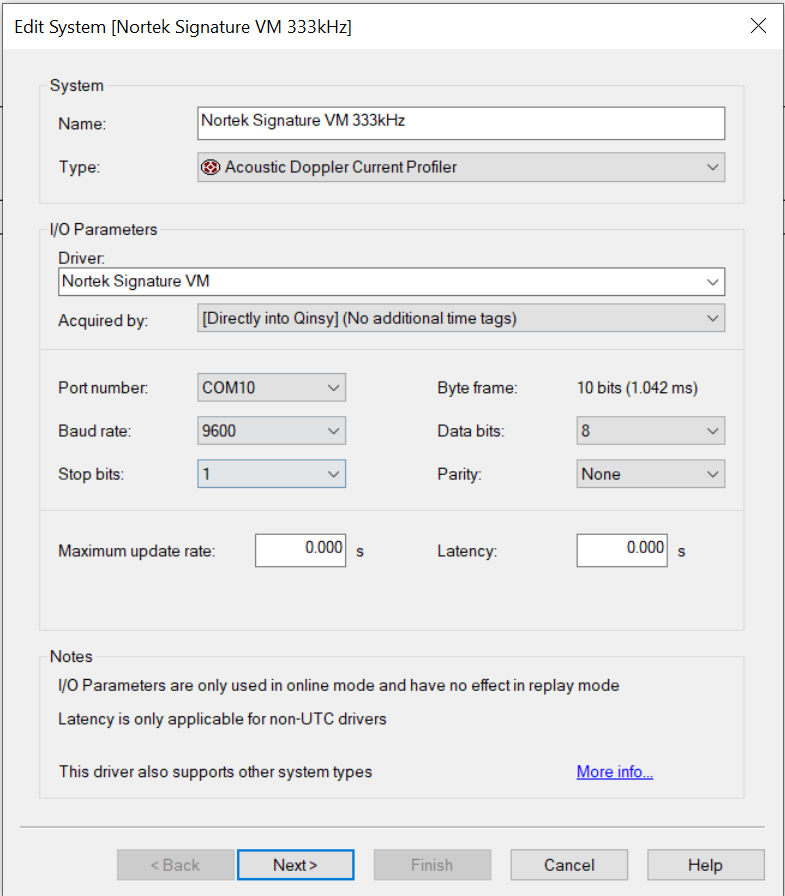
To interface the Nortek Signature VM with Qinsy:
-
Select system type: Acoustic Doppler Current Profiler
-
Driver: "Nortek Signature VM"
Select the location at which the ADCP is mounted:
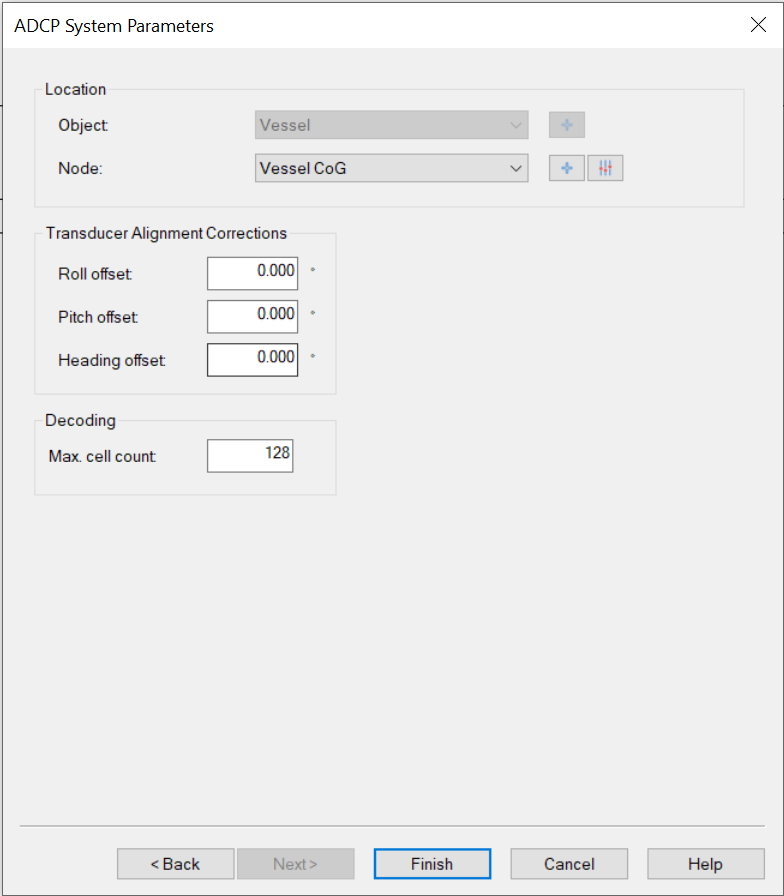
Set the 'Max. cell count' to 128 as this is the maximum number of cells supported by the system.
Roll, Pitch and Heading offsets do not matter, since the data transmitted by the Nortek Signature VM is already in world coordinates, and therefore the offsets will be ignored.
Qinsy Online
Click to expand...
Displays
The ADCP data can be shown in a number of displays
-
Navigation Display
-
ADCP Display
-
Observation Physics
-
Generic Display
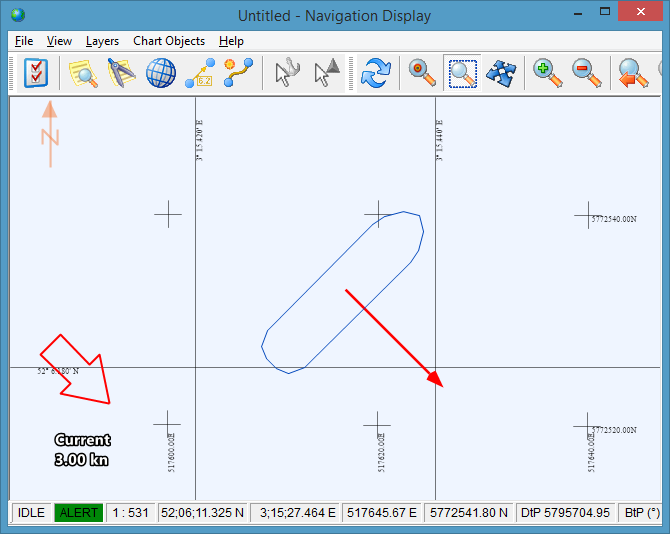
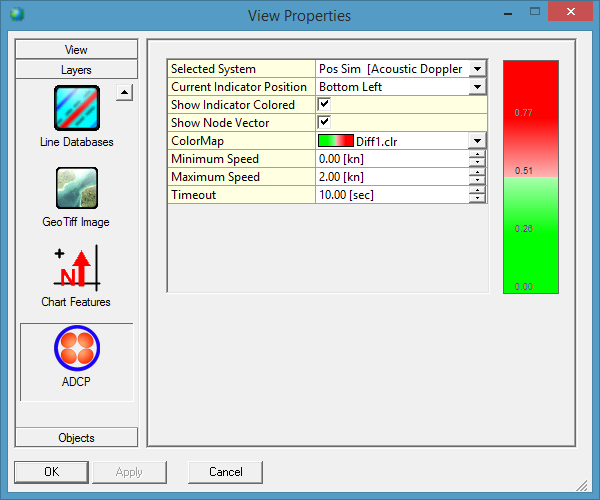
Navigation Display
In the Navigation display the average speed and direction of the current can be visualized, using vectors and a text markup.
The values are corrected for vessel attitude:
-
The arrows show the direction of the current with text markup indicating the speed.
-
These settings are accessible and can be adjusted via the View Properties of the Navigation display.
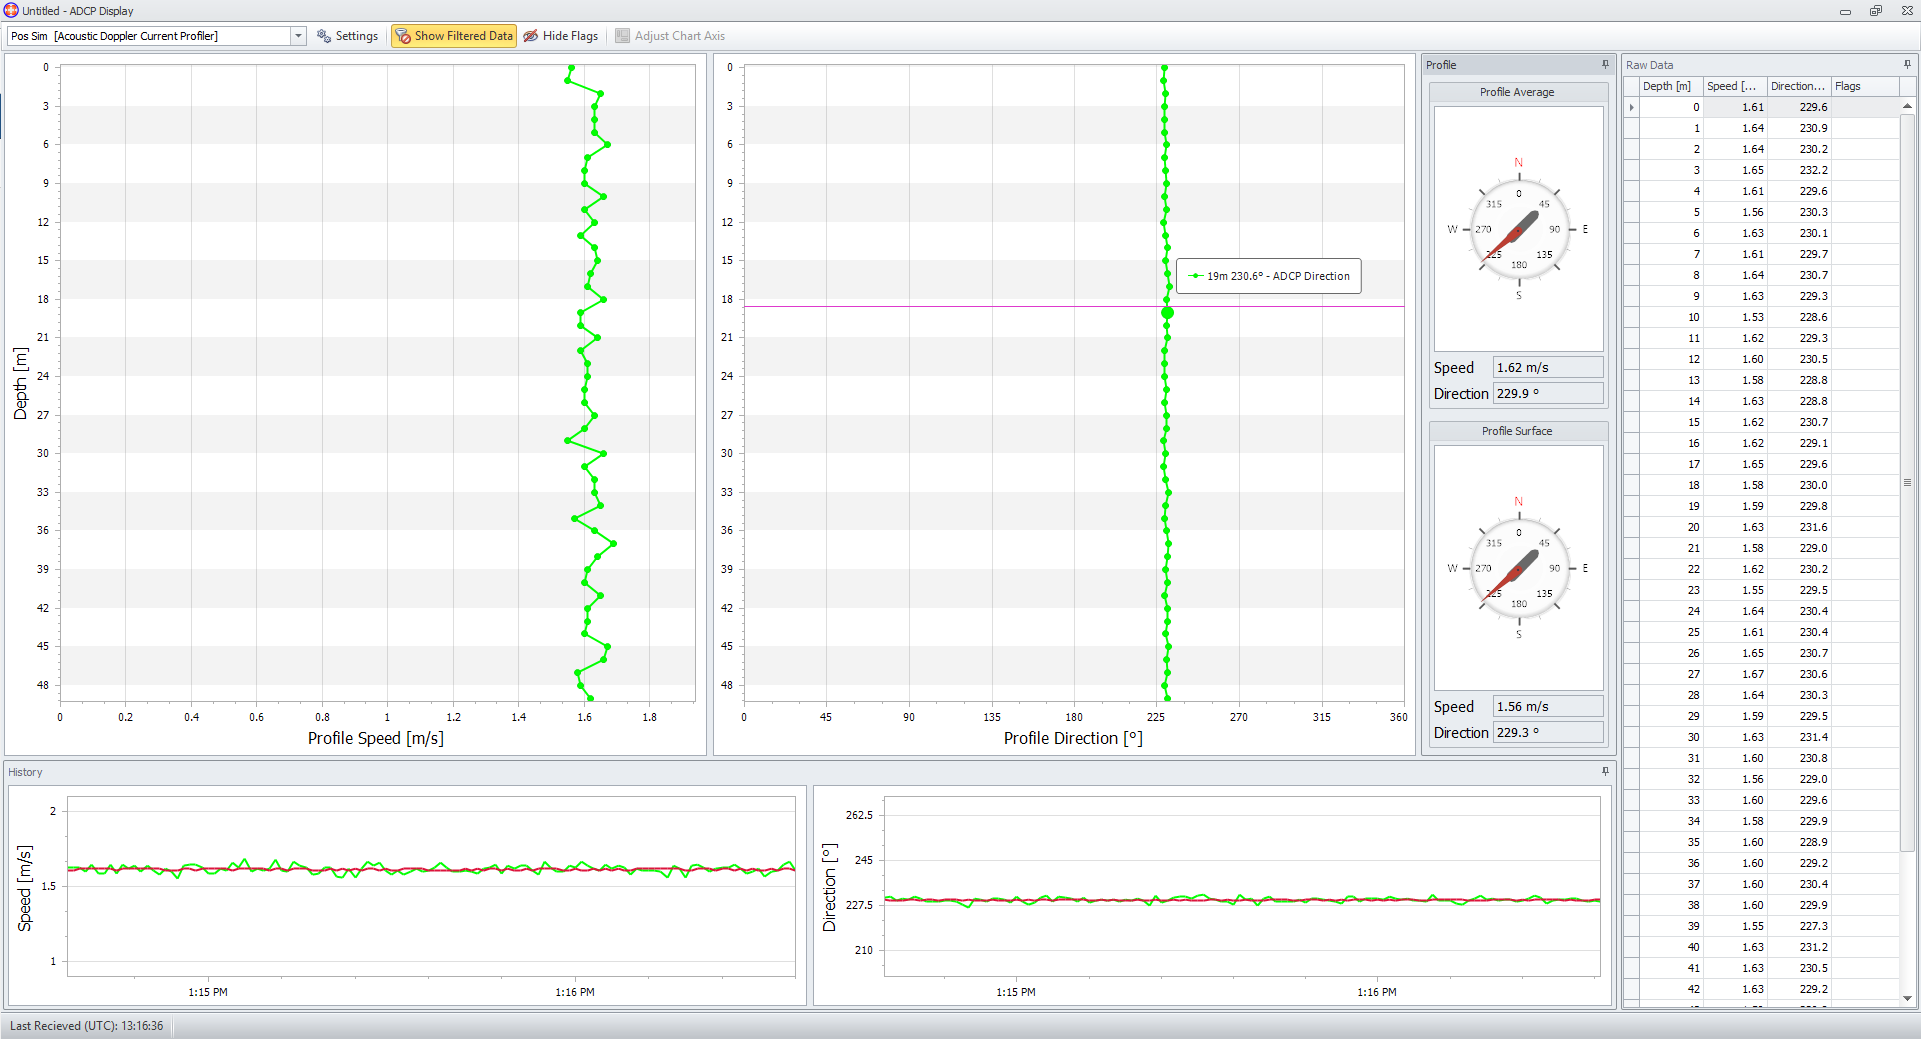
ADCP Display
The ADCP display shows the ADCP current direction and speed data in the following charts:
-
Profile charts through the water column;
-
History charts on average and surface;
-
Compass view on average and surface;
-
Raw data.
Info
The information bar of the display can contain warnings on decoded ADCP data
Generic display
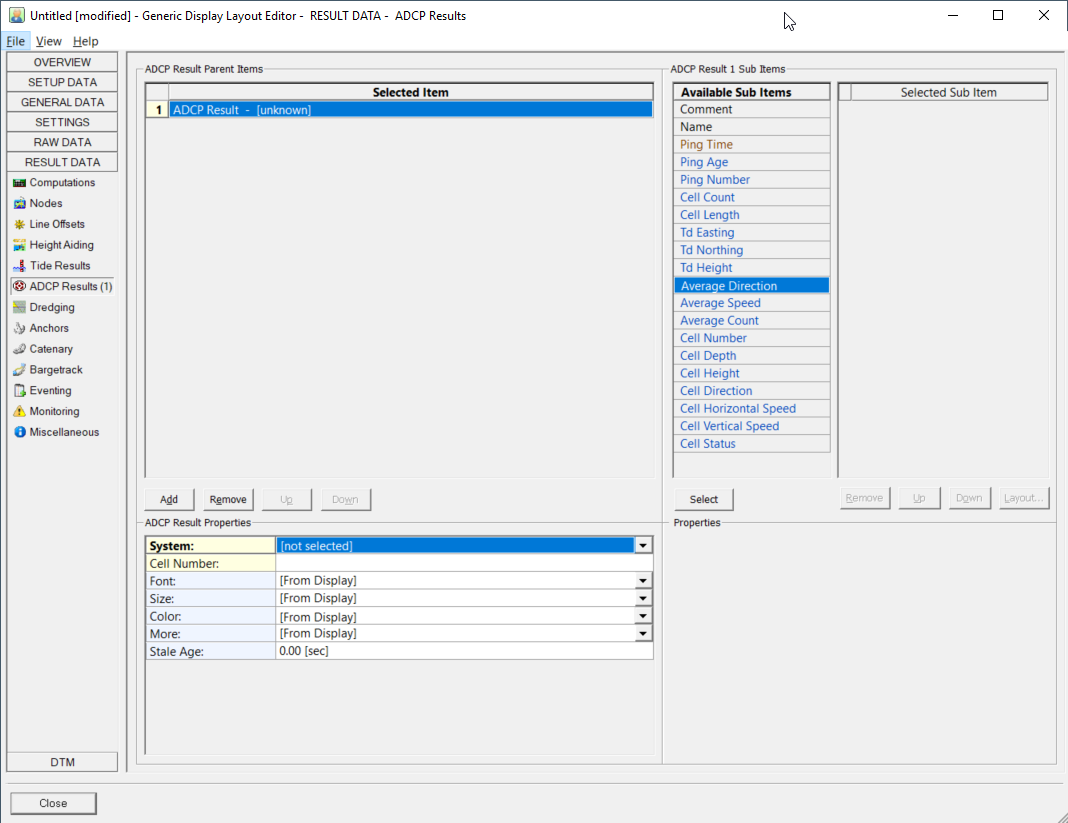
Both Raw and ADCP results data can be shown.
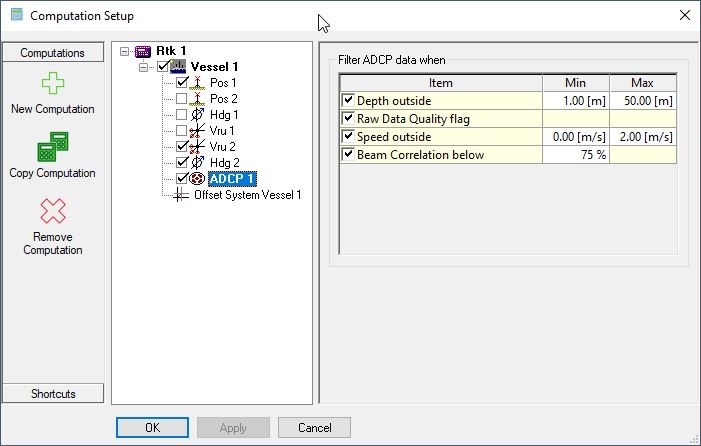
Computation Settings
There are additional controls (filters) in the Computation Setup that can influence how the average is calculated:
-
Depth outside (range)
-
Raw Data Quality flags
-
Speed outside (range)
-
Beam Correlation percentage
Logging
When recording is enabled, the data is stored in the Qinsy database and can be used for Replay. The ADCP data is also available in the Generic Output.
Additional Information
Click to expand...
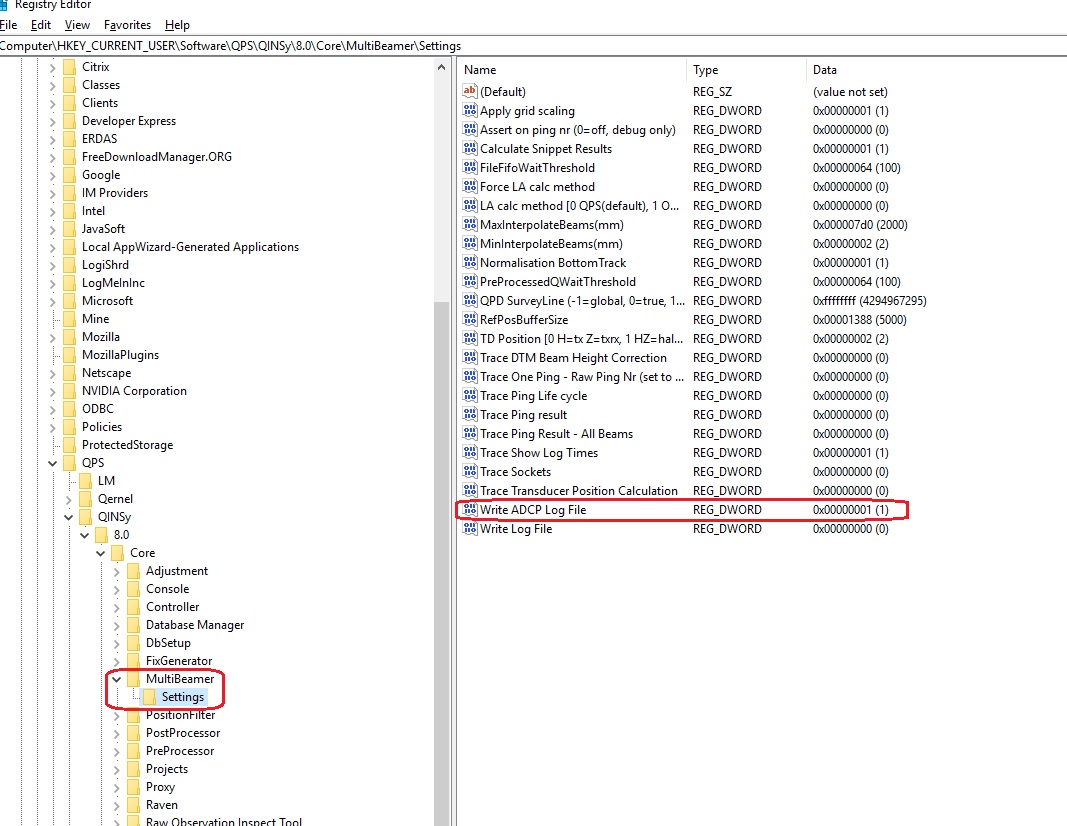
Registry settings
To log data to a text file in the log folder use the following registry key: