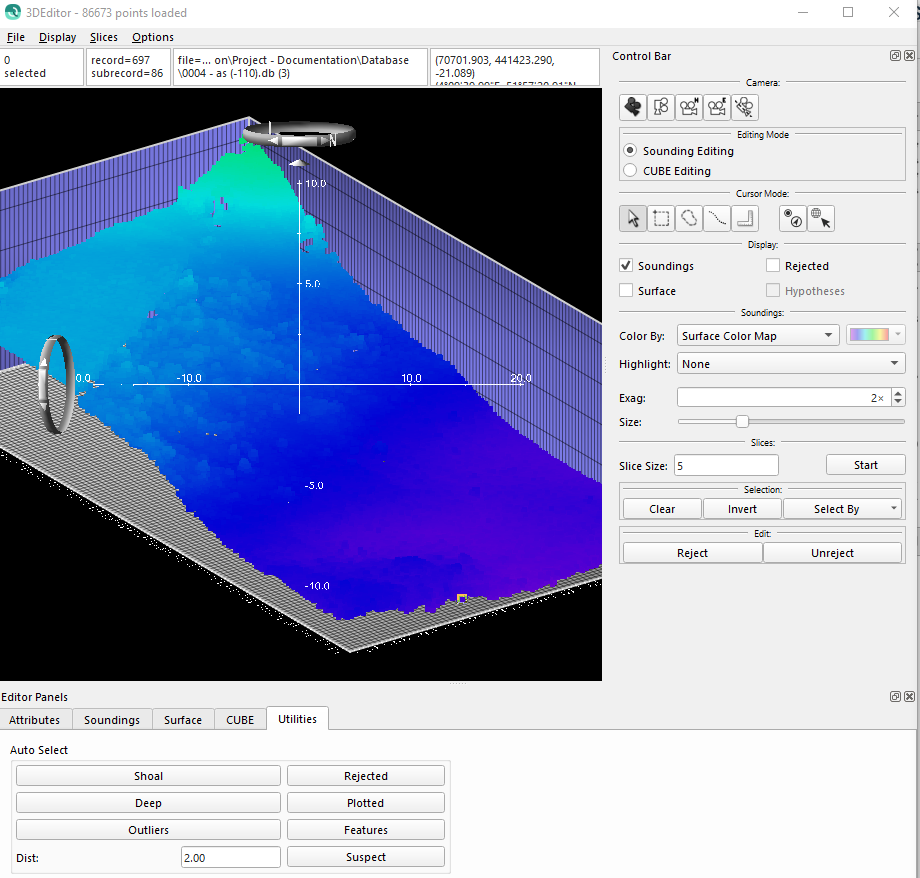
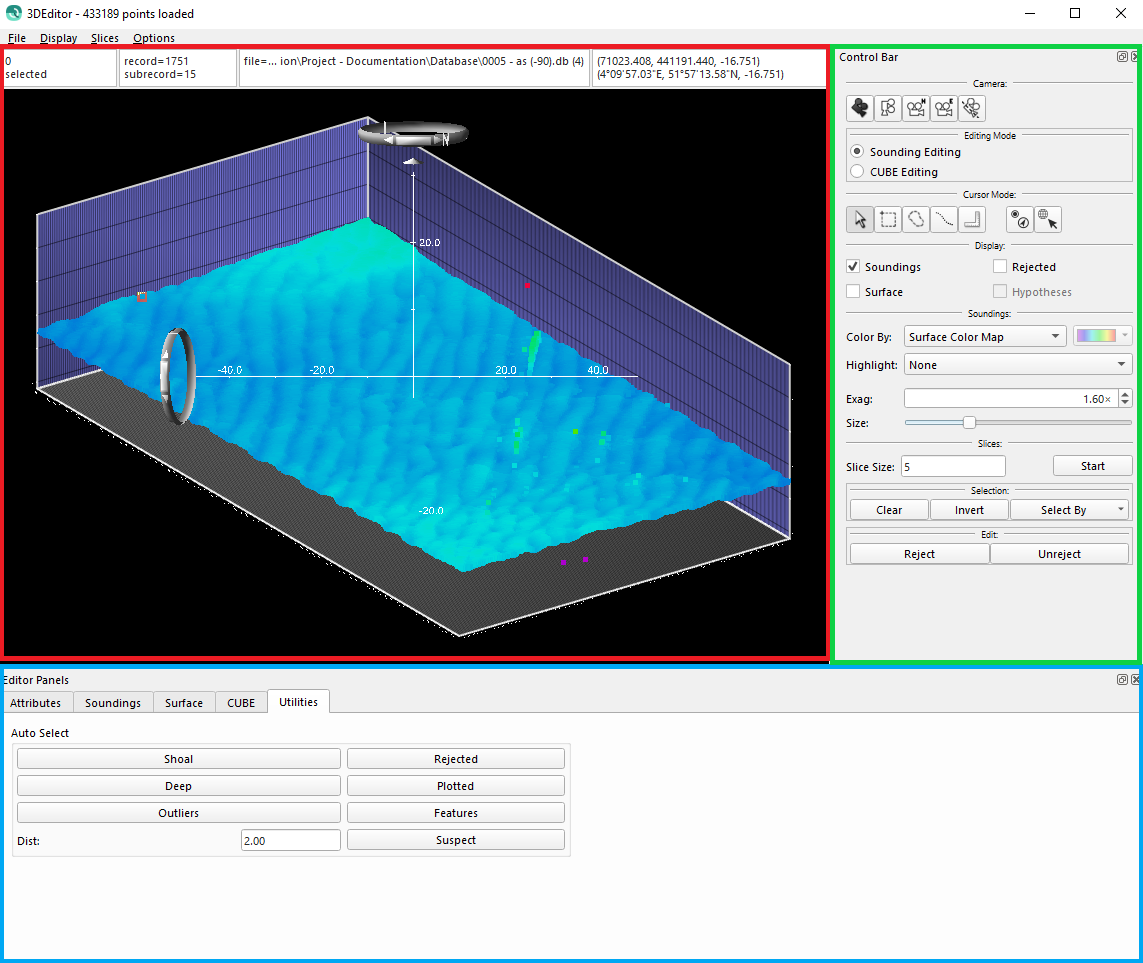
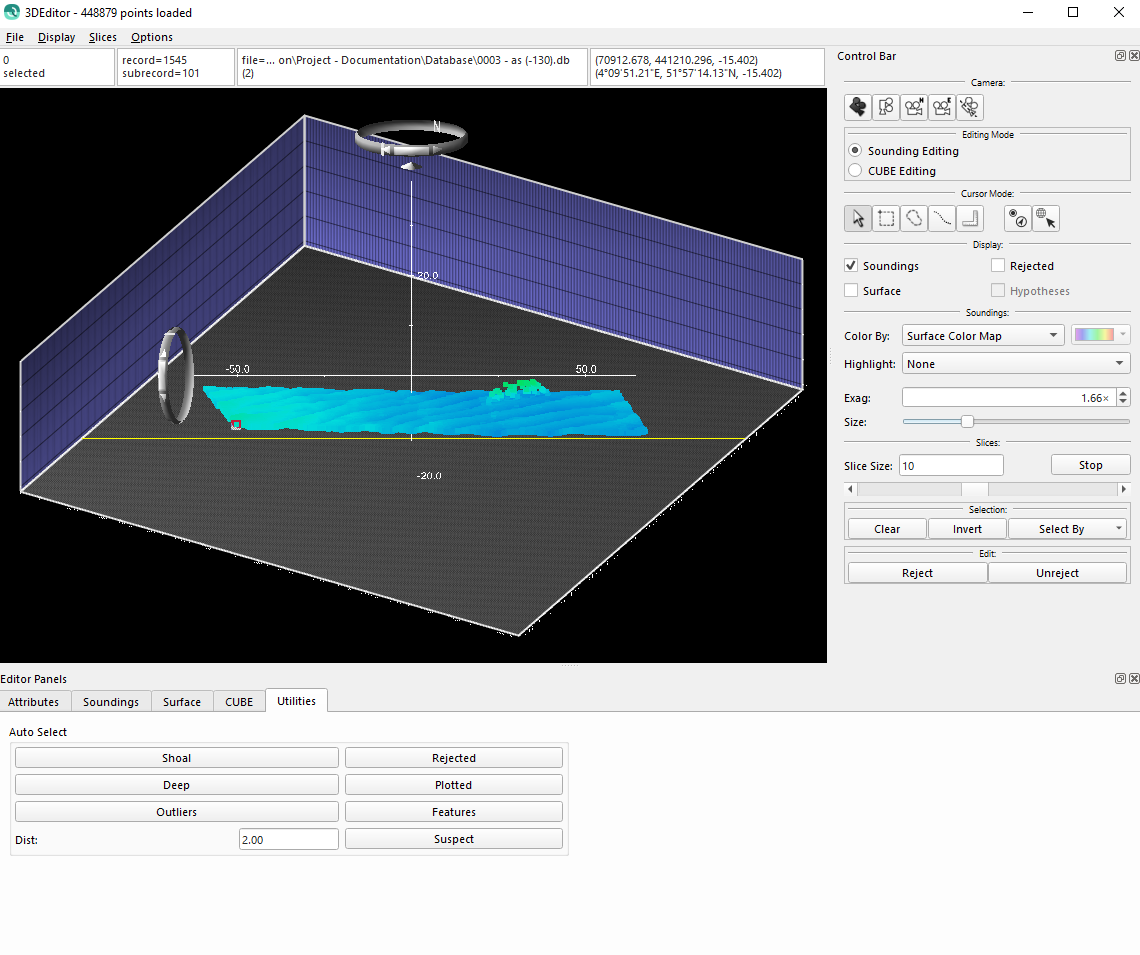
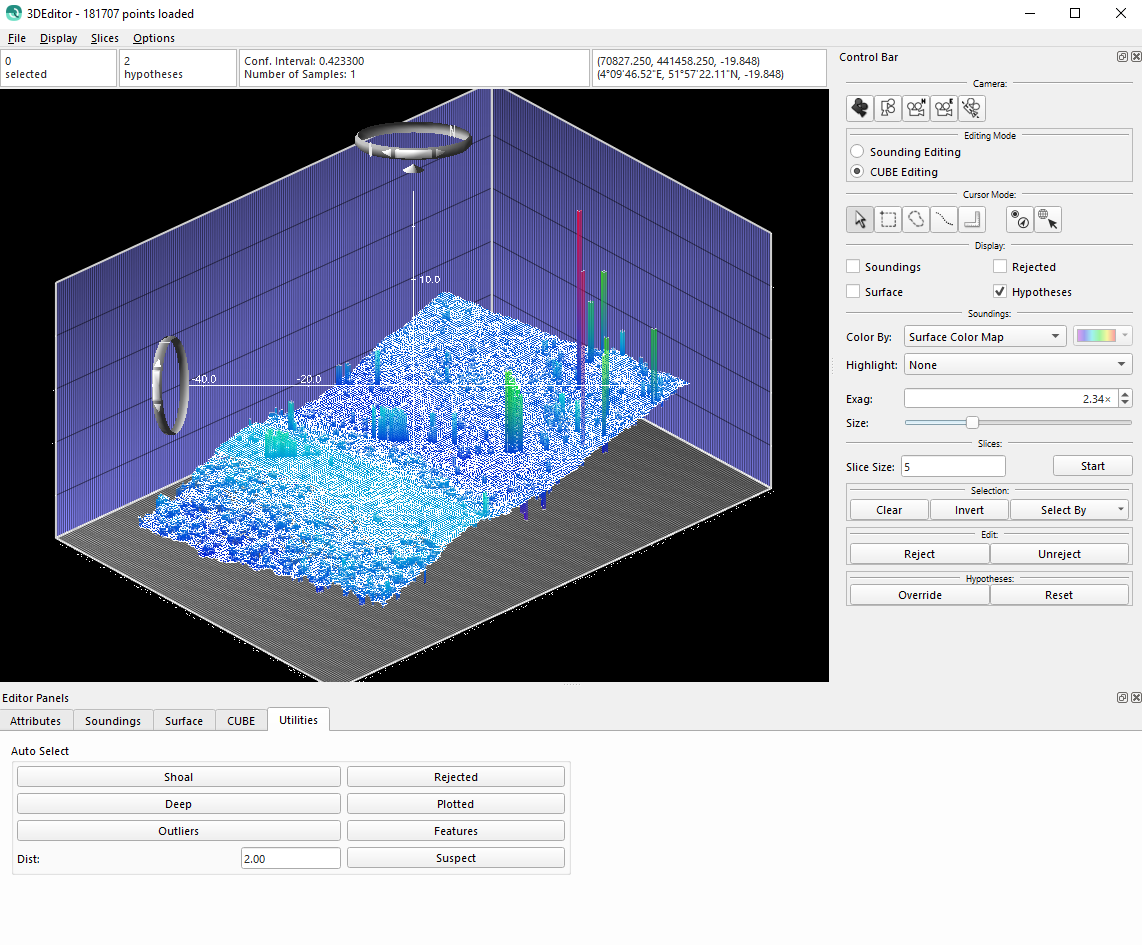
The Main Visualization Window of the 3D Editor displays the soundings from the QPD files that are being edited. The unedited soundings will be displayed as a set of small cubes that are colored by height. To navigate around the display, the same widget-based interface as Fledermaus is used.
Outside of the soundings shown in the Main Visualization Window is a blue, 3-dimensional grid that represents the boundaries of the loaded data. The Eastings and Northings are displayed along the bottom of the data and in Geographic coordinates, the longitude and latitude are shown.
When the mouse is moved, the sounding located closest to the mouse cursor becomes highlighted and information pertaining to it is displayed at the top of the window. The displayed information includes the record, sub-record, line, file, and coordinates. (If the project has an active route, the KP and DX of the sounding will also be shown.) To prevent the sounding information from being constantly updated as the mouse is moving, double-click the left mouse button to lock the currently highlighted sounding. Double-clicking a second time will unlock the sounding.
The 3D Editor contains five modes: Explore, Select, Area Select, Record Select, and Measure. Each one of these modes can be activated from the Control Bar. Switching into Select or Area Select mode, and then clicking the left mouse button selects points. Once selected, a white cross will appear over a sounding to indicate that it has been selected. Note that the title bar displays the total number of points being viewed, and the box at the top left of the screen displays the number of selected soundings. Record Select mode allows selecting and deselecting whole records at a time (i.e. one entire ping). To deselect a set of points, hold down the Shift key while clicking or dragging with the left mouse button.
To measure the distance between two soundings, switch into Measure mode and click the left mouse button on the first sounding to measure from. Moving the mouse to another sounding in the display will cause a line to be drawn between the soundings in the Main Visualization Area and the distance in meters will be displayed in the upper left corner of the interface. The compass angle and the angle of declination between the soundings will also be displayed in the upper left corner. Click the left mouse button again to start another measurement.
The following table describes the usage of the three mouse buttons in the available modes. The Explore mode is set as the default.
Modes
Left MB
Control + Left MB
Shift + Left MB
Middle MB
Right MB
Explore
Pick and drag surface to rotate about either a horizontal or vertical axis.
Move around the scene, and zoom in if mouse moved away from you, or zoom out if mouse moved towards you.
Show right-click menu
Select
Single click to select the highlighted point; drag to select a box shaped area.
Single click to deselect the highlighted point; drag to deselect a box shaped area.
Pick and drag surface to rotate about either a horizontal or vertical axis.
Same as Explore
Same as Explore
Area Select
Single click to highlighted point; drag to select an irregular area.
Single click to deselect the highlighted point; drag to deselect an irregular area.
Pick and drag surface to rotate about either a horizontal or vertical axis.
Same as Explore
Same as Explore
Record Select
Single click to select the record (swath) that the highlighted point is a part of; drag to select all records that contain a point in the box.
Single click to deselect the record (swath) that the highlighted point is a part of; drag to deselect all records that contain a point in the box.
Pick and drag surface to rotate about either a horizontal or vertical axis.
Same as Explore
Same as Explore
Measure
Single click to start measurement. Single click again to stop measurement.
Same as Explore
Same as Explore
Depending upon the flags set for a sounding, it will appear as a different symbol in the Main Visualization Window. How the different soundings appear can be controlled using the Soundings Panel in the Editor Panels or the Control Bar.
The following table lists all sounding classes in order of priority and lists the default display attributes.
Sounding Type
Default Display Attributes
Deleted
Red Diamond
Feature
White Cylinder
Plotted
Outlined box colored by depth
Normal
Box colored by depth
Suspect
Yellow Diamond
Additional Sounding
Teal Sphere
User Additional Sounding
Green Sphere
Control Bar
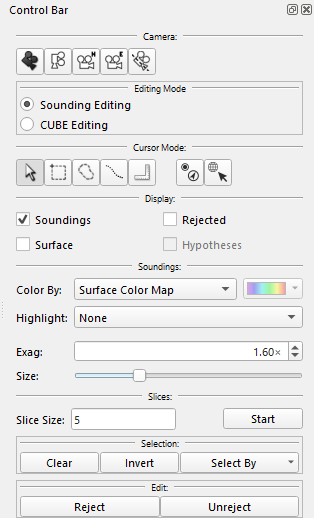
The Control Bar on the right side of the interface is used for controlling the view, editing mode, sounding display, and for simple editing.
Camera Group
The buttons located at the top of the Control Bar allow control of the Camera:
The Reset button will return the viewpoint to the initial position.
The Plan button locates the viewpoint directly above the data.
The North button will allow viewing of the data towards the north.
The East button will moves the camera so it is looking east.
Clicking the Slope button will try to orientate the view so that it is looking along the slope of the data. This option is useful if the data is roughly planar, as the outliers will typically lie aboves or below the slope of the data.
The different cursor modes are described in the previous section on the Main Visualization Window. The four available modes are as follows:
Explore Mode
Select Mode
Area Select Mode
Record Select Mode
Measure Mode
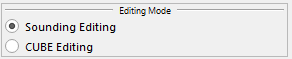
Editing Mode Group
To view the Cube hypotheses in the 3D Editor, click the Cube Editing toggle. See also the Editing CUBE Hypotheses chapter.
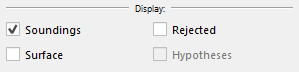
Display Group
The Display group controls which items are visible in the Main Visualization Window. If the Soundings toggle is enabled, all non-rejected soundings are displayed on the screen. If the Rejected toggle is set, all soundings that have been rejected are drawn (these soundings are usually drawn as red diamonds).
If the Surface toggle is enabled, then the surface is drawn.
If the Hypotheses toggle is enabled, then the Hypotheses are shown while in CUBE Editing mode. (This option is grayed out if there is no CUBE surface).
Soundings Group
The Soundings group allows configuration of various properties of the displayed soundings in the Main Visualization Window. Use the Color By menu to control how non-rejected soundings are displayed on the screen. Additional Soundings and User Additional Soundings will display options is an exception in that it will override rejected soundings display options. The additional soundings display is for soundings that are flagged as additional sounding returns for a beam. The user additional soundings display is for soundings that are flagged as user additional sounding which commonly comes from doing water column picking in Qimera.
Color By Options are listed below. Some of these will allow the colormap to be selected, adjusted for a specific range, or edited. This can be done using the colormap button to the right of the Color By menu.
Depth
Surface Colormap
Color
Record
Subrecord
File
Horizontal Uncertainty
Vertical Uncertainty
Checked
Custom Hypo. Flag
Additional Sounding
User Additional Sounding
Tide
System
Intensity
Highlight Options:
None
Checked
The Highlight By menu allows drawing all soundings that match a certain flag as a lighter color.
The Exaggeration allows exaggerating the height ratio (1.00x represents 1:1 height ratio).
The Size slider controls how large the points are drawn on the screen.
Slices Group
The Slices group allows traversing the scene in slices. See also the slice-based editing chapter.
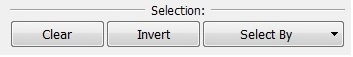
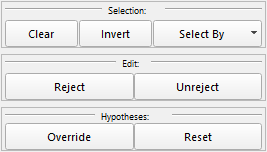
Selection Group
The current selection can be cleared by clicking the Clear button. To invert the selection (deselect all selected points and select all previously unselected points), click the Invert button. Some extra options for selecting soundings can be accessed by clicking the Select By button. Selecting any of the menu options that correspond to flags (i.e. Modified, Plotted, etc.), will select all soundings in the editor that have that flag set (Certain menu options are grayed out because they do not pertain to the QPD format).
Select By Options:
Rejected
Manually Rejected
Filtered Rejected
Modified
Checked
Suspect
Plotted
Feature
Custom Hypo. Flag
Additional Sounding
User Additional Sounding
Shoal
Deep
Outliers
Blocked Relative Depth
Blocked Range
Blocked Angle
Blocked Heave
Blocked Exclude Beams
Failed Brightness
Failed Co-linearity
Despiked
Reduced
Blocked TPU Horizontal
Blocked TPU Vertical
Blocked Quality
Blocked Nadir
Blocked Across Track
Blocked Absolute Depth
Blocked Intensity
Spline Filtered
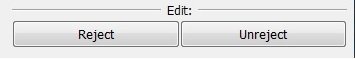
Edit Group
Once a selection has been made with the mouse, the selected points can be marked as invalid by clicking the Reject button. Note that the rejected points are not actually removed from the file but a flag is set. To view the rejected points, click the Rejected toggle in the Mode group. The rejected soundings can then be selected with the mouse and undeleted by pressing the Unreject button.
Right-Click Menu
The right-click menu can be accessed by right-clicking on the Main Visualization Window. The Control Bar can be used for simple rejecting and unrejecting of data, but to set other flags (plotted, feature, suspect, etc.), the right-click menu must be used.
Select
The Select Menu gives different options on how to automatically select soundings. Note that some operations have shortcut keys that are listed to the right of the menu item.
Select Sounding
Clicking the Select Sounding menu option will select the highlighted point.
Select Record
Clicking the Select Record menu option will select the whole record that contains the highlighted point.
Select File
The Select File menu option will selects all soundings that have the same file as the highlighted sounding.
Deselect Sounding
The Deselect Sounding menu options will deselect the highlighted point.
Deselect Record
The Deselect Record menu option will deselect the whole record that contains the highlighted point.
Deselect File
The Deselect File menu option will deselect all the soundings that have the same file as the highlighted sounding.
The Edit Menu is the main method of setting flags in the 3D Editor. The typical use of the Edit menu is to make a selection and then select one of the options from the menu. However, if no soundings are selected when one of the Edit options is selected, the operation will be applied to the highlighted sounding. For example, to simply reject one bad point, make sure no points are selected, highlight the point by moving the mouse over it, right click, and select Edit > Reject.
The Set Suspect menu option will mark the selected or highlighted sounding(s) with a suspect flag.
Set Plotted
The Set Plotted menu option will mark the selected or highlighted sounding(s) with the plotted flag.
Set Feature
The Set Feature menu option will mark the selected or highlighted sounding(s) with the feature flag.
Clear Suspect
The Clear Suspect menu option will clear the selected or highlighted sounding(s) of the suspect flag.
Clear Plotted
The Clear Plotted menu option will clear the selected or highlighted sounding(s) of the plotted flag.
Clear Feature
The Clear Feature menu option will clear the selected or highlighted sounding(s) of the feature flag.
Hide Menu
The Hide menu can be used to temporarily hide some of the soundings in the display so that other soundings can be viewed more easily. For example, an operator may wish to view just one line or one file at a time. Hiding a sounding makes no changes to the actual file and soundings will remain hidden only as long as the current editor session is open. To view one file at a time, highlight a sounding that is part of that file, click Selection > Select File, and then Hide > Hide Unselected.
The Recube menu option re-runs the Cube algorithm on the current area being edited.
Menus
File Menu
The File menu is used to save changes, close the 3D Editor, move the visible area, and capture current content as an image of point object. The Move options can be used to systematically scan through the data. The rotate Anticlockwise and rotate Clockwise can be used to rotate the loaded area. To prevent the z range from changing while scanning through data, see the(2.6) Qimera 3D Editor#Lock Z Range option on the Options menu.
Save
After changes have been made, the Save menu option must be clicked to write the changes to the disk. This will update the surface being displayed in the main Qimera window.
Save and Exit
Save And Exit command saves any changes and then closes the editor. This will update the surface being displayed in the main Qimera window.
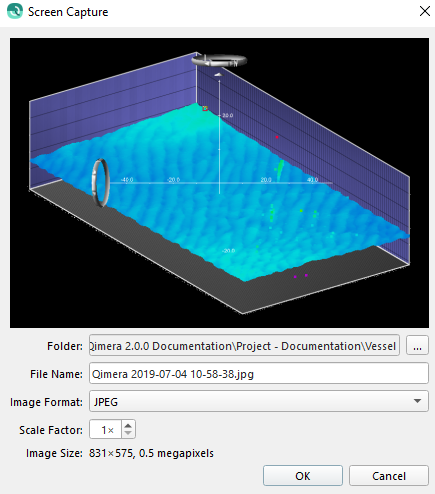
Screen Capture
The Screen Capture menu option will bring up the following dialogue,
This gives the ability to take a screen capture of the current 3D Editor at the preferred scale factor and image format and save it to the desired location.
Save Snapshot
The Save Snapshot menu option will create a point object from the soundings displayed and save it to the current Qimera Project in the SD folder. It will also automatically add that object to the Qimera Project Layers. If no soundings are selected it will export all visible soundings in the 3DEditor. If there are soundings selected, it will only export the soundings that are selected.
Exit
The Exit button will close the editor and you will be prompted to save any unsaved changes.
Display Menu
The Display menu controls which items are displayed in the Main Visualization Window.
Show Grid
The Show Grid menu option controls whether the blue fence is displayed around the data points.
Show 3D Grid
The Show 3D Grid menu option controls whether the base of the grid is displayed.
Show Plane
The Show Plane menu option controls whether the base of the grid is displayed.
Show Stalks
The Show Stalks menu option controls whether the lines from each sounding to the base of the grid is displayed.
Show Coordinates
The Show Coordinates menu option controls whether the X, Y, and Z labels are shown along the edges of the grid.
Show Widgets
The Show Widgets menu option controls whether the interaction widgets is displayed.
Show Rulers
If the interaction widget is visible then the Show Rulers menu option controls determines whether the axes labels are shown.
Show Angles
If the interaction widget is visible then the Show Angles menu option controls determines whether the direction angles are shown.
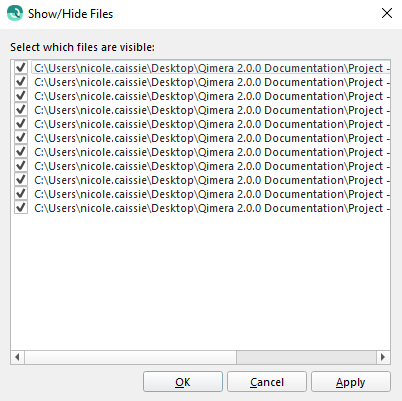
Show/Hide Files
The Show/Hide Files menu option displays the following dialog.
This dialog shows a list of all files that have soundings loaded in the editor. Check or uncheck the box beside each item to show or hide that item. The Apply button performs the operation without closing the dialog. The OK button applies the operation and closes the dialog and the Cancel button cancels the operation.
Click Start Slice menu option to enter slice-editing mode.
End Slice
Click End Slice menu option to leave slice-editing mode
Next Slice
Click Next Slice menu option to advance to the next slice.
Previous Slice
Click Previous Slice menu option to to return to the last slice.
Options Menu
The Options Menu can be used to control the current interface.
Save Current Interface
The Save Current Interface menu option writes the current state of the interface to a preference file. The next time the 3D Editor is loaded, the interface will be configured the same as when saved. Included in the current state of the interface is the shape and color of each type of sounding, all display options, background color, and current color map. For example, if you wish the interface to draw soundings with spheres, make the change and select Options > Save Current Interface. Then, every time the editor is loaded, the soundings will be drawn using the desired shapes.
Reset Interface
The Reset Interface menu option returns the interface to the original set of options. Save Current Interface must be selected again to make the changes permanent.
Preferences
The Preferences menu option will bring up the following dialog to change 3D Editor preferences
By clicking the Set Background Color button, a new background color can be selected for the editor using a Standard Color Picker. By clicking the Set 3D Grid Color button, a new 3D grid color can be selected for the editor using a Standard Color Picker. By clicking the Set Plane Color button, a new plane color can be selected for the editor using a Standard Color Picker. Enter a Color map to use when coloring soundings in the Color map field, or select one using a file dialog box by pressing the Browse button.
Toggle on the warning for loading too many points to enable or disable the warning. Also set the number of points for which the warning is shown up to a maximum of 3 million points. If attempting to load more than 3 million points the warning will be shown whether the prompt warning is enabled or not. Basically, 3D Editor stops counting at 3 million points. However, you can still choose to proceed.
Colors for the connectors can also be chosen by clicking on the Set Left Color or Set Right Color buttons (the default is green and red). Adjust the width of connector lines by entering a new value in the Connector Line width text field. Press Apply to apply the selected preferences or OK to apply the preferences and close the dialog. Clicking Cancel will dismiss the dialog without making changes.
Lock Z Range
When the Lock Z Range toggle is enabled, the 3D Editor will not automatically adjust the displayed z range depending upon the data range. Actually, the displayed range may increase if data is loaded outside of the range, but the range will not decrease. This option is useful for comparing different areas in the 3D Editor. When used with the Move Forward/Backward/Right/Left options on the File menu, the z range will not jump to fit the data. Click the Lock Z Range toggle to turn this option on or off.
Lock Exag
The Lock Exag menu option toggle locks the current exaggeration factor.
The Editor Panels are a set of tabs along the bottom of the screen. These tabs are only for advanced editing as most of the editor functionality is contained in the Control Bar and the Right-Click Menu.
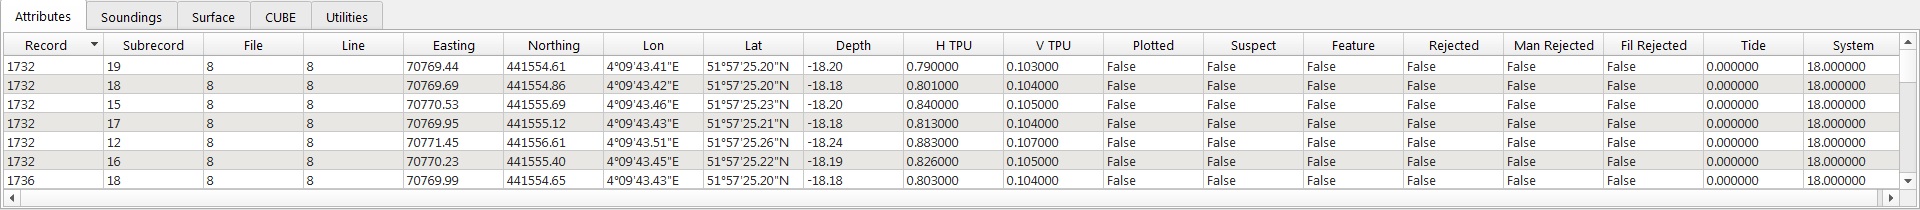
Attributes Panel
The Attributes Panel displays a table of all currently selected soundings. This table includes all of the information stored in the QPD files for each sounding. When a sounding is selected in the table, it is displayed in a highlighted color and is also highlighted in the Main Visualization Window. To sort the table in ascending or descending order, the headings of the different columns can be clicked with the mouse. Note that to prevent the selected soundings in the Main Visualization Window from changing as the mouse moves, the window can be double-clicked to lock the selection. Also any Horizontal or Vertical TPU values are represented as 95 percent Confident Interval values.
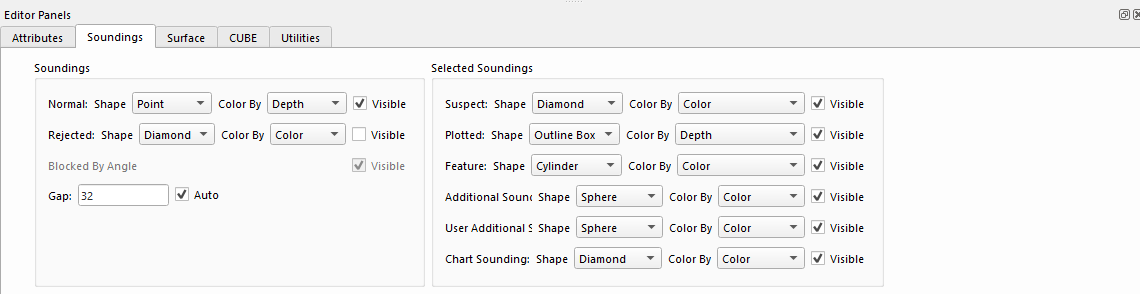
Soundings Panel
The Soundings panel allows control of how different soundings are displayed. The Gap text field indicates the point gap used when exploring the surface and the Auto toggle informs the ShiftScapeTM rendering engine to automatically adjust the gap. There are two main sounding classes: rejected and normal (not rejected), as well as four selected sounding classes: suspect, plotted, feature, additional sounding and user additional sounding. The shape, color, and visibility of each sounding class can be controlled separately. Each sounding can either be displayed as a box, point, sphere, diamond, cylinder, or outlined box. For large data sets, displaying soundings as points may be faster than the other shapes. A variety of coloring methods also exist including coloring by depth, solid color, record, sub-record, line, file, modified, checked, tide, system, intensity, and heave offset. Blocked By Angle will hide all rejected soundings that are flagged as Blocked by Angle. This helps reduce the number of rejected soundings shown at once in the editor.
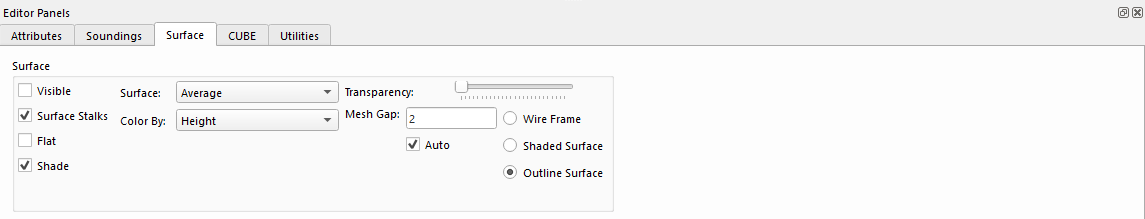
Surface Panel
The 3D Editor is now capable of displaying the surface or DTM that result from a set of soundings as shown in figure Displaying a smooth surface in the 3D Editor. The Surface Panel controls how the surface is displayed. To show the surface, select the Visible toggle or click the Surface toggle in the Control Bar. If the Surface Stalks toggle is enabled, a stalk is drawn from each sounding to the created surface. By default, each surface is drawn via interpolation and thus might not match exactly what is expected. To draw each cell at the exact calculated height, enable the Flat toggle. Also, shading is usually applied to the generated surface. At times the shadows can be distracting and can be turned off using the Shade toggle.
The Surface, Color By, Transparency, Mesh Gap, and Auto controls are similar to the Surface Control tab in the main Qimera window. One additional option on this tab is to display an Outlined Surface, which is a regular DTM with a white grid laid on top.
CUBE Panel
A number of additional options for editing hypotheses are included on the Cube panel at the bottom of the screen. See also the Editing CUBE Hypotheses chapter.
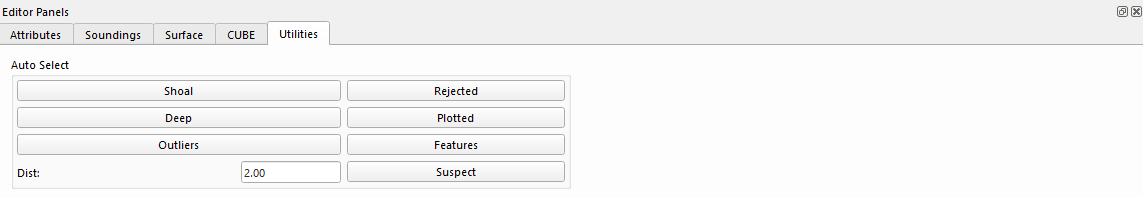
Utilities Panel
The Utilities Panel contains a number of utilities for selecting soundings in the editor. Clicking the Shoal button will select the shoalest sounding in the whole area and clicking the Deep button will select the deepest sounding in the whole area. The Outliers button will select all soundings in a bin that are more than Dist meters away from the average bin height. The four buttons on the right side are used to select a set of soundings that have a certain flag set. Clicking the Plotted flag will select all soundings in the editor that have the plotted flag set. The Features, Suspect and Rejected buttons work similarly for their respective flags. These buttons can be used for a search-and-replace type operation. For example, to change all flags in the display from Plotted to Feature, click the Plotted button and then on the right-click menu select Edit > Set Feature and then Edit > Clear Plotted.
Slice-Based Editing
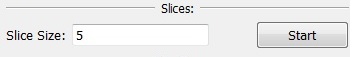
Slice-Based Editing allows loading a large number of soundings into the 3D Editor and then viewing cross sections of the data in a systematic way to inspect all of the data points. Enter slice-based editing mode by clicking the Slices > Start Slice menu option, or the Start button in the Slices section of the Control Bar. The 3D Editor will show a cross-section of the data containing a certain percentage of the whole range of the data. Yellow lines will be drawn on the base plane to indicate the bounds of the slice. Note that the orientation of the slices is chosen based on the current view direction when slice-mode is started.
Change the percentage of data to be shown by entering a value in the Slice Size field in the Control Bar and pressing Enter (the default is 5 percent). To view the next slice in the data, click the Slices > Next Slice menu option, press F10, or click the right arrow on the scroll bar that appears in the Slices section of the Control Bar. To go back to the previous slice, click Slices > Previous Slice, press F9, or click the left arrow on the slices scroll bar. Note that the central thumb in the slices scroll bar can be dragged to any position to move the slice through the whole range of data.
End slice-ending mode by clicking Slices > End Slice, or press the Stop button in the Slices section.
Editing CUBE Hypotheses
Viewing the CUBE Hypotheses
To view the Cube hypotheses in the 3D Editor, click the Cube Editing toggle, located on the upper right of the Control Bar. When the Cube Editing toggle is activated, the interface of the 3D Editor will change. To indicate the editor is in a different mode, the color of the grid and the color of the status panels will change to yellow. To show the Cube hypotheses without entering Cube editing mode, click the Hypotheses toggle in the Display group.
Each Cube hypothesis is represented as a flat plate, indicating the height of the hypotheses. The currently selected hypothesis is displayed as a large plate, and the alternate hypotheses are displayed as smaller plates. All of the plates in a single bin are joined by a line through their centers. To hide the soundings in the editor, disable the Soundings toggle. Clicking the Surface toggle will show the interpolated surface formed from the Cube hypotheses.
When the Cube Editing toggle is enabled, the interface changes to work on hypotheses instead of soundings (note that the 'k' key can be used to turn on or off Cube editing mode). When moving the mouse over the screen, the closest hypothesis will be highlighted and information about that hypothesis will be displaying in the status bar.
Selecting hypotheses works similar to selecting soundings. Enter any of the selection modes and single click to select a hypothesis, or click and drag to select multiple hypotheses. A hypothesis that is selected will be drawn with a solid white outline. Note that in each bin, at most one hypothesis can be selected at a time.
Editing Hypotheses with the Control Bar
The Control Bar on the right hand side changes slightly when the Cube toggle is enabled. Click the Clear or Invert buttons to modify the selected hypotheses. Clicking the Reject button will delete the hypotheses in the currently selected bins. The Unreject button will undelete hypotheses that have been deleted (click the Show Rejected toggle in the Cube Panel to view deleted hypotheses).
The process of marking an alternate hypothesis as the selected hypothesis is called overriding and can be accomplished by selecting alternate hypotheses and clicking the Override button. The selected hypotheses can be reset to the original hypothesis chosen by the Cube algorithm by clicking the Reset button. Overriding is usually the main editing operation when working with Cube surfaces.
Right-Click Menu
The right-click menu changes when the Cube toggle is enabled.
Select Menu
The Select menu allows hypotheses to be selected, deselected, cleared, and inverted, similar to the Control Bar.
Select Hypothesis
The Select Hypothesis menu option selects the currently highlighted hypothesis.
Deselect Hypothesis
The Deselect Hypothesis menu option clears the selection for the currently highlighted hypothesis.
Select Connected
The Select Connected menu option starts at the currently highlighted hypotheses and spreads out, selecting any neighboring hypotheses that are close enough in depth to their neighbors. Use the Select Connected option to select hypotheses that lie along a flat surface.
Move Selection Up
The Move Selection Up menu option takes any bins that have a hypothesis selected and will have the next highest hypothesis in the bin selected. This command allow all of the shoal hypotheses to be selected easily. For example, press 'C' then 'I' to select all hypotheses, press ']' repeatedly until the topmost hypotheses are all selected, and then press 'O' to override all the hypotheses.
Move Selection Down
The Move Selection Down menu option takes any bins that have a hypothesis selected and will have the next lowest hypothesis in the bin selected. This command allow all of the deep hypotheses to be selected easily. For example, press 'C' then 'I' to select all hypotheses, press '[' repeatedly until the bottommost hypotheses are all selected, and then press 'O' to override all the hypotheses.
Clear
The Clear menu option clears the selection for all hypothesis loaded in the 3D Editor.
Invert
The Invert menu option inverts the selection for all hypothesis loaded in the 3D Editor.
Edit Menu
The Edit menu on the right-click menu contains options similar to the Control Bar. Note that if a selection is made, these commands apply to all of the selected hypotheses, otherwise the command is applied to the currently highlighted hypotheses.
Override Hypotheses
The Override Hypotheses menu option will mark other hypotheses from a bin as the selected hypothesis.
Reset Hypotheses
The Reset Hypotheses menu option resets the selected hypothesis from a bin.
Delete Hypotheses
The Delete Hypotheses menu option rejects a hypotheses.
Undelete Hypotheses
The Undelete Hypotheses menu option unrejects a hypotheses.
Hide Menu
The Hide menu is similar to the menu for editing soundings.
Hide Selected
The Hide Selected menu option hides all of the selected hypotheses.
Hide Unselected
The Hide Unselected menu option hides all of the unselected hypotheses.
Unhide All
The Unhide All menu option unhides all the hypotheses loaded in the 3DEditor.
Re-CUBE
The Recube menu option re-runs the Cube algorithm on the current area being edited. Instead of editing hypotheses, an operator may delete a set of soundings (for example, from a burst failure), and re-run the Cube algorithm to generate better quality hypotheses.
The Recube algorithm can also be run from the Dynamic Surface Tools menu in Qimera.
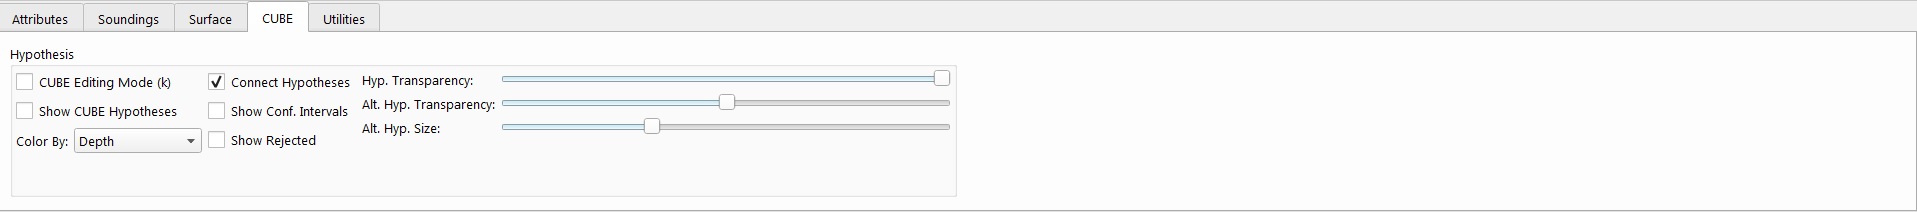
CUBE Panel
A number of additional options for editing hypotheses are included on the Cube panel at the bottom of the screen.
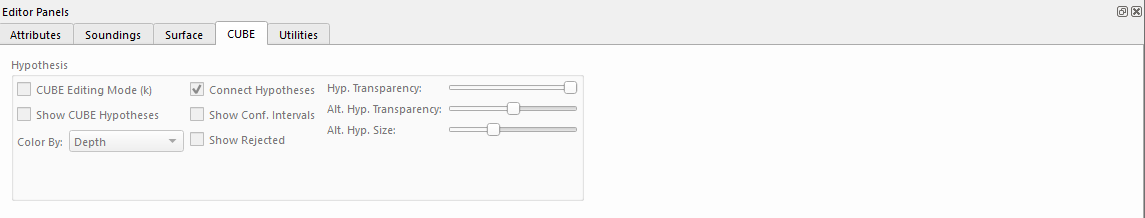
If the Cube panel is not visible, click the Options > Editor Panels menu option. The first toggle, Cube Editing Mode, is identical to the Cube Editing toggle on the upper-right area of the Control Bar. Enabling this toggle switches the interface into hypothesis-editing mode. When the Cube Editing Mode toggle is enable, the Sh ow Cube Hypotheses is automatically enabled as well. However, the Show Cube Hypotheses toggle may be turned on by itself to just view Cube hypotheses without entering hypothesis-editing mode. This option is useful to view Cube hypotheses, but edit the soundings.
The Cube hypotheses can be colored by a number of different methods using the Color By drop-down menu. The Confidence, Num. Soundings, and Hyp. Strength options are read from the extra attributes of the bin). The Overridden option marks all bins as yellow that are set to one of the alternate hypotheses. The Color option allows coloring of the hypotheses by a solid color and the Custom option colors any bins yellow that contain a custom hypothesis.
By default, a line is drawn connecting all hypotheses in a bin. To hide this line, deselect the Connect Hypotheses toggle. If the Show Conf. Intervals toggle is enabled, a line representing the 95% confidence interval is displayed about each hypothesis. Enabling the Show Rejected toggle will display all hypotheses that have been rejected. This toggle is necessary to unreject hypotheses.
The last three sliders in the Cube panel control how the selected and alternate hypotheses are displayed on the screen. The Hyp. Transparency slider controls the transparency of the selected hypotheses and the Alt. Hyp. Transparency slider controls the transparency of the alternate hypotheses. The sliders range from fully transparent on the far left to fully opaque on the far right. The Alt. Hyp. Size slider controls how large the alternate hypotheses are drawn. The slider value ranges from full size on the far right to hidden on the far left.
Creating a Custom Hypothesis
Sometimes an operator may wish to identify a sounding as the chosen height of the surface (this sounding is sometimes called a feature sounding or golden sounding). To accomplish this task, turn off the Cube toggle and turn on the Soundings toggle in the Control Bar. To view the Cube hypotheses at the same time as editing soundings, click the Show Cube Hypotheses toggle in the Cube Panel. While editing soundings, right-click on a sounding and select the Set Custom Hypothesis option from the menu. This action will generate a new hypothesis and place it at the same height as the sounding. The confidence interval for the created hypotheses will be the same as the confidence interval for the sounding. A custom flag called Custom Hypo. Flag will be set for the sounding. To remove the custom hypothesis, override one of the other hypotheses in the bin. Note that only one sounding in a bin can be marked as a custom hypothesis at a time.
Shortcuts
Shortcuts are available for many of the functions within the 3D Editor. To set and review shortcuts click within the main Qimera window and select Project > Configure Shortcuts... More information can be found at Qimera Configure Shortcuts Dialog.