
Main Visualization Window
The Main Visualization Window is the viewport into the virtual 3D world. It is primarily a display space but does contain a number of controls and interaction functions. There are two different exploration modes that affect the visualization window and these modes are described in the sections below. In addition to the exploration modes, the mouse is used to perform actions such as geo-picking and surface profiling.
Data Exploration Modes
Fledermaus provides two mechanisms for exploring data objects in virtual 3D data space. Each mode allows you to position a virtual camera in the scene resulting in a presentation of what the camera sees from its position and orientation within the world. The exploration modes use different controls and user input to move this camera about the scene.
The 3D flight uses a six-degree of freedom input device.
The mouse-controlled widget navigation interface, is based on a centered zoom and rotate data manipulation technique.
Each of the exploration modes has strengths and weaknesses. The flight mode provides for smooth navigation across both large and small datasets while the widgets provide a fast and effective center, zoom and spin interface that quickly focuses attention on the area of interest.
3D Flight Mode
This mode of exploration provides a powerful means to navigate around the 3D data space with the use of a 3D input device, such as the BAT, or Space Navigator. A supported 3D input device must be connected and turned on before starting this mode.
If using the BAT, press and hold down the trigger button on the 3D input device to begin flying. While the button is held down, hand movements of the device are mapped in a natural fashion to movements within the 3D scene.
For example, to move forward in the scene simply push your hand forward while holding down the trigger. To move to the right you move your hand to the right. Rotations are accomplished in a similar manner. To turn left you twist your hand to the left, to turn up twist your hand upwards and so on and so forth. The speed of movement in the 3D scene is mapped non-linearly from the hand movements of the input device. Slow hand motions provide detailed and fine adjustments while fast movements accelerate the exploration speed allowing you to quickly move around the entire scene.

Predictor Navigating Over a 3D DTM
The sample image above shows a visualization of a user flying northward, beginning a downward turn, over a digital terrain map of eastern North America and the Caribbean. The rectangular box, with its corresponding tails, is called the predictor. It aids in navigation and helps prevent getting lost in the virtual world. As you fly around the 3D data set, the predictor shows where you will be a short time in the future. The tails of the predictor provide a cue to velocity and a brief history of movements. Thus it can be easily seen if you are going forward, backwards, or turning, along with how fast you are currently moving (the longer the tail the faster).
Widget Navigation Interface
The alternate exploration mode is a mouse based widget navigation (pick and zoom) interface that uses on screen widgets and direct interaction with the data space. The main point to remember with this interface is that all rotations and zoom occur about the center of the screen and picking on a new location will move that point in the scene to the center of the display.
There are a number of different modes that affect the usage of the mouse buttons: Explore, Select, and Polygon Select, indicated by three icons in the Mode section of the Control Panel. A number of widgets have been included but these are not necessary in all the modes. The figure Non-flight Exploration Interface shows the layout of the on screen widgets. See the Control Panel section for more information about the different modes.

Non-flight Exploration Interface
The primary method of moving the data in the Fledermaus visualization window is via the three buttons on the mouse. Their use depends on the mode selected. See Table below for a summary. The Explore mode is set as the default.
Table - Non-Flight use of Mouse Buttons
Mouse Buttons | |||
Modes | Left | Middle | Right |
| Click and drag surface to rotate about either axis – vertical or horizontal | Animated move to picked position Zoom in if mouse moved up | Click and drag for profile |
Note: In Explore mode, it is unnecessary to pick the surface to obtain the position, as it is continuously updated as the cursor is moved over the surface. | |||
Select | Click on surface for co-ordinate | Same as Explore | Same as Explore |
Polygon Select | Click on surface to define points for line or polygon vertices Double click to close polygon | Same as Explore | Same as Explore |
Area Select | Same as Explore | Same as Explore | |
Measure | Click and drag on surface to measure distances. | Same as Explore | Same as Explore |
One feature of this interface is the use of the middle mouse button to "pick and zoom". Middle clicking on a point in the scene will move the center of the display to that point. After the mouse click, if the button is held down then the view can be zoomed in by dragging the mouse up or to the right, or zoomed out by dragging the mouse down or to the left. This effectively allows both movements and zooming to be accomplished with a single mouse button. Note that the "pick and zoom" function is available in all modes. Any mouse equipped with a mouse wheel can now use the wheel to zoom in or out of the scene. Rolling the wheel forward zooms in and rolling the wheel backward zooms out.
While in Explore mode, the surface can be rotated by clicking and dragging with the left mouse button anywhere on the Main Visualization Window. However, in the other modes the left mouse button serves a different purpose. The screen can be rotated in these modes by clicking and dragging directly on the rotation widgets, as shown in the Rotation of Surface figure below. When the surface is being rotated around either axis, the corresponding arrow bar will turn blue. Using the widget to rotate the data and then pressing the middle mouse button while still rotating will lock the rotation at a constant velocity. The arrowed bar on the rotation widget will change color from blue to pink to confirm that the rotation has been locked as shown in the two images below.

Rotation of Surface


Rotation Widget Colors
In the images above the left image shows how the widget looks when rotating under user control and the right image shows the widget locked in continuous rotation. Note that the "N" on the rotation widgets indicates which direction is north.
The cone shaped arrowhead at the top of the vertical axes can also be grabbed and dragged up or down to dynamically change the vertical exaggeration of the scene. The value of vertical exaggeration will be shown in the Exag field near the bottom left corner of the screen.
The widgets on the side of the Main Visualization Window may be used to either zoom or translate. Translation moves the surface away from the center cursor and is useful for viewing data away from the main surface such as a hanging sub-surface seismic image.
The widgets have the ability to show a dynamic scale along their axis (see Fledermaus Fledermaus Preferences). The scale is shown along both the vertical and horizontal axis in units of the data set depending on the geo-referencing information. The distances shown are from the center point of the axis. Normally geographic coordinates are automatically projected to meters to give an easily understood distance measurement. As you pan and zoom with the interface the scale will dynamically adjust. The number of labels displayed is minimized so they don't overwhelm the visualization but convey enough useful information.
In addition to the axis labeling, it is also possible to view the compass and declination angles. A label associated with each rotation control will display. The top rotation label displays the compass direction in degrees (0 is North, 180 is South, etc.). The left rotation label displays the view angle to the surface. A negative number, for example negative thirty, indicates that you are looking down on the surface at a thirty-degree angle. A positive angle would indicate that you are looking up at the surface from below it.
Profiling
In the visualization window, clicking and dragging the right mouse button across the scene produces a profile. The profile is displayed in the Profile Dialog shown below. If this dialog is not already opened, it opens automatically when the profile is drawn on the 3D surface.

Profile Dialog
The colors displayed in the dialog represent the color of the surface profiled. The axes are labeled with the height and distance along the profile. The vertical exaggeration, the 2D Distance, and the Surface Distance are displayed in the V-Scale, 2D Distance, and the Surface Distance text fields respectively. As the mouse cursor is moved over the profile, the slope at that point is displayed in the Slope text field.
Clicking the Create Profiler Object will create a Profile Object and load into the Fledermaus Scene. By clicking on the Tools button at the bottom left of the screen, a drop-down menu is displayed with a number of options. Click the Clear Profile menu option to erase the current profile. Click Recompute to recalculate the height of each point along the profile. This option is useful if the scene has changed and you wish to update the profile to the current heights. The Save Profile Image menu item can be used to save an image of the current profile to either a .tif or .jpg file. Click the Save Profile option and select the destination image file and type using the file dialog box. The Export Profile menu item can be used to export a specified sampled number of XYZ points along the profile to an ASCII txt file.
By default each time you drag a new profile the vertical scale automatically adjusts its value. The Lock Scale toggle button locks the vertical exaggeration to which ever value is entered, thus new profiles will maintain the same vertical scale. This option is useful when trying to do comparative profiles. Click the Close button to dismiss the Profile dialog.
Profiling - Pipeline
If you choose Create Profile from a Pipeline object, then an along-track profile and a cross profile will be created.
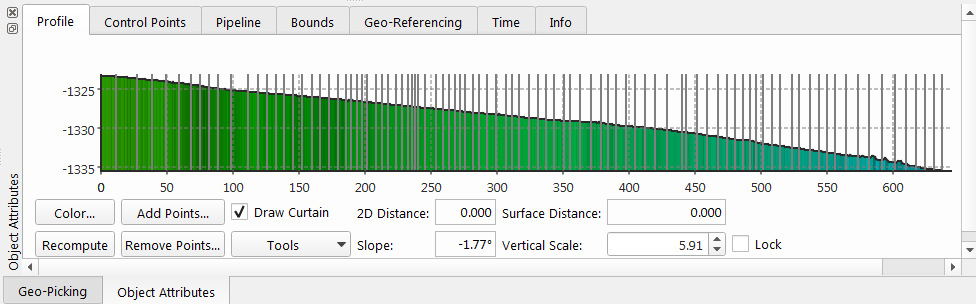
Pipeline Along-Track Profile
Each vertical line in the along-track profile represents a control point on the pipeline.
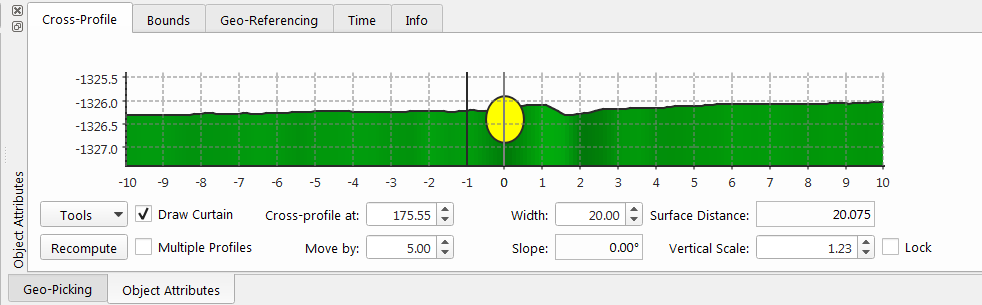
Pipeline Cross Profile
The yellow circle represents where the pipeline lies relative to the surface. The pipeline cross profile is best viewed when the shallow surface is selected because the top of pipe is positioned by referencing the shallow surface. Which surface is used to position the top of pipe is configurable in the pipeline settings. If you chance which server is selected, then you will need to press recompute to update this display.
Drag+Drop
Data can be loaded into Fledermaus by drag and dropping files or a directory directly into the Main Visualization Window. This allows the loading of one or more SD objects or one scene file. This allows the loading of AutoCAD DXF/DWG files. As well as QGF QPS files. Finally, the Batch Import Pipeline Wizard can be launched by drag and dropping a directory.
Return to the Reference Manual