
Introduction
The Point type the can visualize 2D and 3D point data with optional labels attached to them. This object type can be used for many purposes, from labeling points of interest in a 3D scene (which could also be done with the billboards feature) or for displaying a large point clouds. A points object can have any number of attributes beyond just the required x, y, and z values.
3D points can be imported into Fledermaus 8 using the Import > Import Points... menu option.
Storage Format
Fledermaus Point objects are stored in files with the .points extension.
Properties
|
Name |
Description |
|---|---|
|
Point Count |
Shows how many points make up the point object. |
|
|
|
Attributes
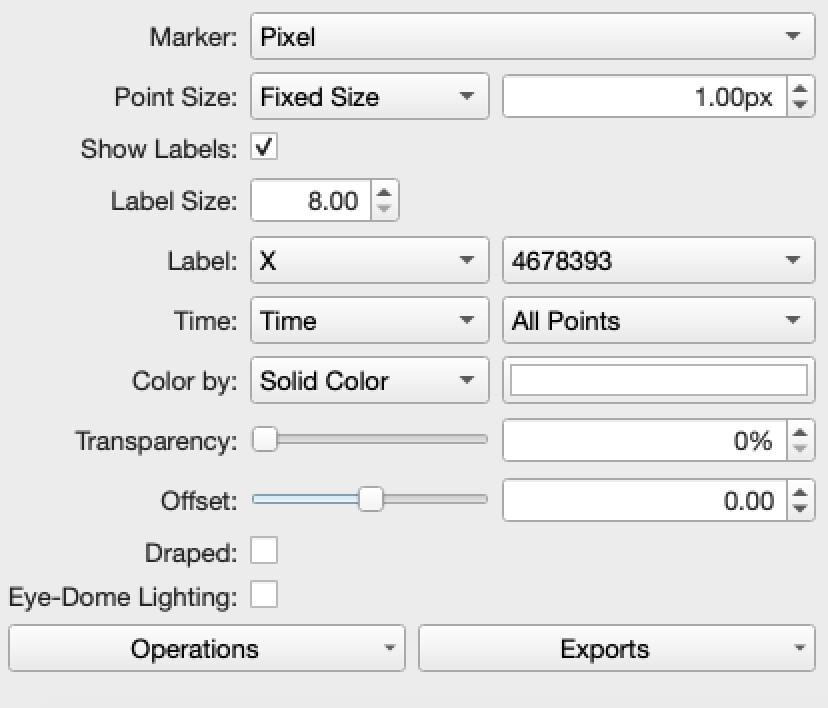
At a minimum point objects have an X, Y, and Z coordinate but they can have many other attributes as well which can include a time field, a label for the point, and other numeric attributes. At the top of the attributes is a choice or marker type to display for each point that can be as simple as a screen pixel, or more complex types including a sphere, Cube, Diamond, Cylinder, 3D Flag, Circle, Square, Crosshair, and None if you don't want to display the point at all. There are a number of ways to control the point size the default Fixed Size option make each point the same size. If the marker type is pixel then the size is how big a point is drawn in pixels. For any of the other marker type the size is in units of data, normally meters. In addition to the fixed size you can have the points depend on one of the other attributes in your table. Any numeric field will be an option to select here and the point will be relatively scaled based on the range of the selected attribute. In this case the size field becomes a scaling factor applied to all the points.
When the Marker is in Pixel mode and Fixed Size is selected, the size field represents the size of the points in pixels. When the size is changed to X, Y or Z, the range of the data is used for the size, and the size field is a multiplier. Furthermore, when the mode is set to one of the point shapes: cube, sphere, etc., the size field represents meters.
Toggling on the Show Labels option will turn on the display of any selected label field. The Label Size controls the size of the text in units of the scene (usually meters). Point objects can have text fields as part of the point data itself but the system can also create labels automatically for display from any selected numeric field which can be selected from the Label drop down menu. To the right of the selected field is a set of formatting options which can be used when numeric fields are specified to set the number of decimal places to show. The Label Size and Label fields will only be shown when the Show Labels option is checked on.
The Time field dropdown menu lets one specify a field to use as time for the point objects or None if there is no time field. Once one depending on the time options dropdown to the right one can choose to show all points regardless of their time, or just the point from the past to the current time set by the time bar, or show only points within a time window around the current time. The time window length is set from the time bars dropdown menu. See here for details.
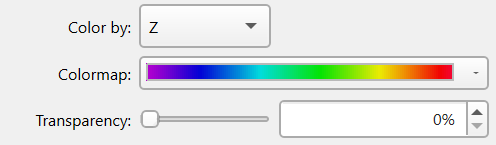
The Color by option chooses how the points are colored with the options available depending on the data. You can always choose to color all the points by a single fixed color, or by choosing any numeric field in which case the color is mapped through the color map to get the resulting color. Finally if the points data contains an RGBA color field then it can be chosen and the point will get the associated color given in that field. When a field is selected to color by then the Colormap widget will be shown to control the color map selection and mapping.
Transparency controls how transparent the points are rendered. Note given points are not depth sorted that effectiveness of rendering the points transparently may be limited especially for large point sets.
The offset is a simple vertical offset applied to the visualization of the points, the internal data is not modified by this offset.
If one ran the Draping operation then a new "Draped Z" field will be added to the point object. When the draped toggle is turned on that field will be used as the z values for the points rather than the normal z field. This is useful when for example you load a set of 2D points and want to drape them on a surface in the scene.
Finally to enable the eye dome lighting algorithm toggle on this option which only applies to the pixel marker type.
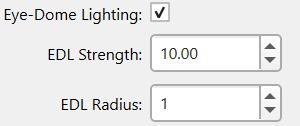
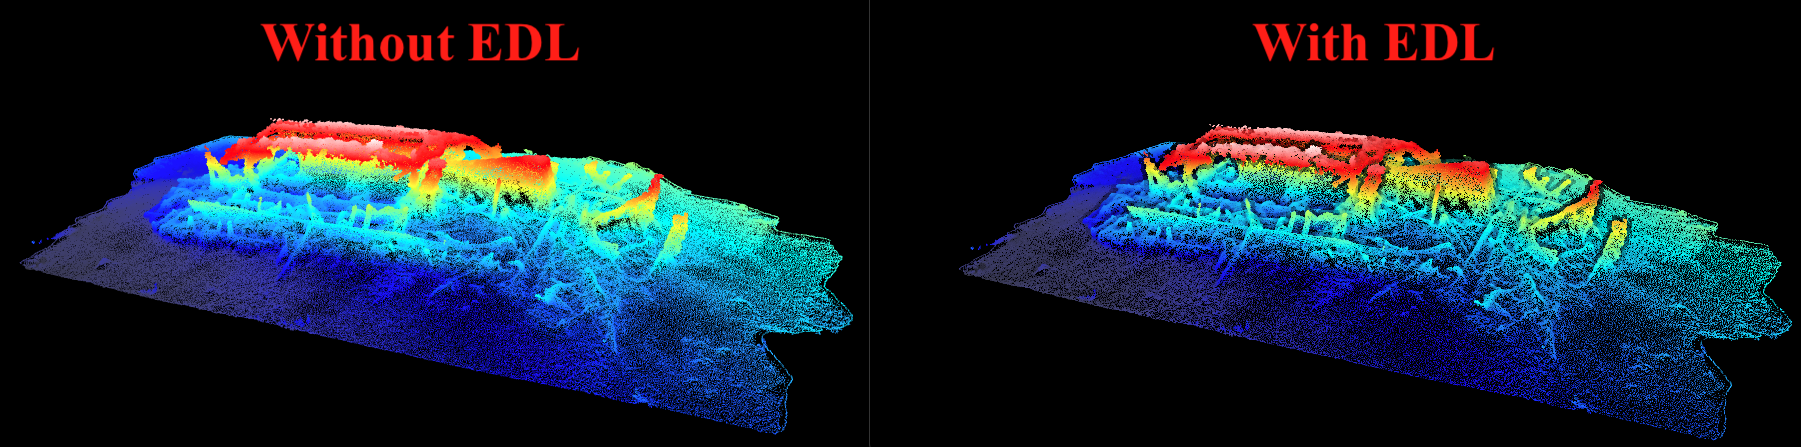
When enabled two extra options are available which control how the algorithm illuminates the points. An example of points with and with EDL applied looks like:
Operations
To see the operations available for the point object type right click the object's name and look in the Operations sub-menu or look at the Operations dropdown menu at the bottom left of the attribute panel. These operations include:
Change Object Coordinate System
While this should be very rarely needed it can be used if necessary to change the coordinate system currently applied to the object. No projection is done here you are just telling it that this new coordinate system is what the object should have been in in the first place.
Reproject Object
Generally there are better ways to handle (re)projection work but if you really just want to convert this surface into a new projection this will work. The Reproject Object option will produce a new surface by transforming the existing one into the new projection you have chosen then adds the result to the current scene.
Reproject Object to Scene
If an object is current marked as Undisplayable in the Scene control dock this is normally because it is in a different projection than the scene is. As surfaces don't dynamically auto-project if you want to see this object in the current scene's CRS than one can use this option. It will result in a new surface being produced that can be displayed in the current Scene.
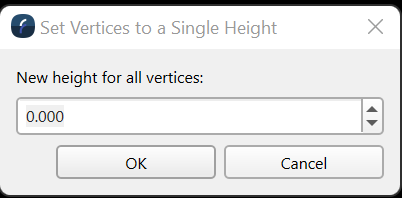
Set All Vertices to a Single Height
This option brings up a simple dialog to enter a desired height (z) value and it will set all points to have that particular height value.
Drape
Attempts to drop the points onto any surfaces currently shown in the 3D scene.
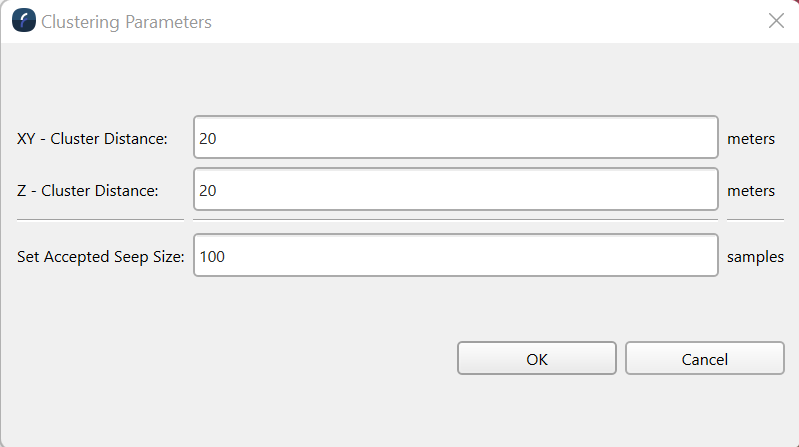
Run Clustering Algorithm
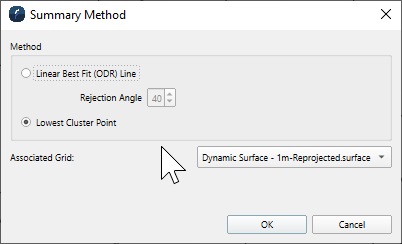
Create A Cluster Summary Object
Export Cluster Information
Filter Clusters
Delete Filtered Clusters
Delete Selected Cluster
Verify Selected Cluster
Create Surface
This operation provides a convenient method to create a surface for any selected point objects. See the gridding documentation for details on making a surface from points.
Create Mesh
This provides a quick way to start the mesh creation process on any selected point object. See the Meshing documentation for details on the processing.
Exports
Export to ArcGIS
Assuming you have the ESRI GIS Engine setup this tool lets you push data into ESRI geodata sets. The tool is described in detail here.
Export to Google Earth KML
Exports the point data to a Google Earth KML file which can be easily loaded into Google Earth. Click here for details.
Export to XYZ File
Gives you an option to export the points to a basic ascii XYZ file.
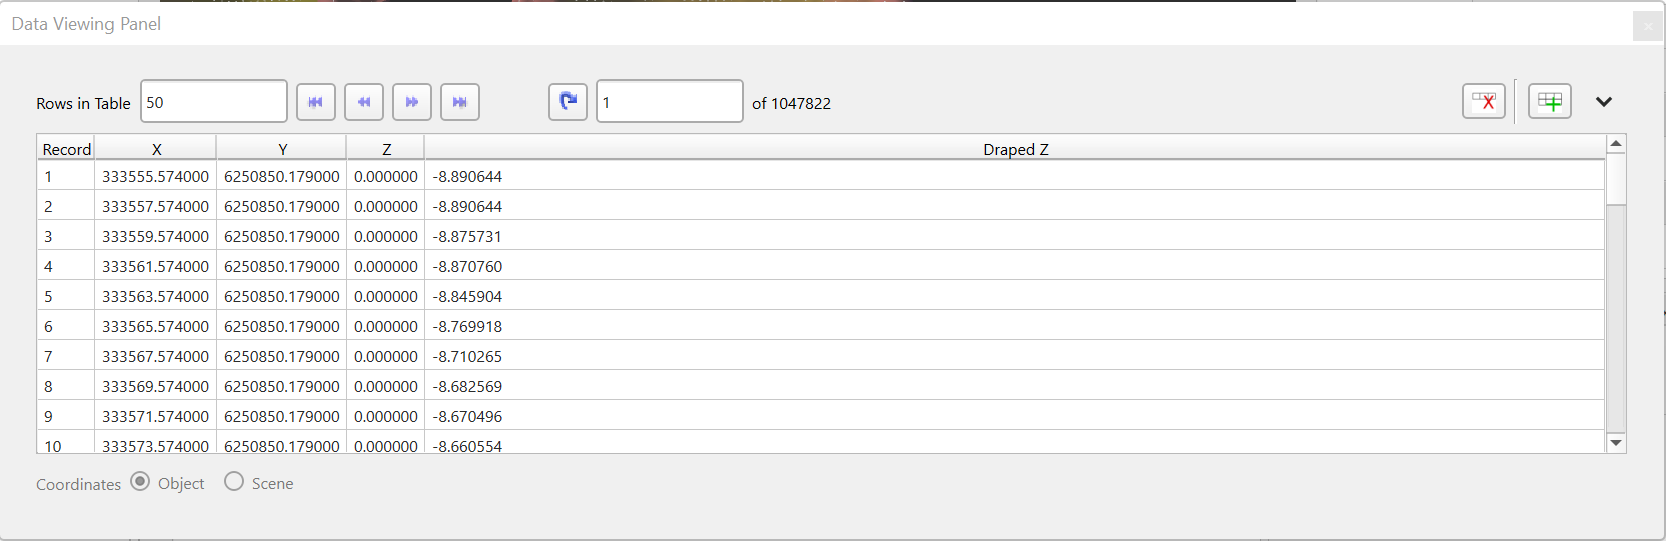
Data Viewing Dock
When you select a Point object the data viewing dock will be automatically filled with a spreadsheet like viewing window into the point data. Only a small portion of the data will be loaded but all the attributes of each point will be shown and the tools at the top left let you walk though or jump to various parts of the point set as shown below. Click here for more details about the data viewing dock.
Return to Fledermaus Visual Objects
Return to Fledermaus Reference Manual