
This document outlines the steps involved in setting up a BHD operation.
Setup and Interfacing - Database Setup Program
There is considerable variation in how a BHD dredger is configured in terms of sensors used, and whether all or some of the sensor data is read by Qinsy directly from the sensors themselves as opposed to being delivered via the dredger's PLC.
Depending on your particular configuration there may not be a need to add ALL the Objects and Sensors covered in this section.
Nor do you need to adhere exactly to the order of actions laid out below. For example you can define all the sensors and variable nodes on one object before creating the next object.
The following presents one configuration which should provide sufficient guidelines to cope with alternative setups.
It is assumed that:
-
a template database with Geodetics has been created, including a Mean Water Level Model, leaving the definition of objects and systems to this Quickstart.
-
Geodetics have been tested using the Geodetic Parameters utility.
-
all on board offsets from the dredger Reference Point

Objects


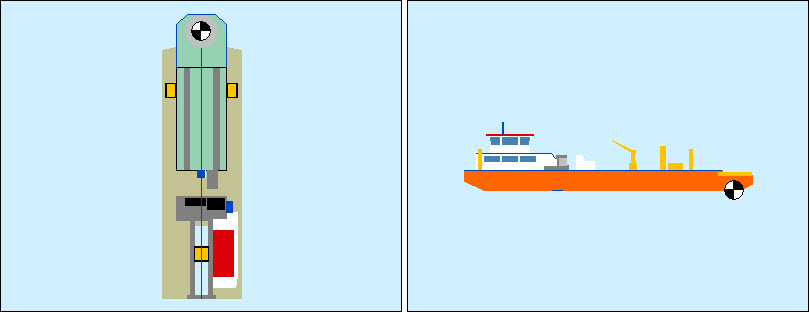
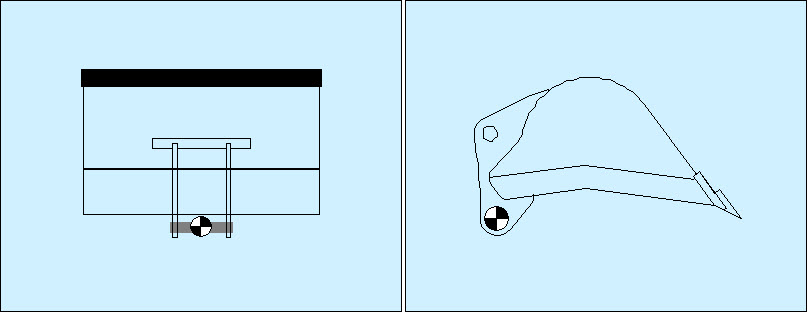
Add a Pontoon Object, type Vessel, locating the object reference node (CoG) in an appropriate place.
In our example this is located at keel level directly under the backhoe's rotation point.

Define a Pontoon shape from at least a top view perspective, and a side profile perspective.
An aft view may be useful.
How detailed to make the object shape is a personal choice.
Remember the option to import a 3D DXF file.


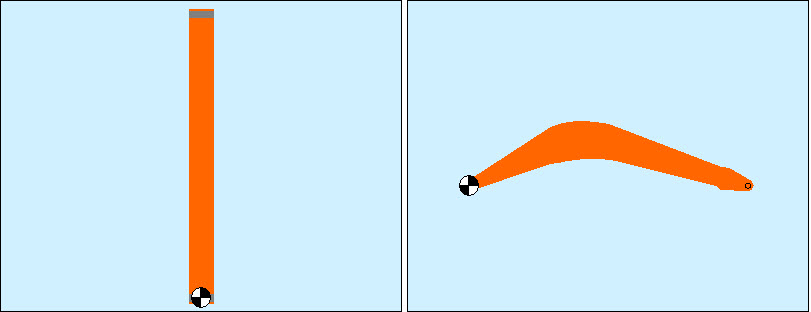
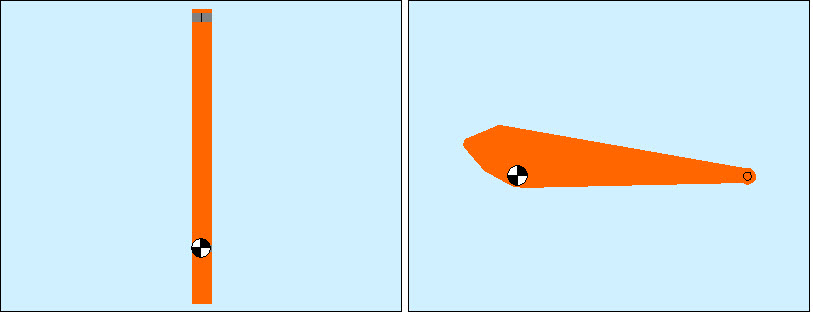

In this case at the bucket rotation point.
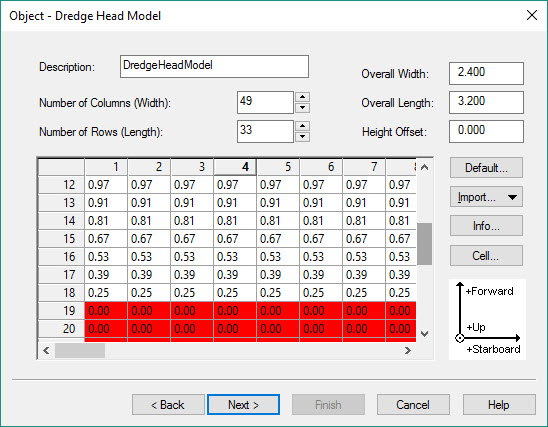
In essence the dredge tool is defined as a matrix of pseudo-singlebeam echosounders, one for each cell of the matrix.
Therefore you must enter the number of rows and columns, and the actual overall width and length of the head.
Use the 
Define the maximum Z, which is the distance from the CoG
In our example, the knife edge and CoG
A model is created in a spreadsheet type format. Each cell is then treated as a pseudo-echosounder which is used in updating the sounding grid during dredging operations.
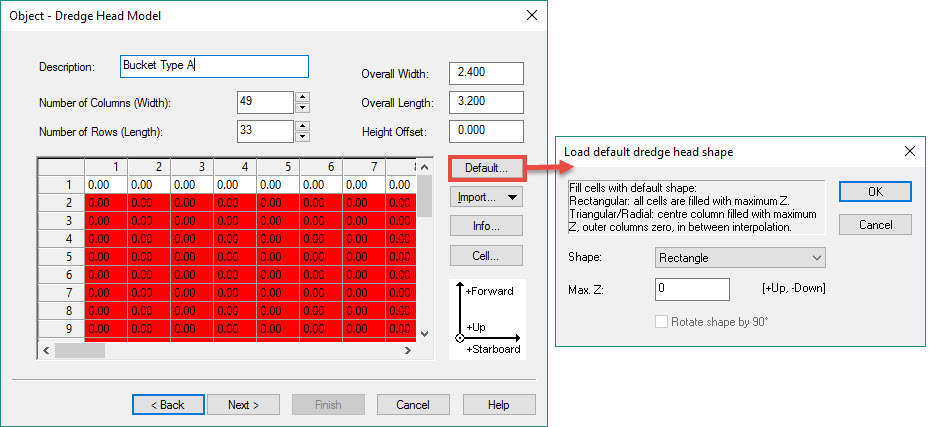
The objective is to enter a height into each cell that represents the distance above (+ve) or below (-ve) the Bucket's CoG
The center cell (green color) of the grid becomes the reference point that is linked elsewhere to a defined variable node, e.g. CoG
Not all cells need be used in the calculation. In the example only the knife edge cells are enabled, all other cells disabled (red color) and are not used in updating the sounding grid.
The usefulness of defining all these objects is determined by whether the appropriate observations are available to the software in order to calculate the position and orientation of each object.
Frequently most of the sensors needed to position the various objects are interfaced directly to the dredger's PLC.
Refer to: BHD - Positioning Dredge Bucket.
Potentially sensor values can be output to the software thereby allowing computation of position for each object and hence display of the various objects for visualization purposes.
In many cases dredge tool 3D position is computed by the PLC and output as dX/dY/dZ values relative to the vessel reference point (
In other words they are pseudo-USBL measurements that the software uses to display dredge tools in their proper locations.
If observations needed to compute 3D bucket position are just not available, you may only be able to display the pontoon or backhoe itself and the bucket object.
Object definition supports visualization in a 2D sense (Navigation and Profile Displays).
For 3D visualization in the 3D Grid Display, obtain, or create, a 3D Direct X file (*.x) for each object.
These files are selected directly in the 3D Grid Display, not in Database Setup program.
Return to: top of page.
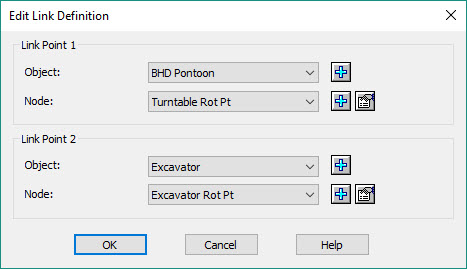
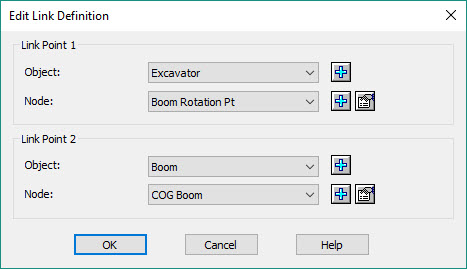
Object Links
In the real world the various objects are physically linked, e.g. backhoe to pontoon, boom to backhoe etc..
The next step is to create these links in the software.
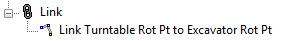

If the pertinent variable nodes are not yet defined, you will need to define them on each object before creating the links.
This can be done via the 
The link between the Pontoon and the Excavator is shown below:
And a link from the Excavator to the Boom:
Return to: top of page.
Sensors
Dredge Vessel

Add a variable node


Choose the driver and add a variable node

For example: fore and aft draft sensors.
Add new node(s)

Dredge Tool positions are sometimes output from the dredger's PLC in USBL format (dX/dY/dZ).
These observations are often relative to the pontoon's Reference Point (

Add one or more of these observations depending on the data being received from the PLC or directly from the sensors:
Production volume is not calculated for backhoe dredgers.
The most likely observations to be used are Flag and Status.
Make sure to enter the correct slot identifier values. For example:
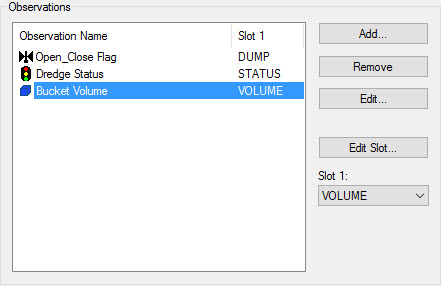
If data input includes triggers (zero or 1) for conditions such as Excavating or Dumping add one or more Flag observations.
Typically the trigger is output by the PLC but a trigger may also be generated when connected to switches or push buttons used to trigger such items Dumping/Backfill.
The Manual Switch Driver document describes how to set up this scenario.
Refer to the Drivers & Interfacing Manual for driver descriptions and set up information including SLOT identifiers.

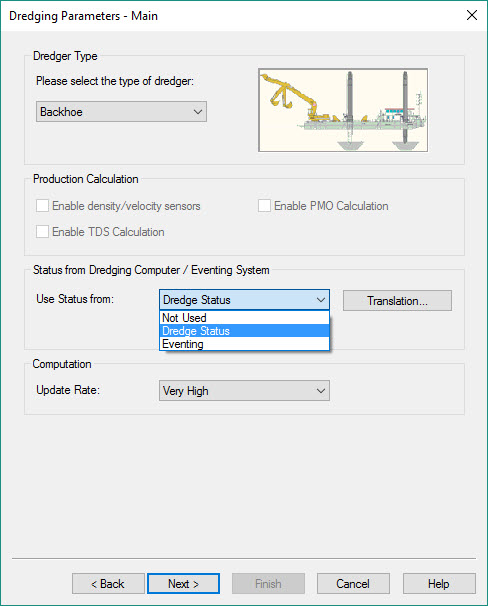
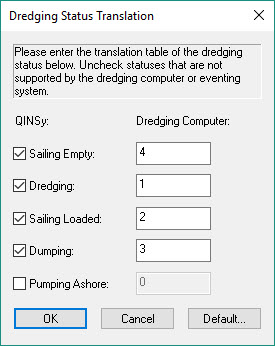
If dredging 'Status' is received from the PLC and used in Qinsy, select that option and establish the 'Translation' table to decode the correct status.
For example:
The Eventing System can also be used to establish status.
Set the Update Rate to Very High.
Set parameters for positioning and backfill:
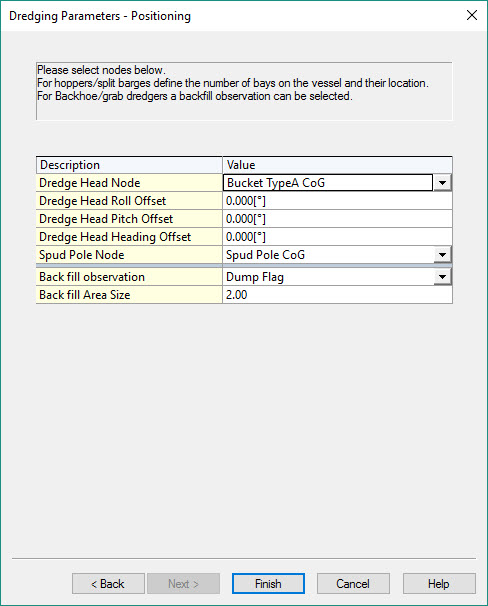
Dredge Head Node: this is the node to which the dredge head model matrix is connected.
In the dredge head model matrix this is the center, indicated with a green cell on the dredge head model page.
Return to: top of page.
Backhoe

This assumes that observations are available to the software, either from the PLC or interfaced directly. These could be:
Vertical Position
-
Inclinometers to measure Boom, Stick and Bucket pitch.
-
Motion Reference Units to measure Cab attitude.
The vertical position of the Bucket can be checked / calibrated by .......................
Horizontal Position
-
Rotation angle sensors, designed for rotations in the horizontal plane.
An angular position sensor (also referred to as a rotary sensor) measures the relation by which any position with respect to any other position is established. It calculates the orientation of an object with respect to a specified reference position as expressed by the amount of rotation necessary to change from one orientation to the other about a specified axis.
Refer to: HD - Positioning Dredge Bucket.

Often this is a dual antenna GNSS providing both position and heading.
Define the Nodes for primary and secondary antennas.

This provides the horizontal angle of the Cab with respect to the Pontoon.
Define the node at which the sensor is located.

Define the nodes at which the sensors are located.
When the PLC outputs dX/dY/dZ observations that measure the offsets from the vessel Reference Point (
Return to: top of page.
Output Systems
Output systems are defined in a single page dialog box, requiring only a system type, a driver and network or serial interfacing details.
Positioning, Heading and Motion
Depending on the how the hardware interfacing is configured it may be necessary to define one or more data output systems.
For example, when positioning, gyro and motion sensor systems are interfaced directly to Qinsy, sending that data to the PLC may be required.
Generic Output (User-defined ASCII)
Whereas predefined output drivers send data in specific formats, there may be instances where the dredging computer (PLC) expects to receive data in a specific format not covered by existing Output Systems.
In those cases the Generic Output (User-defined ASCII) driver may be used.
The template database setup is simple: System Name, System Type: Output, Driver, and network or serial interfacing details (Serial, TCP, UDP).
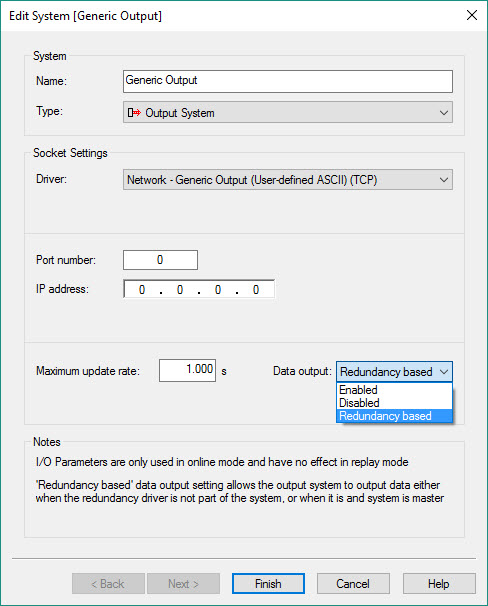
Note the option to select 'Redundancy based'. See Redundancy Monitor.
When the Controller is started, the Generic Output icon 
Use the Add button in the dialog box to create the Generic Output content.
Please refer to the for detailed information about this utility.
Generic ASCII Data Logger (Controller)
In cases where ASCII data must be written to a log file in a specific format, the Generic ASCII Data Logger driver may be used.
The template database setup is simple: System Name, System Type: Output, Driver, and network or serial interfacing details.
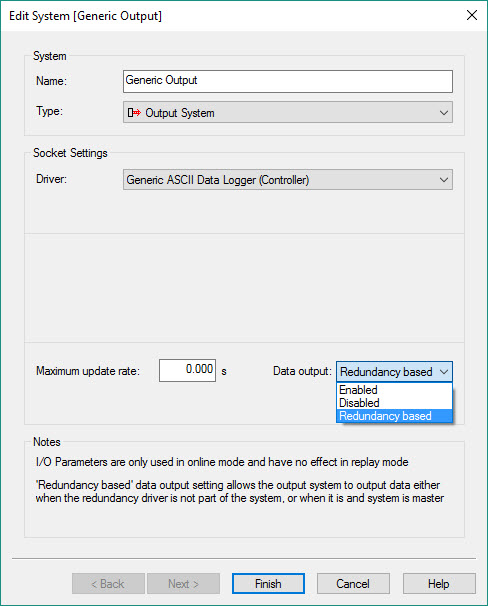
Note the option to select 'Redundancy based'. See Redundancy Monitor .
The XML file, in which the output content and format is specified, is created using the Generic Layout Editor, started from the 
Please refer to for detailed information about this utility.
Return to: top of page.
Auxiliary Systems
Tide
Choose a driver and enter serial or network interfacing details.


-
a name
-
the coordinates of the station
-
the horizontal datum
-
station height
-
instrument height
-
and, most importantly, the Vertical Datum.
Time Synchronization
Perhaps not as critical in dredging operations, it may still be useful to define a system.

This is a hardware device manufactured by QPS for converting a TTL or CLS pulse to an RS232 compatible signal.

Miscellaneous System
-
A number of Miscellaneous System drivers are predefined in terms of what they will decode:
For example:
Nortek Vessel Mounted Current Profiler:
Decodes current speed and direction. Used when dumping.
-
Others allow you to add user-defined observations and slot identifiers to match those in the received data string.
For example:
Generic Serial Input
Manual Miscellaneous Input
OPC Interface
The purpose of this driver is to perform an election process which decides which Qinsy system is the primary system for data output.
Typical use for this driver is on a larger vessel when there are multiple Qinsy computers that are part of the same network and only one computer should output data to external systems. Each Qinsy computer needs to have the driver running and correctly configured. The driver will make sure that there is only one Master Qinsy computer and this Master can be the only system to output data.
Continue to: Create Sounding Grid and Import Design Model
Return to: top of page
Return to: Quickstart - BHD