Getting Started
Getting up and running with FMGT begins with the creation of a Project. FMGT projects allow you to manage your data processing flow and preserve any processing steps that you have already accomplished. In order to give context to the following sections of the reference manual, we will first go through a typical processing scenario using an EM3002 survey of Little Bay in New Hampshire.
Step 1 – Create the Project
Use the File Menu to create a new project using the Create Project Dialog as shown below. By default, the folder for your project will be in the '/Users/username/FMData/Projects' directory. The created project will contain sub-folders for storing interim processing data as well as created visual layers. The complete directory structure is described in detail in the FMGT - Create Project section.
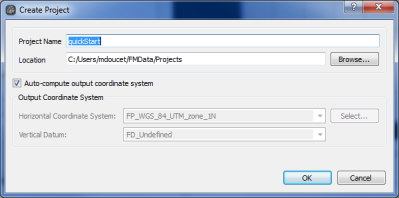
Create Project Dialog
Step 2 – Add Source Files
FMGT corrects multibeam time series data by using the associated processed bathymetry for the associated beams. To accomplish this, FMGT has two primary processing paths that support file formats containing both processed bathymetry as well as backscatter time series data. These formats are the .all and .gsf. Other file formats as defined in section Supported Data Formats Section. are supported by "pairing" data and generating a new GSF file which is then used for processing through FMGT. For this demonstration we will use .all files.
To add source files, use the File Menu->Add Source Files option to select files for processing. The user will then be presented with the wizard dialog show in the figures below.
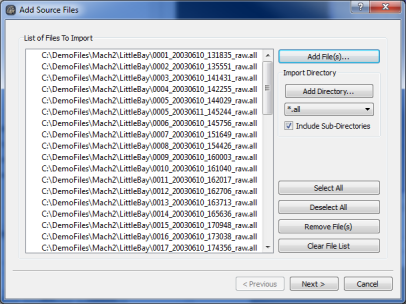
Add Files Wizard, Page 1
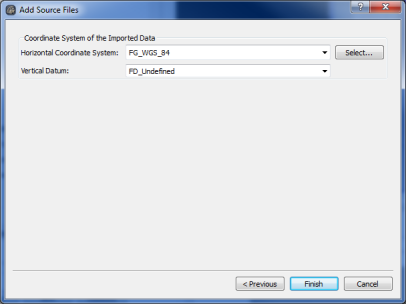
Add Files Wizard - Page 2
The first page of the dialog lets you select a list of files or a directory containing your files. If you select a directory, the directory hierarchy, including sub-folders, will be reflected in the project tree view as well as all of the processing output folders. This is explained in more detail in the Create Project section.
The second page of the wizard allows you to select the coordinate system for the navigation of the input files. In our example, this is simply geographic, WGS_84.
After selecting Finish, FMGT will perform some preliminary processing that is required to proceed to the actual backscatter processing stages. FMGT will first index the files as shown in the figure below.
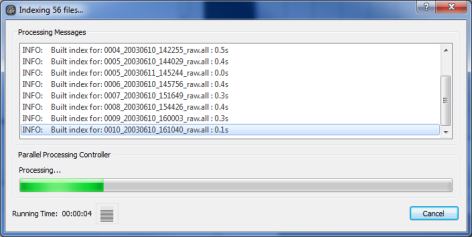
File Indexing
File indexing allows FMGT to access all datagram packets within a file in a non-linear manner. This allows FMGT to process any part of a file without first having to read all of the packets that came before. File indexing only occurs once unless the index cache is deleted (see Preferences for details).
FMGT will then extract the metadata from each line as shown in the figure below. The metadata includes information such as file geographic extents, datagram packet numbers, sonar modalities and sonar type.
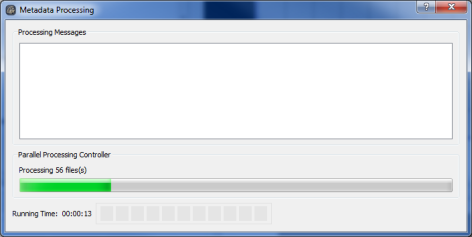
File Metadata
After the metadata is extracted, FMGT will compute the coverage and extract the navigation of each line as shown in the File Coverage figure. Finally, a visual representation of each line swath is created as shown in Swath SD figure for display in the FMGT MapView (Files Loaded figure).
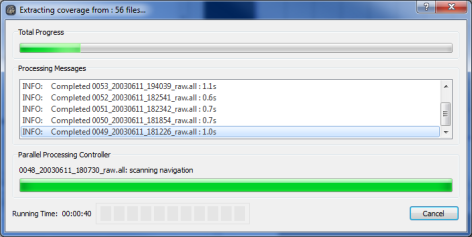
File Coverage
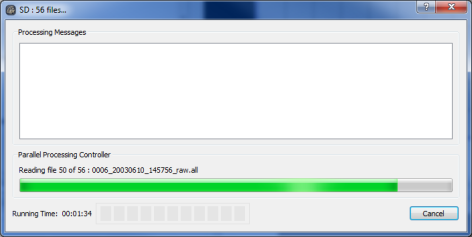
Swath SD
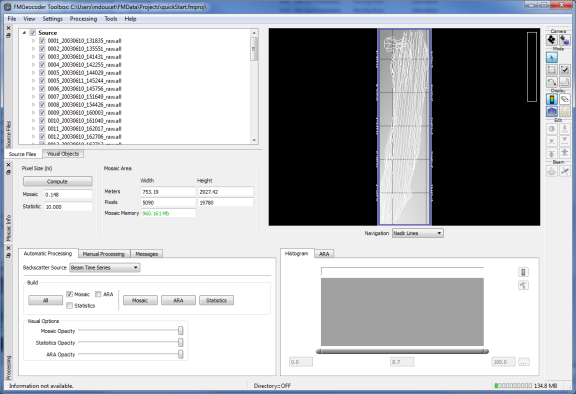
Files Loaded
As you can see, the files that were loaded appear in the Source Files tree view. The checkbox next to each file serves a dual purpose. The first is to determine if the object is to be displayed in the map view. The second, for source files, is to determine if the file is to be used for any selected processing. This is a key part of FMGT's workflow. If a source is checked, it will be included in any processing. If not, it will be ignored. You have many ways to check/uncheck files either using the Check Select tool or the context menu "Check…" options. These are described in detail in later sections.
Step 3 – Process the Data
Processing data loaded into FMGT can take two paths. The first way is to use the Automatic Processing tab of the processing panel to select the desired output products and simply click on the All button in the Build section of the panel. The second is to use the Manual Processing tab. For our example, let's start by clicking on the Mosaic button of the Build group on the Automatic tab.
FMGT will first adjust the backscatter data by performing backscatter extraction then radiometric corrections based on sonar type and bottom topography. As this stage progresses (Backscatter Processing figure), it will persist the results of the backscatter adjustment to the project hierarchy.
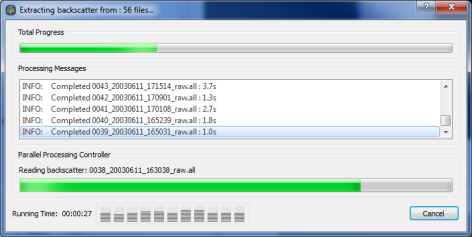
Backscatter Processing
Next it will perform Filter processing which includes angle varying gain (AVG) adjustments as well as anti-aliasing of the backscatter data. As this stage progresses (Filter Processing figure), it will also persist the results of the backscatter adjustment to the project hierarchy.
Finally, FMGT will begin to create the desired mosaic as shown in the Mosaic Processing figure. It will use the resolution as indicated in the Mosaic Info panel. For our example, this is ~15cm. This value is pre-computed by FMGT during coverage processing and is an estimate based on the sonar beam configuration and along track coverage. This value can be overridden at any time.
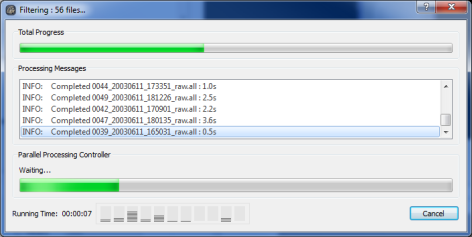
Filter Processing
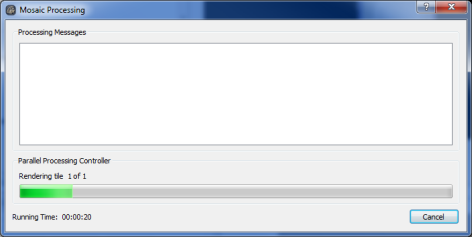
Mosaic Processing
Once complete, the mosaic will show up in the map view. If you click on the Visual Objects tab of the Tree View, you open up the mosaic layer and see that it consists of one tile (Mosaic Visual Layer figure). Survey areas can be tiled to allow for maximum resolution of backscatter mosaics over large areas.
You can also choose to display no navigation lines by selecting None in the Navigation combo-box directly below the map view. Alternatively, you can uncheck the root Source node in the Source Files tab of the Tree View. Navigation in the map view works exactly like DMagic. You can use the mouse wheel or track pad to zoom in and out and left-click-drag to pan around the view.
Once zoomed in, you can use the histogram control to change the contrast stretch over the image as shown in Mosaic Layer Zoomed to increase the contrast quality of the mosaic. Left-click/right-click in the histogram control or click-drag the ends of the composite control slider to set the range of data to be stretched over the full color map.
Using those simple steps, you now have a mosaic that you can export to other formats or you can simply save all of your visual elements as a scene and import directly into Fledermaus.
As you move your cursor over the map view, you will notice that the status bar updates to display the current position as well as the current backscatter value of the point under the cursor. This is important as the status bar can relay different information based on which layer is currently being viewed.
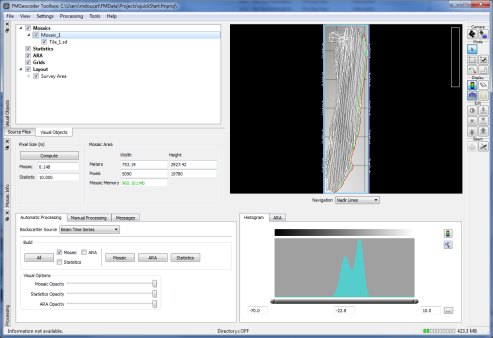
Mosaic Visual Layer
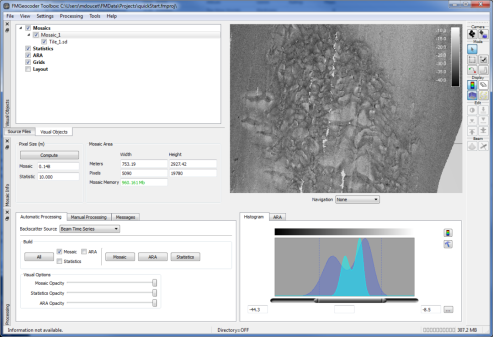
Mosaic Layer Zoomed
Let's now perform statistical processing of our data (Statistics Processing figure). Statistics are performed on the backscatter values for each beam that falls within the statistical grid cell. Since FMGT maintains interim data on all processing stages, this will proceed very quickly. Simply go back to the Automatic tab of the Processing panel and click on the Statistics button. The statistical grid resolution has already been computed according to the mosaic resolution but you can override this at any time. By default it is 20 times the resolution of the underlying backscatter mosaic. For this example, the statistical grid resolution is 10 meters.
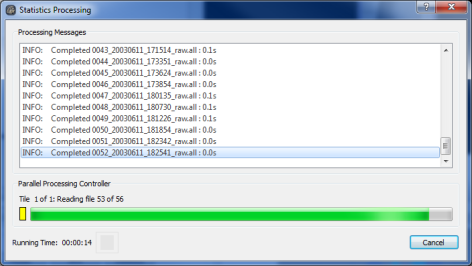
Statistics Processing
After completion, the statistics layers will appear in the Map View as shown in the Statistics Layers figure below . As you move the cursor over the map, the status bar will update to show you the current statistical parameter value. You can change layers by simply clicking on the checkbox of one of the other layers. It will automatically uncheck the previously selected layer.
You can also use the Opacity sliders to blend your layers together at any time. For example, changing the opacity of the statistical layer allows you to view corresponding features in the backscatter as shown in the Transparent Statistical Layer figure below.
Finally we can create the Angle Range Analysis (ARA) layer. Using the Automatic tab of the Processing panel, simply click the ARA button in the Build group box. ARA processing benefits the most from multi-core processing and scales almost linearly as you add processing cores. If you plan to do much ARA processing, a recommendation is to purchase a machine with as many cores as possible. As ARA processing progresses (ARA Processing figure), the results are persisted in the project.
NOTE: For the best ARA results, data collected with wide swath angle coverage is required.
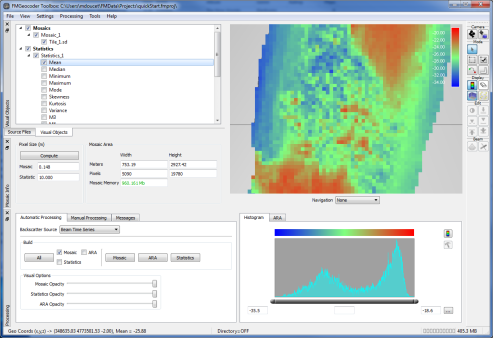
Statistics Layers
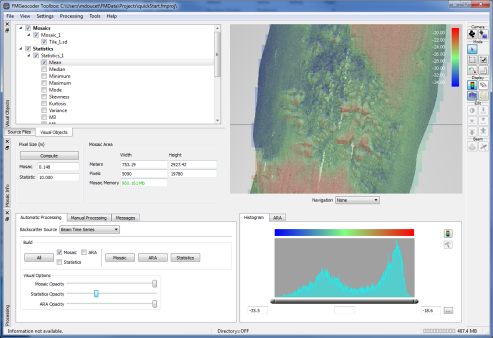
Transparent Statistical Layer
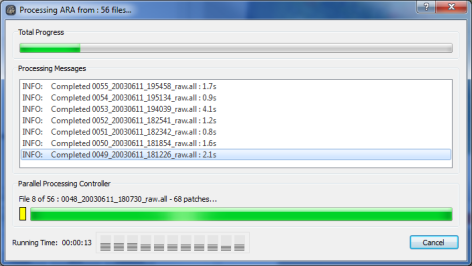
ARA Processing
Once ARA processing is complete, an ARA surface is created that reflects a "rasterized" view of the overlapping ARA patches. Each side of a patch, port and starboard, contains 30 pings by default.
The rasterization process for the ARA surface uses the computed patch polygons to ray-trace the component beams from those 30 pings into cells that are the resolution of the statistical surface. The beams use their computed patch information to add to the overall values for the grid cell. This creates 'weighted' average values for all aspects of the ARA results in the new ARA surface. This provides a better representation of the effect of overlapping patches.
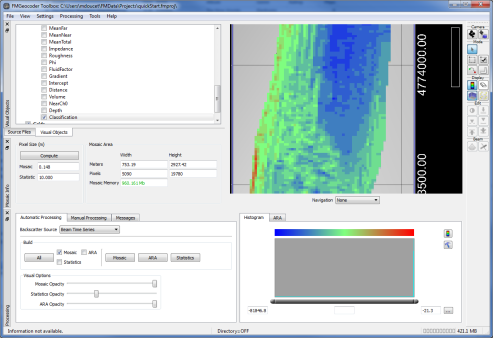
ARA Visual Layer
In the same way that you could select individual parameter layers of the computed statistics, you can easily change the currently viewed parameter by checking the appropriate layer checkbox. Also, you can change the transparency of these layers as well so that you can better correlate underlying features of the backscatter mosaic.
Finally you should remember that all of these layers could have been created at once by simply checking the desired products in the Build options group and clicking on the All button.
Under normal workflow circumstances, when processing large data sets, you may want to start working on a smaller part of the survey area in case you need to make adjustments to either the beam pattern or processing parameters before proceeding to process all of the data. See the Processing Panel section for more information on optimizing the workflow.
Step 4 – Exporting Data
To export a visual layer, simply right click on the layer in the tree view and select the export option from the context menu as shown below.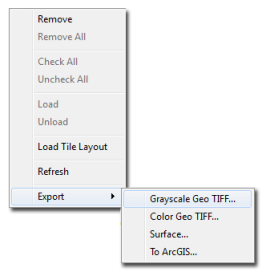
Visual Layer Export Menu
You can also save the project as a Fledermaus scene by use the File->Save as Fledermaus Scene option. Then simply load this scene into Fledermaus to use the created mosaic for draping on existing bathymetry.
Return to: Reference Manual
