FMGT - Processing Panel
The Processing Panel of FMGT is the primary control over all processing of the user source data. It is divided into Automatic and Manual processing. Automatic processing requires the least user interaction as it runs all stages of backscatter processing through generation of specific output layers. Manual processing provides the user with finer control of specific processing stages of FMGT. Both of these paths are defined in detail in the following sections.
Automatic Processing Tab
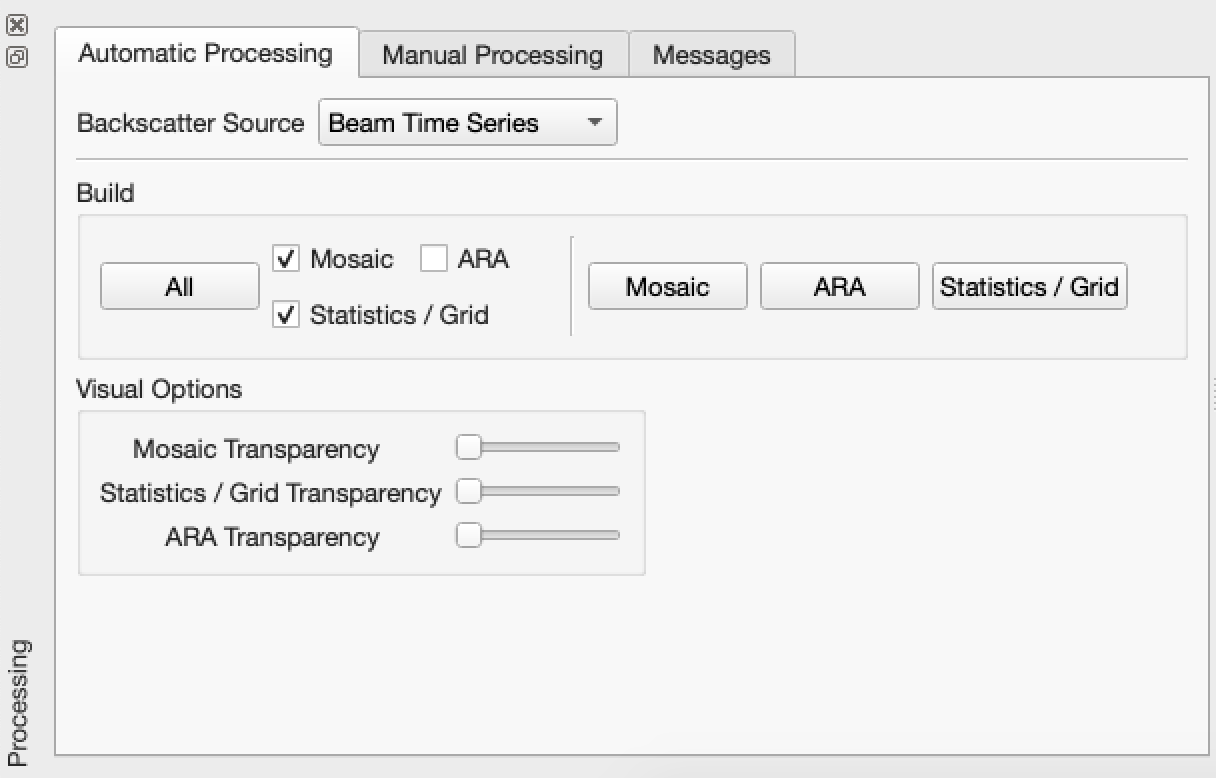
The Automatic Processing tab provides the simplest way to get to an output product. As shown in the Automatic Processing Tab figure.
Automatic Processing Tab
The build All button will run all required processing stages and create the output layers that are selected by the checkboxes. With this single button, FMGT can run all processing and produce a mosaic layer, statistics layer and ARA layer for the active lines of the project.
The individual build Mosaic, ARA and Statistics buttons will perform all required processing stages and produce the specified output layer.
The Backscatter Source combo box is representative of the contents of the loaded files. By default, if FMGT loads files with Beam Time Series data, this will be the primary option selected regardless of other modes such as Beam Average. If the user changes the backscatter source, the entire processing pipeline must be done again. See the following section on manual processing to see how to accomplish this.
The Visual Options section of this tab allows the user to control the opacity of visual layers within the Map View. This allows visual correlation between characteristics of different output layers. Changing opacity for a layer type changes the opacity for all layers of that type.
Manual Processing Tab
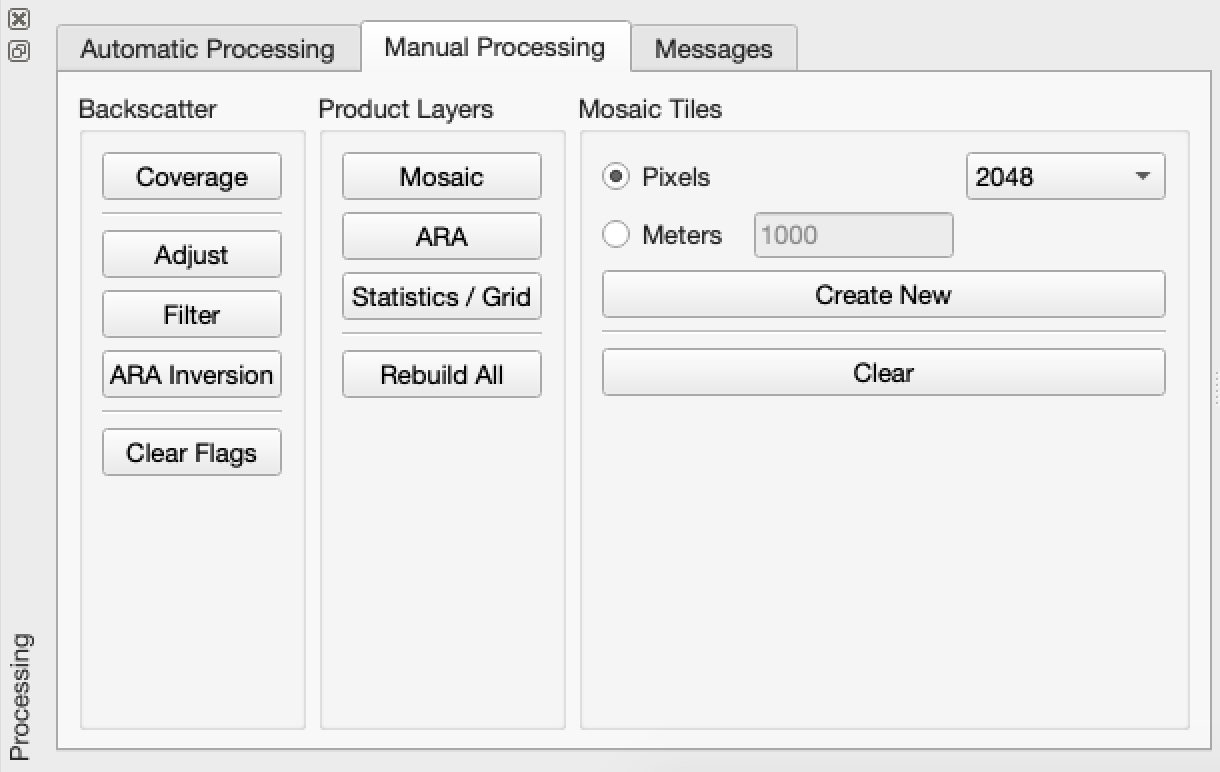
The Manual Processing Tab shown in the Manual Processing Tab figure provides direct control over specific stages of the FMGT processing pipeline as defined in the Generic Processing Pipeline figure.
Manual Processing Tab
Backscatter Processing
The Backscatter group of buttons provides direct control over the backscatter processing stages. These three primary stages, Adjust, Filter and ARA Inversion are cascaded in that they depend on the previous stage being accomplished first. However, whenever a button is pressed on this tab, FMGT will determine what needs to be accomplished first by interrogating file state flags of each active line. It will then perform the required processing before moving on to the user activated processing.
Before selecting any of the manual processing stages, the user must first clear the associated processing flag. Clicking on the Clear Flags button will display the Clear Flags Dialog as shown in the Clear Flags Dialog figure.

Clear Flags Dialog
Product Layers
The Product Layers group allows the user to initiate generation of specific product layers. This works the same way as the Mosaic, ARA and Statistics buttons on the Automatic tab.
Mosaic Tiles
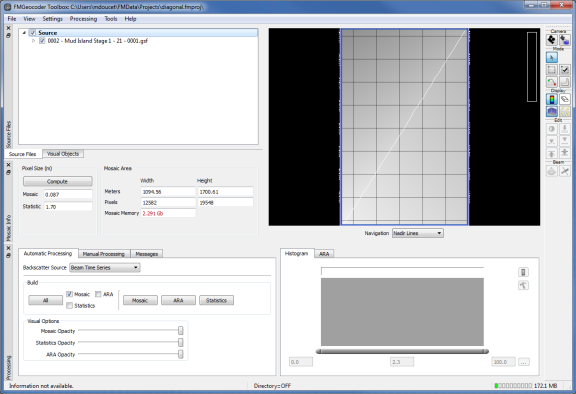
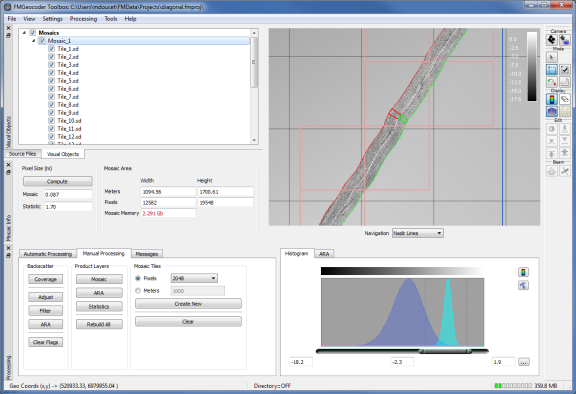
By default, all visual object layers are created as a single tile whose bounds equal either the total survey area or a user defined selection area. For very large surveys, the tile size may be too large to fit into memory at full resolution. Sometimes the survey may not be large but the layout of the survey lines run diagonally across the survey area as shown in the Diagonal Survey Line figure.
Diagonal Survey Line
If the user tried to build a mosaic of this size and resolution (~8cm), the required memory size required for processing of the tile would be 2.91 GB as shown in the Mosaic Memory text field. The on disk memory for this single tile would be approximately 500 MB.
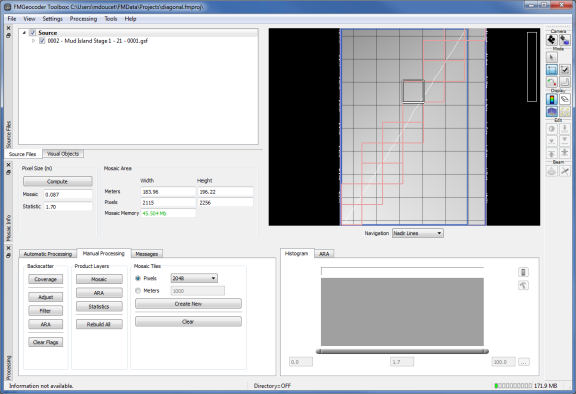
If you create a default tile layout of 2048x2048 pixels, FMGT will create the tile layout shown in the Tile Layout figure which spatially allocates tiles of the desired size along the track line.
Tile Layout
By using the selection tool the user can see that the tile size requirements have been reduced to ~45 MB. After clearing the selection and clicking on the Mosaic button, FMGT processes the backscatter and renders the 18 tiles of the layout as shown in the Rendered Tiles figure. The total on disk memory for all 18 tiles has been reduced from an initial 500 MB down to 150 MB while keeping the maximum possible resolution of the data.
Of course the user could easily select a lower resolution for the output mosaic but this demonstrates FMGT's ability to spatially manage large or high resolution data sets through the addition of tiled mosaics.
Rendered Tiles
To clear the tiles and select a new tile size, simply change the tiling resolution and click the Create New button again. If the user wishes to go back to using the survey bounds, simply click the Clear button.
FMGT's rendering engine will use the tile layout, survey bounds or area selection as the target for all mosaic output. Statistics and ARA surfaces cannot be tiled. They will always use either the survey bounds or the current selection area. Typically, the larger resolution of these surfaces precludes their need for tiling. If FMGT cannot allocate a statistics or ARA surface, you must change the resolution until FMGT can properly allocate the surface.
Messages Tab
The Messages Tab will display all processing messages as well as warnings and errors that occurred during any processing stage as shown in the Messages Tab figure. You can clear this list by clicking on the Clear button. At this time, FMGT does not persist this data between project sessions. If want to save it, you will need to copy and paste it into a text document.
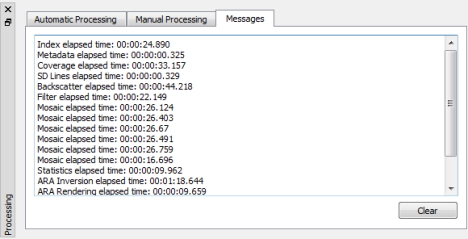
The tab also displays information about the current patch that a user selects in the map view and will report information about the selected ping such as:
Line name
Ping number
ARA patch number
Power
Gain
Pulse width
Spreading
Absorption
Sound speed
Sonar mode (Kongsberg EM710, EM302 and EM122 only)
Mean ping backscatter
Difference between mean ping backscatter and previously selected ping's mean backscatter
Messages Tab
Histogram Panel
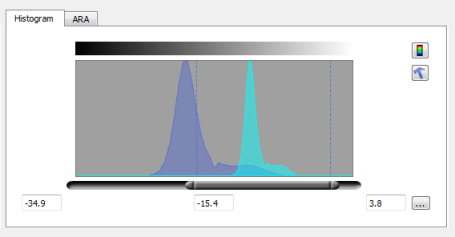
The Histogram Tab contains the Histogram Control shown in the Histogram Control figure, which displays the data histogram for any of the selected visual layers. The left and right text boxes show the currently selected range of the data. The center text box shows the value of the data for the current cursor location when over the control. To change the range, use the composite control by click-dragging on either end, or simply left or right click in the display to set the minimum and maximum desired value.
Histogram Control
The Histogram control will stretch the selected data range over the full color map. This provides a quick and easy way to do a contrast stretch for gray-scale backscatter data.
Click on the Color Map tool button 

ARA Panel
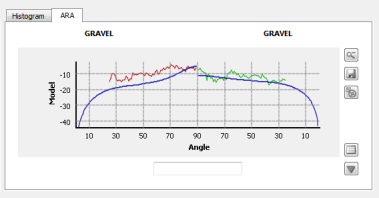
The ARA Tab contains the ARA Control shown in the ARA Control figure. It displays the backscatter plots for the currently selected patch. If the user has run ARA Inversion, the model curve (in blue) will represent the current class for each side of the patch. If the user has not run ARA Inversion, they can use the Quick Modeling tools by clicking on the show/hide tool button 
ARA Control
This will bring up the quick modeling tools shown in the ARA Quick Modeling Tools figure which are a subset of the tools the user gets when accessing the full Patch Analyzer.
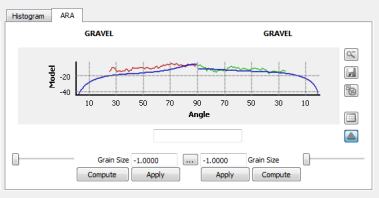
ARA Quick Modeling Tools
The user can use the grain size slider to try to fit the modeling curve to the observed data or click on the Compute button to have FMGT do the modeling automatically. To preserve the results, simply click on the Apply button for the side of the patch that was changed.
Click on the Patch Analyzer tool button 
See the Plotting Widgets section for information on how to use the plotting tool buttons.
ARA Characterization
1 = "GRAVEL",
2 = "GRAVELLY COARSE SAND",
3 = "COARSE SAND - SANDY GRAVEL",
4 = "COARSE SAND - GRAVELLY SAND",
5 = "MEDIUM SAND - GRAVELLY MUDDY SAND",
6 = "MEDIUM SAND",
7 = "FINE SAND",
8 = "SILTY SAND",
9 = "MUDDY SAND",
10 = "VERY FINE SAND",
11 = "CLAYEY SAND",
12 = "COARSE SILT",
13 = "SANDY SILT",
14 = "MEDIUM SILT",
15 = "SANDY MUD",
16 = "FINE SILT",
17 = "SANDY CLAY",
18 = "VERY FINE SILT",
19 = "SILTY CLAY",
20 = "CLAY"
