
All plotting widgets have the same capabilities. The plot widget for roll and pitch of a selected file is shown in the Plot Widget figure. As you move your cursor over the plotting area, the cursor location values update in the text box at the bottom of the widget.
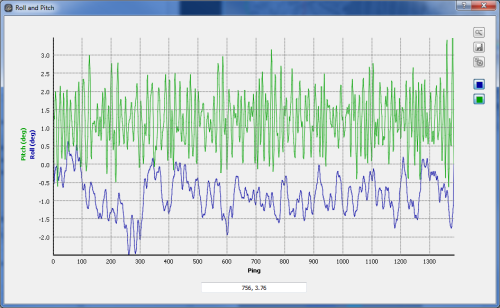
Plot Widget
You can zoom into a portion of the plotting area by click-dragging a selection on the plot surface as shown in the Plot Widget Zooming figure.
If you wish to zoom back out, simply click on the zoom out icon 
If you wish to save the current plot to an image, simply click on the Save As icon 
The settings icon 
The color buttons in the toolbar of the plot widget allow you to quickly hide or show a field of the plot. This can be useful in multi-plot widgets.
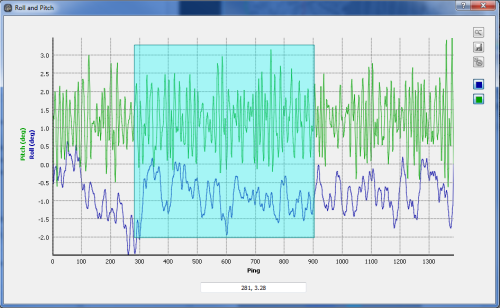
Plot Widget Zooming
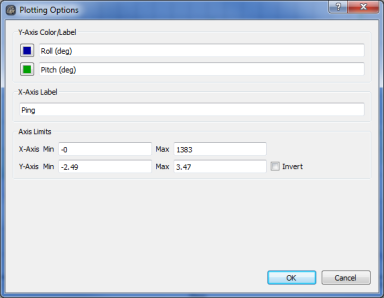
Plot Widget Settings