
Alert, Observation Physics and Node QC Displays are useful for initial checking of the hardware and software configuration.
The Alert display remains centrally important to ongoing dredging operations whereas the Observation Physics and Node QC Displays are less important and maybe not active during operations.
Other displays presented here are primary to monitoring operations.
Observation Physics
The Alert Display monitors serial and network data communication but does not concern itself with time tagging and data values.
The Observation Physics display is useful for checking data reception and data values during the project setup phase, i.e. the correct driver is being used.
It lists observations with their times and values.
When creating the display for the first time the Select Observations dialog is shown first.

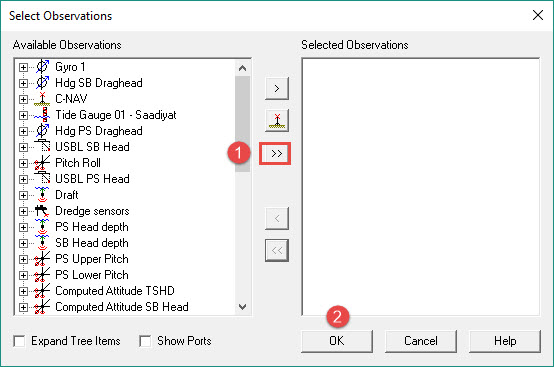


If all is fine, you can close this display.
Return to: top of page.
Node QC
Another display that is very useful after defining and/or changing systems in the Database Setup program. It quickly checks that the computations you set up are actually solving.
When creating the display for the first time the Select Nodes dialog is opened first.

This conveniently moves the Reference Points of all objects to the right. These nodes are all you need to ensure that positions are being computed for all objects.
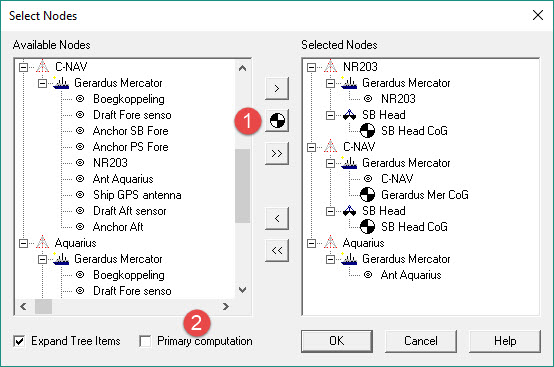
Single arrows move only the highlighted node. Double arrows move all nodes.

In the example there are three computations: C-NAV, NR203 and Aquarius.
If any computation is not solving rows for the failing nodes are highlighted in red and the cause of the failure is displayed in the Status column.
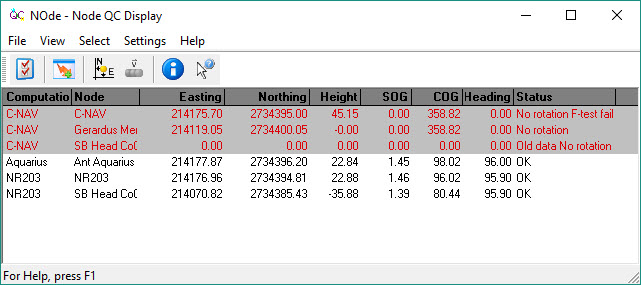
The best approach to solving a computation failure is to disable all objects and systems under Computation Settings - Overview, except for the main object and the primary positioning system.
First make sure that combination solves. If it does, enable further Systems on the first Object.
If that works add another object and enable the systems used to position it. Check that combination solves.
Keep adding objects and systems one at a time until the computation fails again.
This process pinpoints the problem system.
Return to: top of page.
Alert
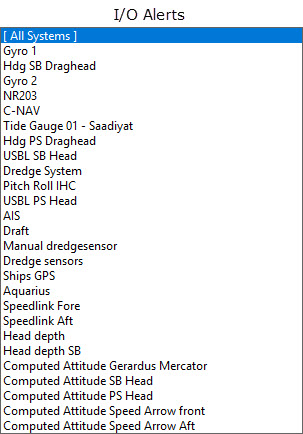
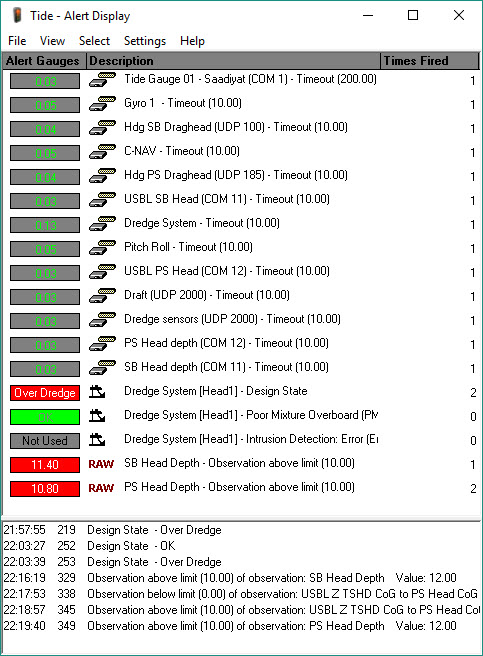
Use the Alert Display to generate visual and/or audible warnings about failing I/O of interfaced systems, and received or calculated values that do not meet user-defined criteria, e.g. upper and lower limits.
Alerts for computations that are on Standby show that these are on Standby.
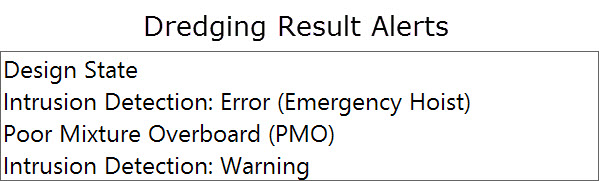
Dredging Result alerts are only available when Dredging Systems are present in the template database (Online) or the recorded database (Replay).
The actual alerting values must be entered in the Controller's Settings - Session Setup - Dredging - Intrusion Detection menu.
An empty dialog is shown when making a new display. If modifying the alerts of an existing display click on 

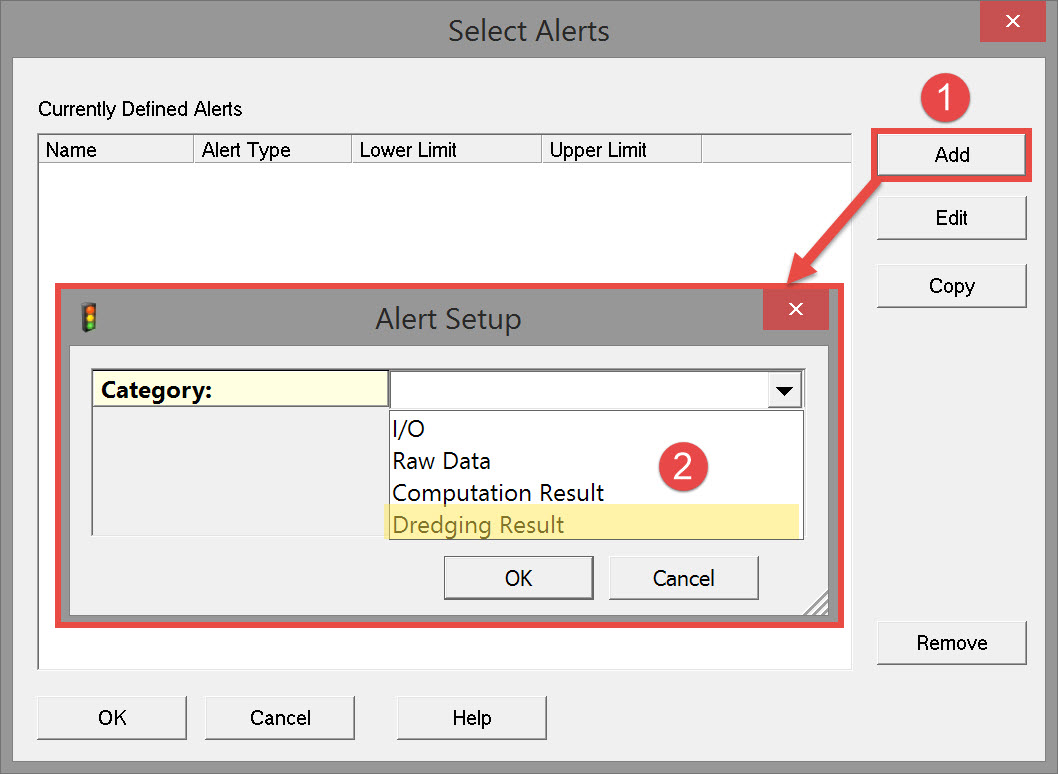
Select from parameter lists and/or enter parameter values.
|
Category |
Description and Parameters to enter |
|---|---|
|
|
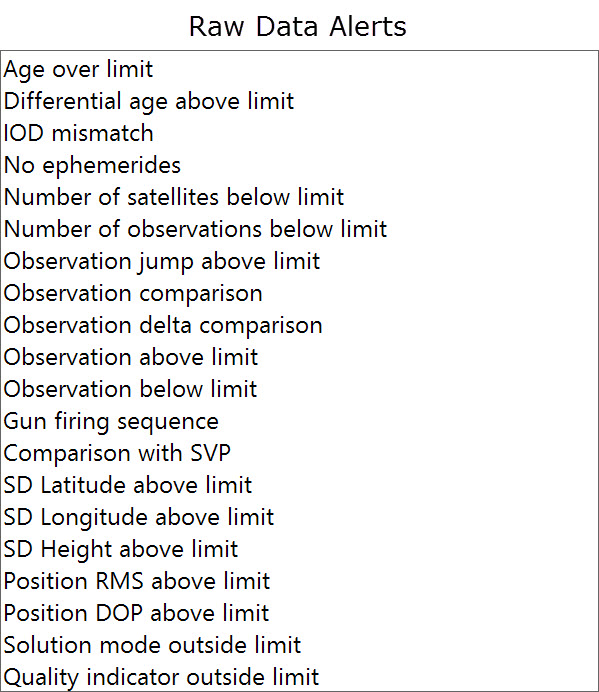
Various parameters require selection or value entry:
|
|
Various parameters require selection or value entry:
For comparisons:
|
|
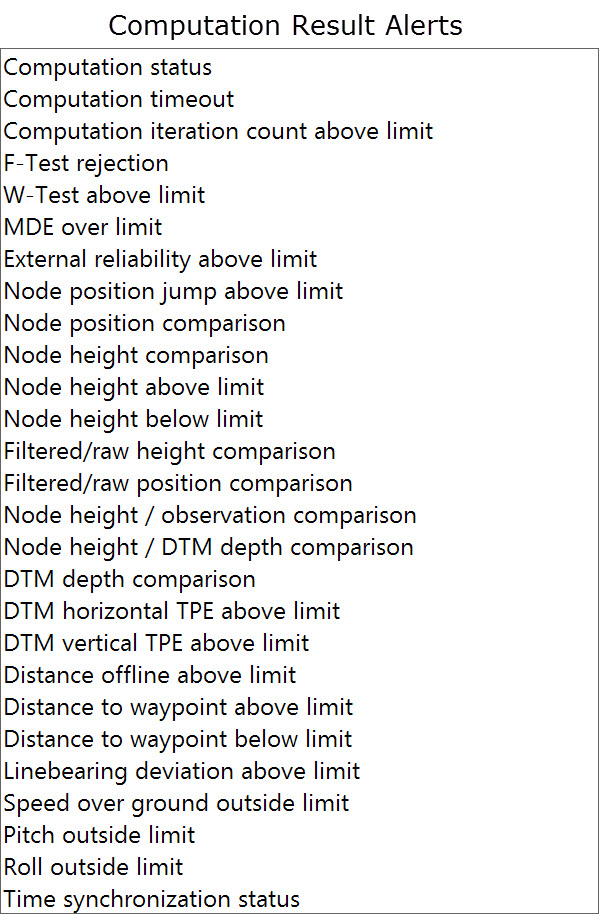
Computation Result can trigger alerts in two ways:
Various parameters require selection or value entry:
For comparisons:
|
|
Various parameters require selection or value entry: Design state:
Intrusion Detection Error (Emergency Hoist):
Poor Mixture Overboard (PMO):
Intrusion Detection Warning:
|

After set up the dialog will look similar to this:
Return to: top of page.
Navigation
Create a Navigation Display to visualize 2D positioning of one or more objects superimposed on background imagery, including ENCs, ECW files, CAD/GIS files, Line files and Sounding Grids.
Many functions are straight forward and do not need explaining in a Quickstart. A few less obvious functions are briefly addressed.
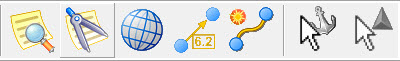
The main functions are all available from the toolbars:
|
Toolbar |
Description |
|---|---|

|
Direct access to each of the individual layers (see below).
also opens the same layers dialog box. |
|
Quick re-scaling of the display to user-defined precise scales.

button to enter a preset scale for each alphabet character. |
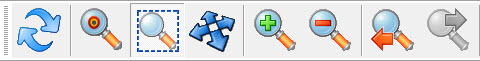
|
The usual tools for navigating around the display. |
|
The Main toolbar provides various tools:
|
|
Favorite displays. You can create and store particular views and quickly revert to any one of them using these tools. |
|
|
Vessel tracking button. When active all objects designated to be tracked are kept in view; the display re-scales automatically.
|

This dialog opens:
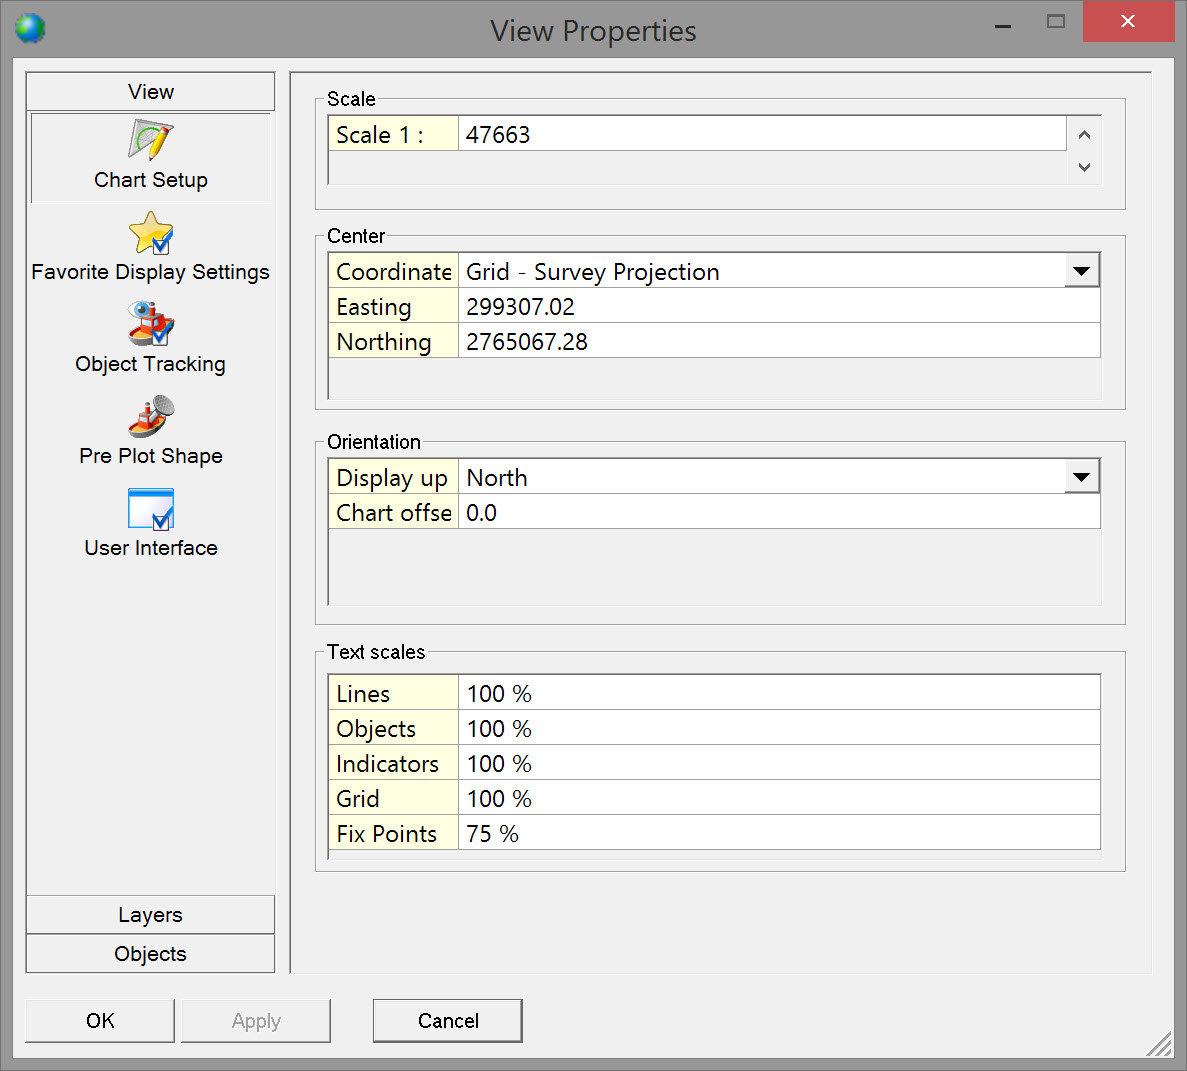
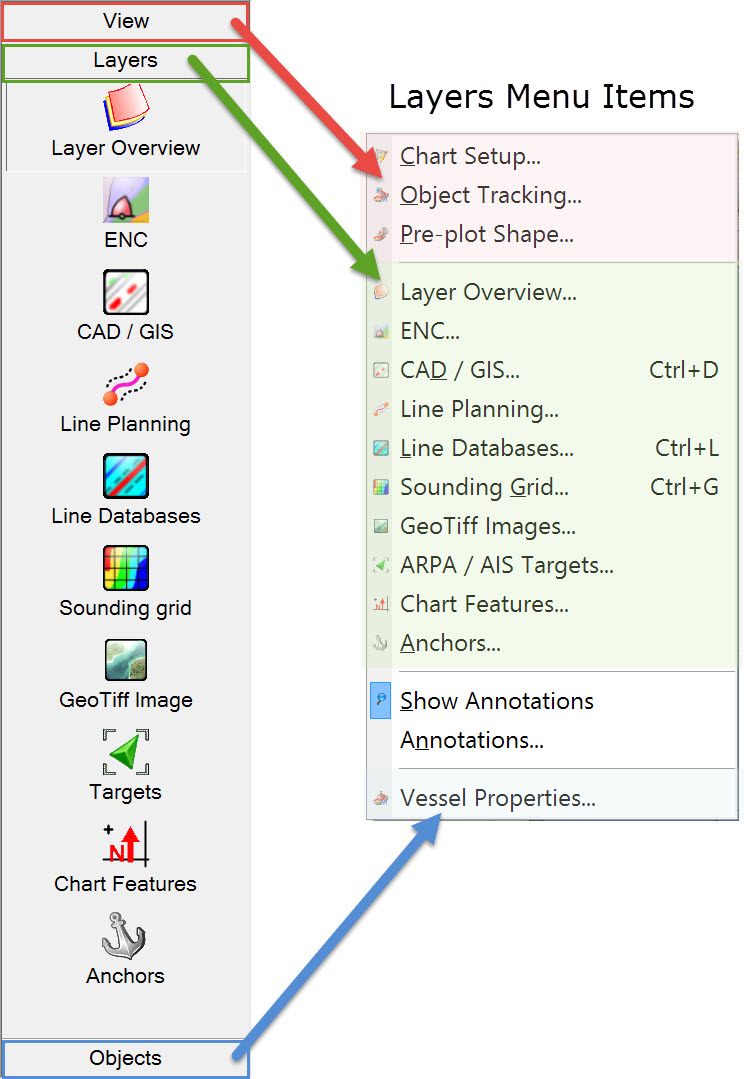
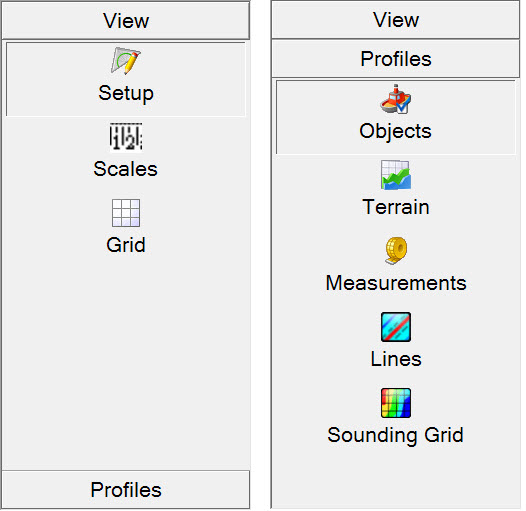
The image below shows a summary of all the buttons available in the left pane.
View, Layers and Objects are the main buttons, each with a number of secondary buttons.
Setting up the display is simply a matter of working from top to bottom.
TSHD - Navigation Display provides more details about the setup as it pertains to dredging.
Refer to the Help pages for complete descriptions of all these primary and secondary buttons.
Return to: top of page.
Profile Display
The Profile Display provides a slice view of the dredger Objects and Terrains (e.g. sounding grid) displayed from four different angles (starboard, port, aft and front).
IMPORTANT: In order to display objects in the profile display at least a longitudinal profile through the CoG of the vessel is required.
A lateral profile supports Aft and Front viewing options.
These profiles are defined in the Database Setup program when creating Object Shapes.
TSHD - Profile Display provides more details about the setup as it pertains to dredging.
Refer to the Help pages for complete descriptions of all these primary and secondary buttons.
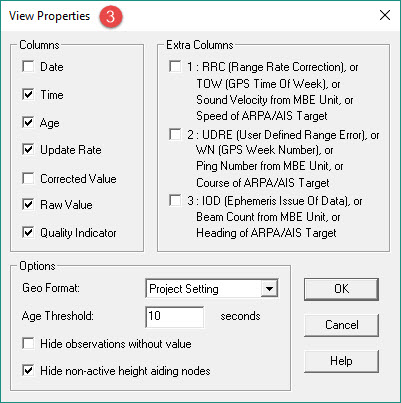
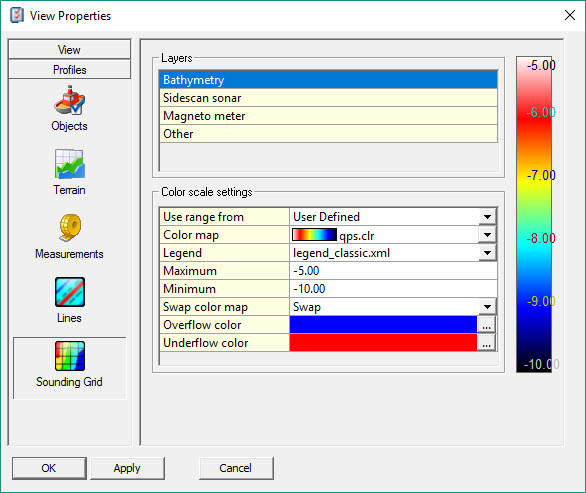
As the Profile Display opens the program reads the active layer of the sounding grid and the design layer as set under Session Setup - Dredging - Design. So the initial display may look something like this:
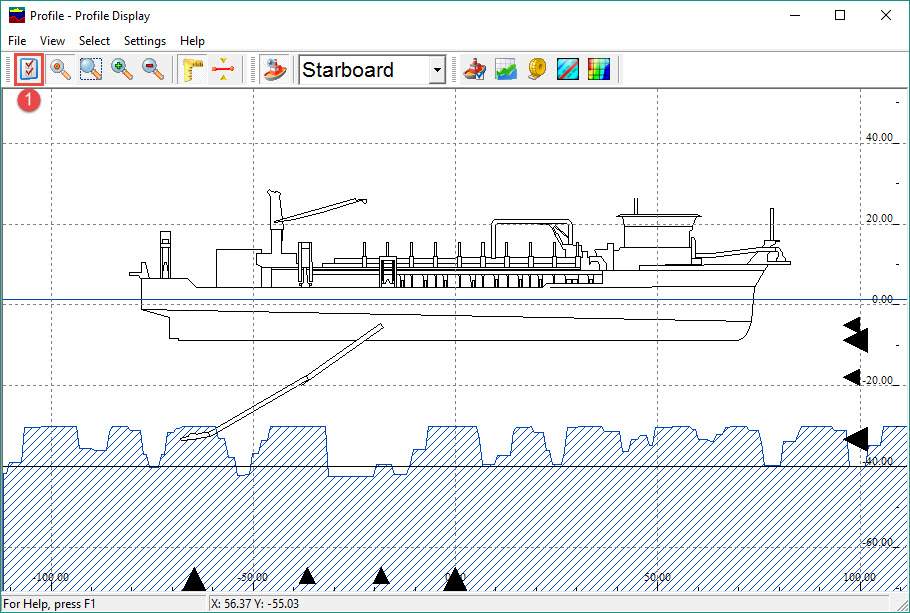
Of course the display can be customized.
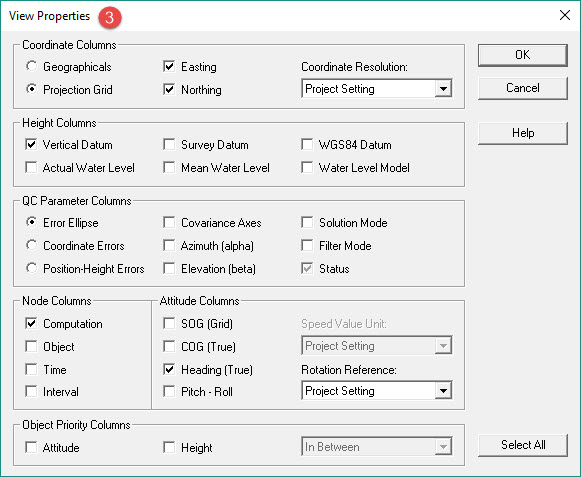
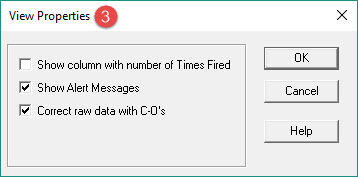
Note that options in the Select menu open the same dialog as does the View Properties option.
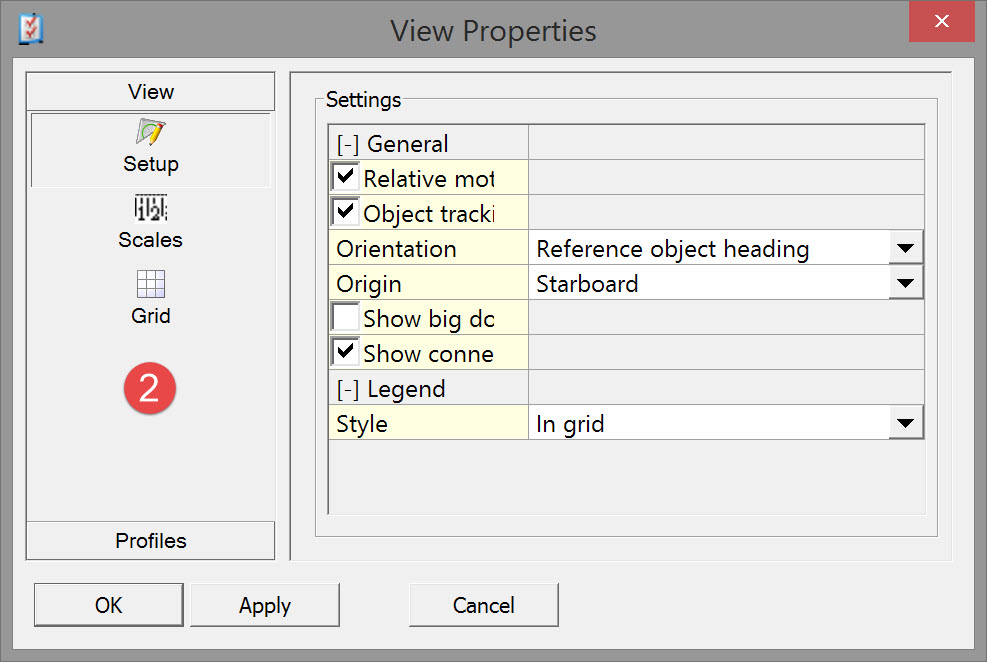
Work your way from top to bottom.
Parameters associated with Setup, Scales and Grid are all fairly self-explanatory.
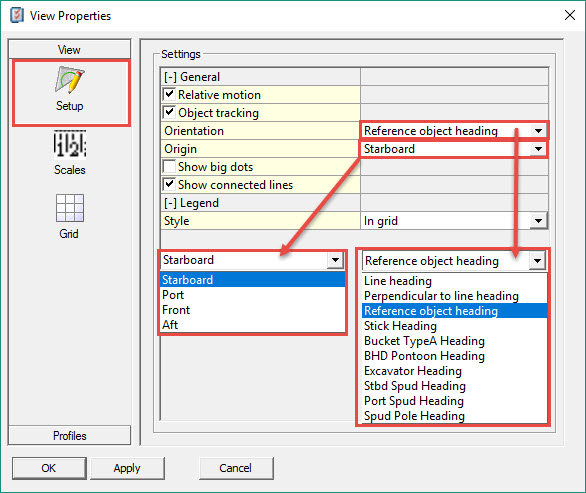
Setup
|
Relative motion |
When Relative motion is on, the object remains in the center of the display; only the terrain is moved.
|
|
Object tracking |
Option only available when Relative motion has been activated.
in the toolbar can be used at all times while on-line.
|
|
Orientation |
The object can be viewed relative to a line heading or to the heading of any of the calculated objects/nodes. |
|
Origin |
This is the side from which the object is viewed, projected onto the line if Orientation was set relative to a line heading. |
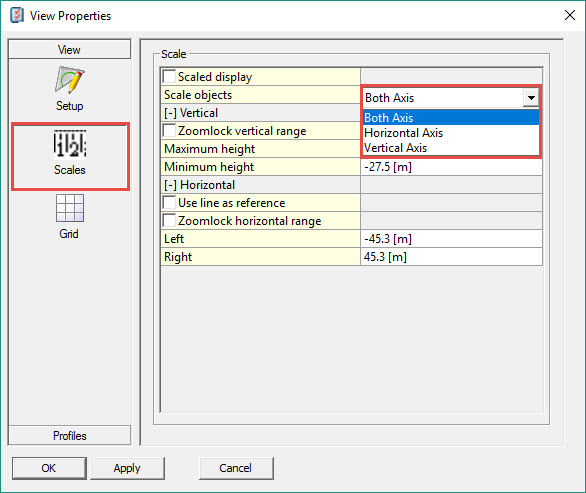
Scales
|
Scaled Display |
When enabled this option scales the display while maintaining the aspect ratio.
When disabled scales are set manually. |
|
Scale Objects |
When Scaled Display is disabled Objects are scaled on one axis or both axes: Both Axes -
Horizontal Axis -
Vertical Axis -
|
|
Zoomlock vertical or horizontal range |
Locks the vertical or horizontal range so it will not change when zooming in or out. |
|
Use line as reference |
Selected to show object relative to a line. KP values are shown at the horizontal axis instead of distances in meters. |
|
Line |
Choose an existing line from the drop down menu.
|
|
Left/Right |
The range shown to the left and right of the center of the display. The center of the display corresponds to the reference point of the active object. |
Grid
Set the colors and line styles for the grid.
Return to: top of page.
Objects

This opens the View Properties dialog with the focus on Objects.
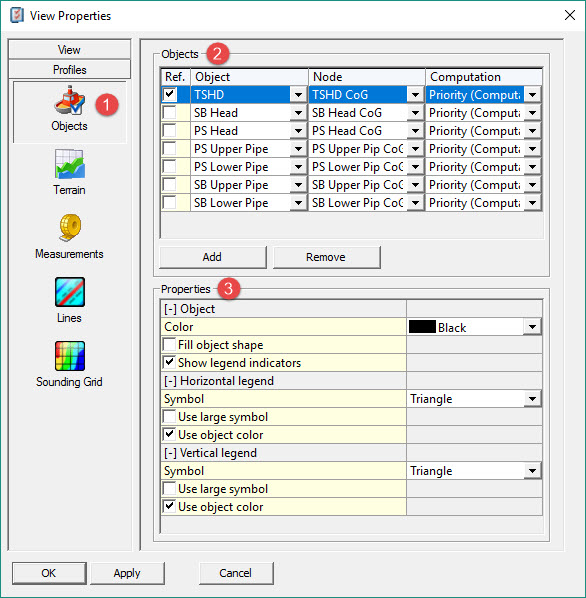

Select a Node on that Object and the Computation in which the node coordinates are calculated.
Using this Object a longitudinal or a cross profile is drawn with the selected Node in the center of the screen.
The Objects are displayed in the reverse order that they are added, i.e. the bottom one in the list is displayed on top of earlier entries.
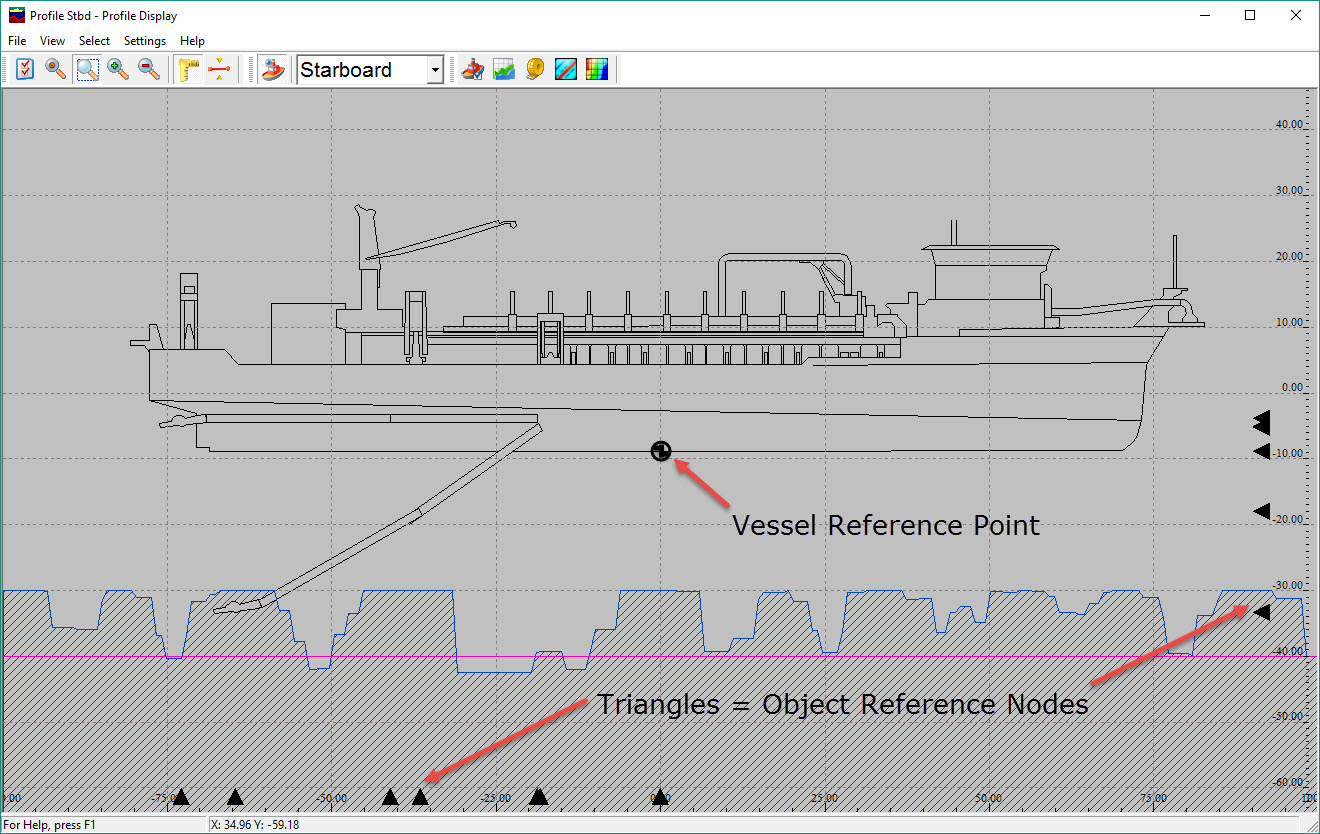
In our example, indicator symbols along the horizontal and vertical legends are used to indicate the location of reference nodes for each object.

Multiple symbols may be shown at one time.
Symbols along the Horizontal and Vertical Legends point to the selected Node.
All other available Objects are drawn around this Object and Node.
In our example, indicator Symbols along the Horizontal and Vertical Legends are used to indicate the location of the selected Node for each Object.
Return to: top of page.
Terrains
By default the first layer defined in the active Sounding Grid is loaded as a Terrain. So too is the Design Model if it has been defined as a layer and contains data.
If further Terrains are required, the following terrain types are supported:
Sounding Grid - Select the sounding grid to use from the standard Windows browse dialog. Then select the correct layer in the next column.
If a sounding grid was selected in the 'Controller's Session Setup - Storage', the first defined layer will automatically be shown here, named Sounding Grid <Storage>.
When Under and Over Dredge Tolerances are used, these are also shown.
If necessary remove the sounding grid chosen in the Session Setup here by using the 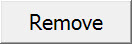
Echosounder - Single observations from echosounders can be displayed in real-time. This enables you to analyze the depth readings in comparison to a previously created terrain.
When selecting a Multibeam system, the swath must be set.
Using direction starboard or port, the readings will show as a measured Terrain when drawn as lines.
Safety Line - It is possible to add a nominal safety line. A line is displayed at the manually entered depth (in survey units).
This line can be used in case no design is available and a depth needs to be displayed.
QPD Processing - Select *.qpd processed files. Multiple files can be selected.
QINSy Mapping - Select a *.pro file. (This is the old format. It can still be used, but will be phased out. Use the *.qgf format instead.) It is only possible to select one file at a time, but you can add more.
QGF Design Model - Select a *.qgf file. (This is the new QPS CAD format.)
Safety Line <Design> - This line was designed in the Dredging Design dialog when Design Method was set to Manual Depth.
A Storage - Sounding Grid does need to be set to show this line.
Sounding Grid <Design> - If a sounding grid with a design layer was selected in the Controller's Session Setup - Dredging - Design it will be shown here.
Sounding Grid <Storage> - If a sounding grid was selected in the 'Controller's Session Setup - Storage' it will automatically be shown here.
Water Level - Mean Actual Water Level, i.e. water surface, is shown.
Additional Terrain <Session> - A terrain from the Controller's Session Setup menu 'Additional Terrains' can be selected here.
The terrains are displayed in the reverse order that they are added, i.e. the bottom one in the list is displayed on top of earlier entries.
Other settings are cosmetic and self-explanatory, except perhaps the fill type Color Banding.
Color banding - Only available when the layer type is Sounding Grid.
Depths in the Profile Display are shown in their own color ranges, similar to depths in a sounding grid shown in the Navigation Display.
ColorBanding.jpg?cb=9b82a432873cc26ecee75bc7bc7a73b2)
Return to: top of page.
Measurements
Measurements are calculated from a node to a profile; they are not raw measurements.
Add a measurement, select an object node and computation, and then the terrain to which the measurement is made.
Enter the properties of each measurement added.
Return to: top of page.
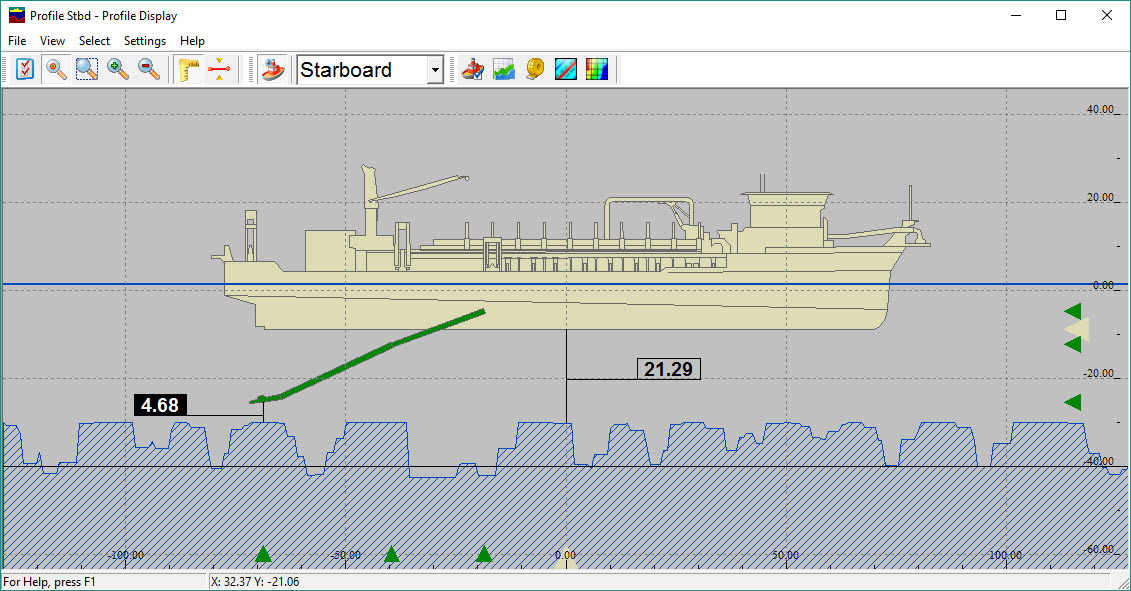
Lines
The current active survey line is listed as well as any additional mainlines defined and activated in 'Session Setup - Planning'.
Adjust the properties for each line separately in the Properties pane.
Similar to Objects, the position of the selected line can be shown using indicators (an open dot).
The line can only be seen when sailing perpendicular to it.
Use Settings - Origin - Front/Aft/Starboard/Port to get it in view.
When the line has not been given a height, it will be shown at 0 meters.
Sounding Grid
If a sounding grid is used as terrain, enter parameter values and make selections to determine how to show it.
Return to: top of page.
Generic
The Generic Display is enormously powerful in that it can display virtually every parameter used in software with design of the layout completely in the hands of the operator.
This display is intended to replace the Alphanumeric Display.

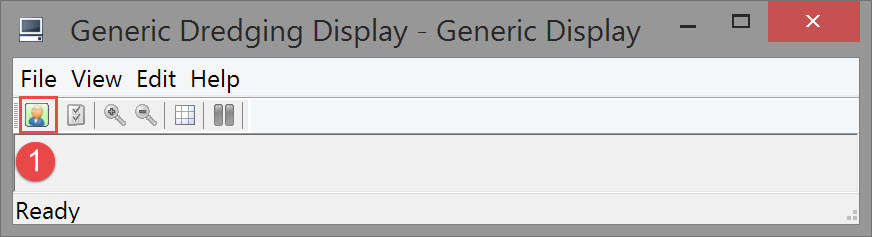
This opens the Generic Layout Editor focused, by default, on the Display secondary button located under the primary Overview button.
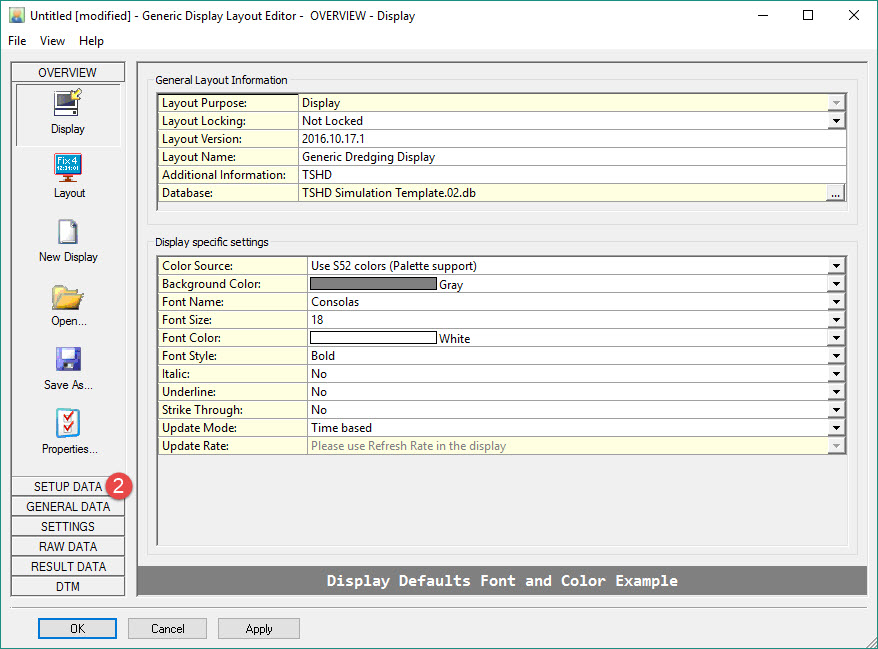
You will come back to the Overview primary button when some or all items have been added.
Work your way from top to bottom selecting each of the secondary buttons as they appear under the primary buttons.
These are all the buttons available:
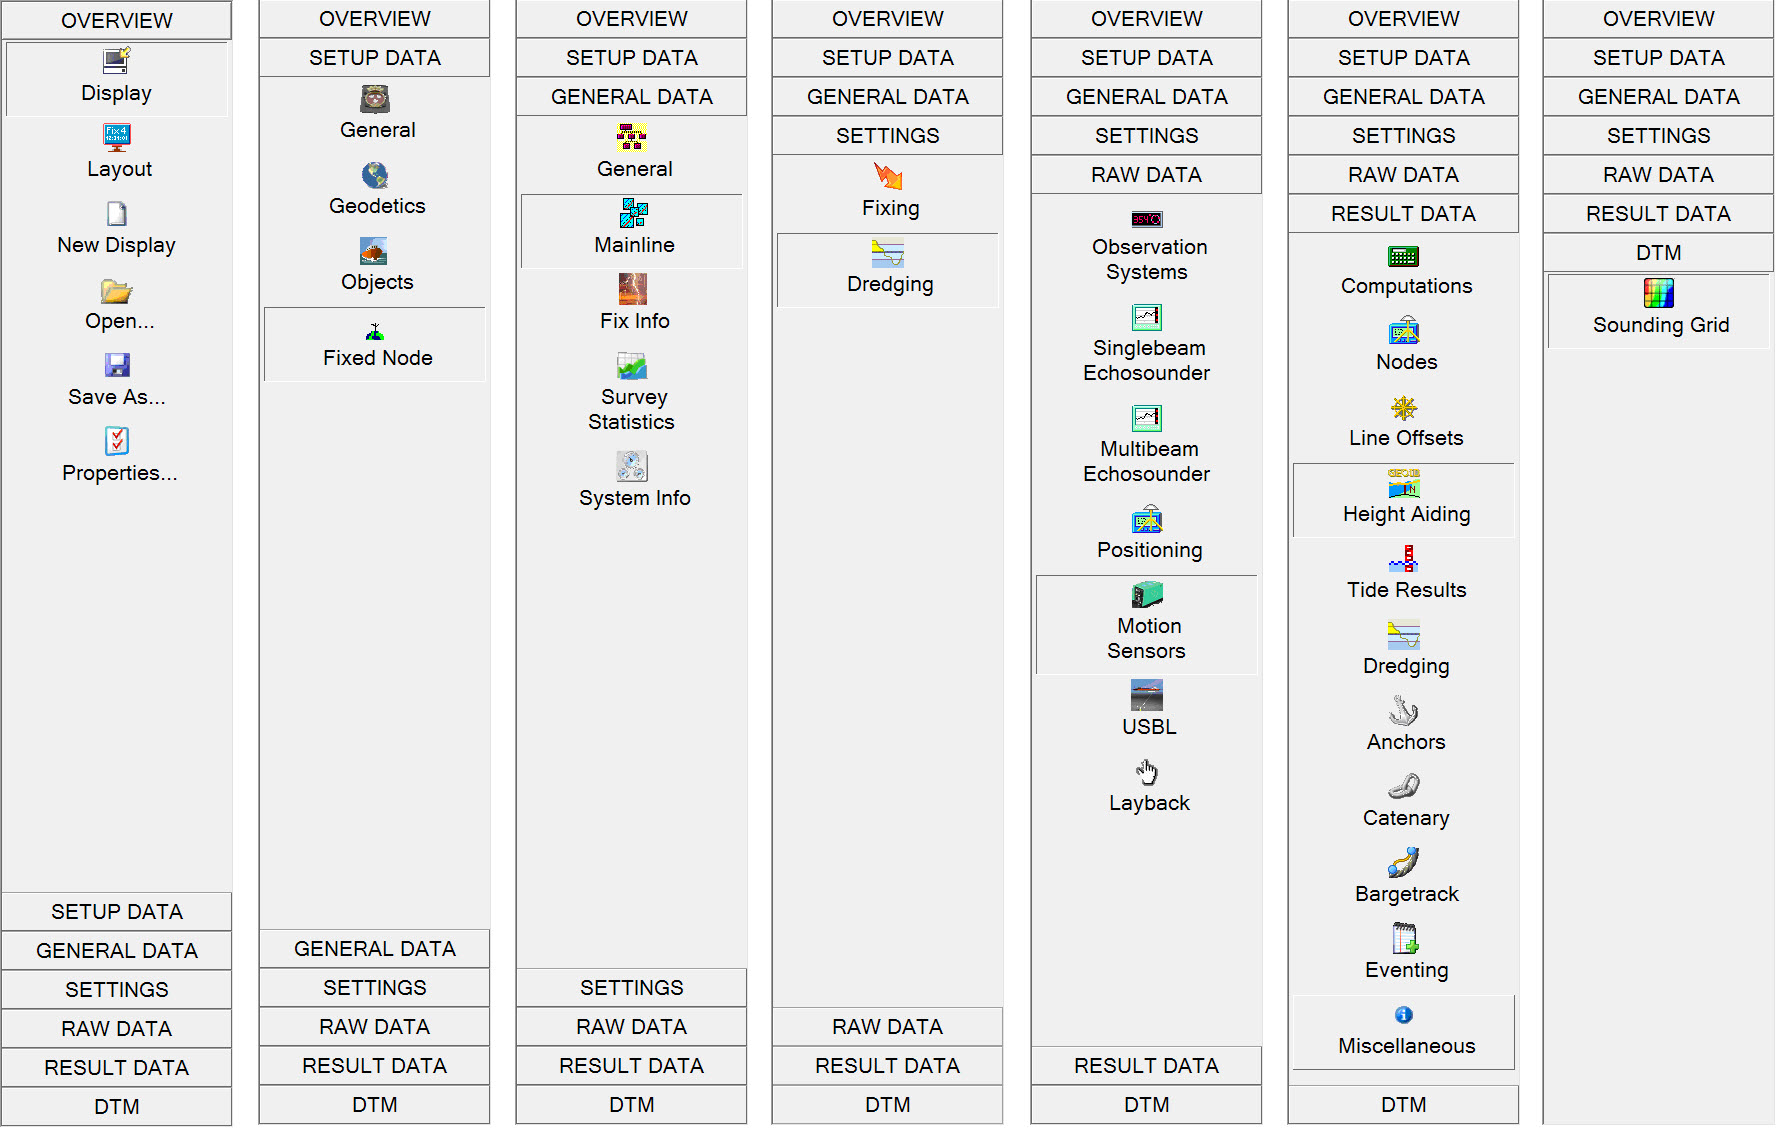

Observation System secondary button under the Raw Data primary button.
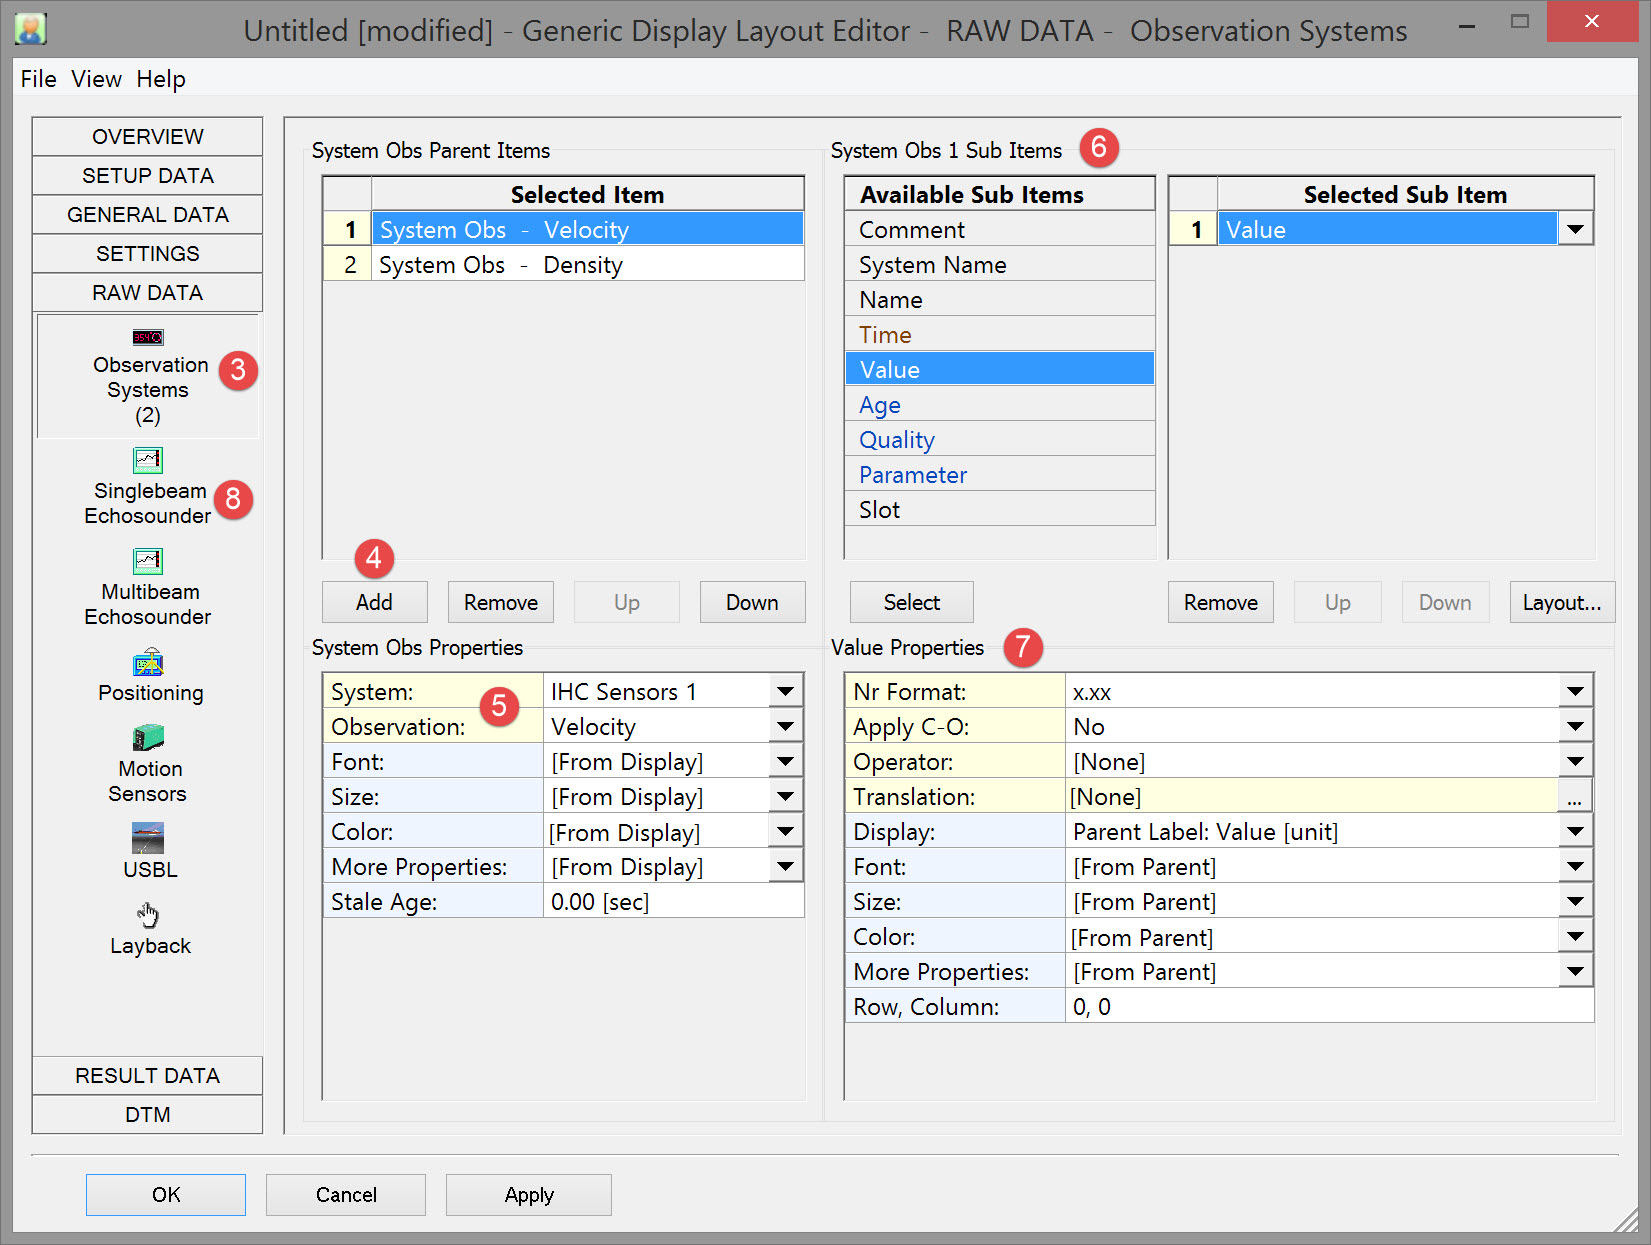


They are added to the Selected Sub Item list.

Work through all the primary and secondary buttons adding Items and Sub Items you want displayed.
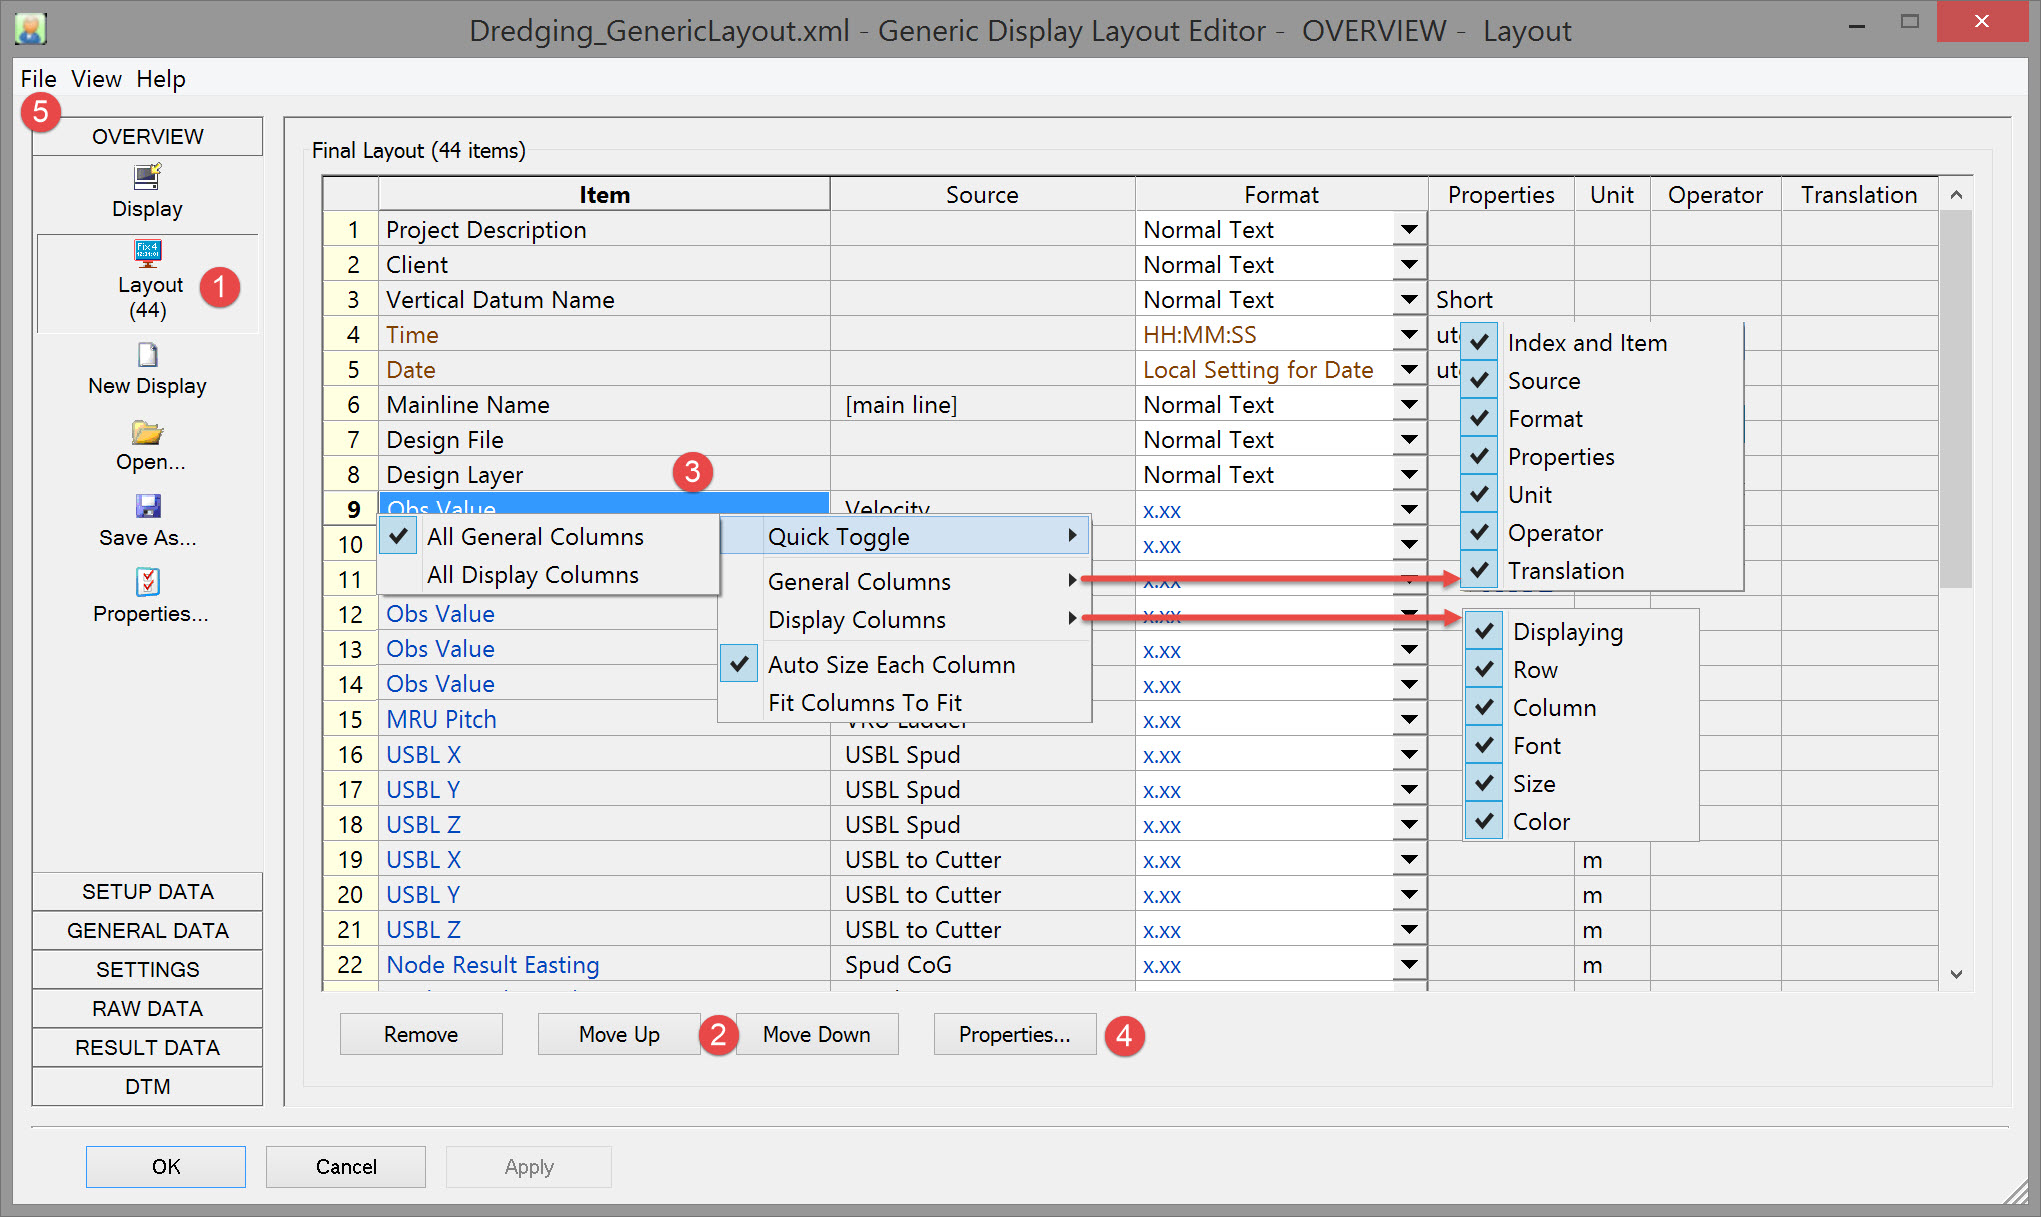
Finally return to the Layout secondary button under the Overview primary button.
All the items are listed in the order they were added.
Return to: top of page.
Changing the Layout via the Layout Editor

Another option is to use the mouse in the actual display to drag and drop individual or blocks of items (see Edit Layout In Display By Mouse).

Right clicking anywhere in the table pops up a menu with options, one of which is to add mode columns (Display columns).

-
-
either double clicking on an item.
-
or Highlighting an item and pressing
-
In each case the definition page for that item is opened.
Some properties are directly editable in the layout table.
Please refer to TSHD - Generic Display and for descriptions of these Properties.

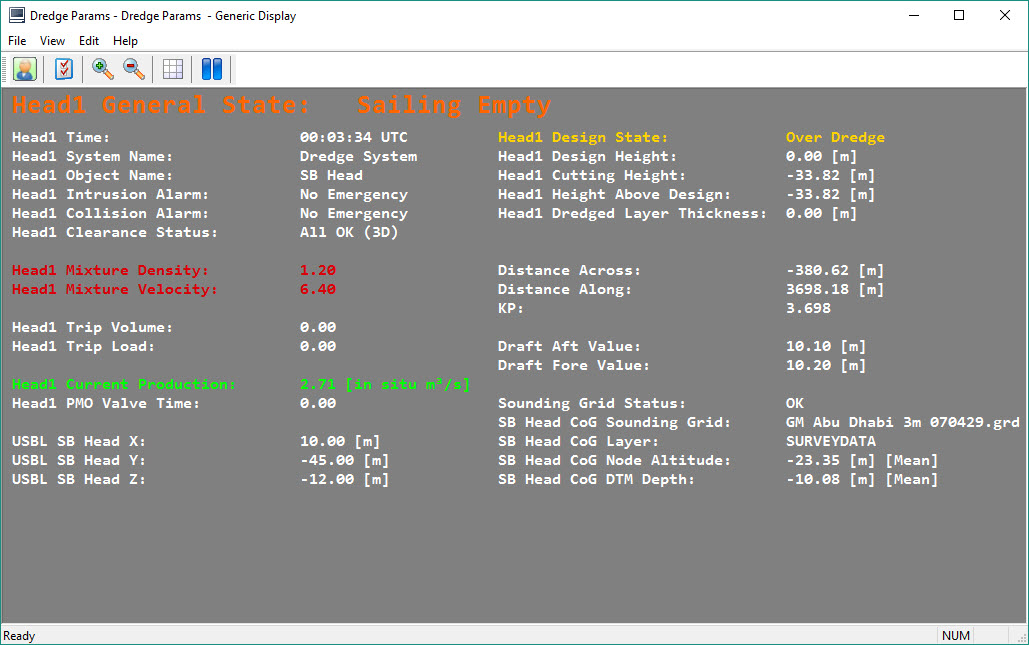
The final display looks something like this:
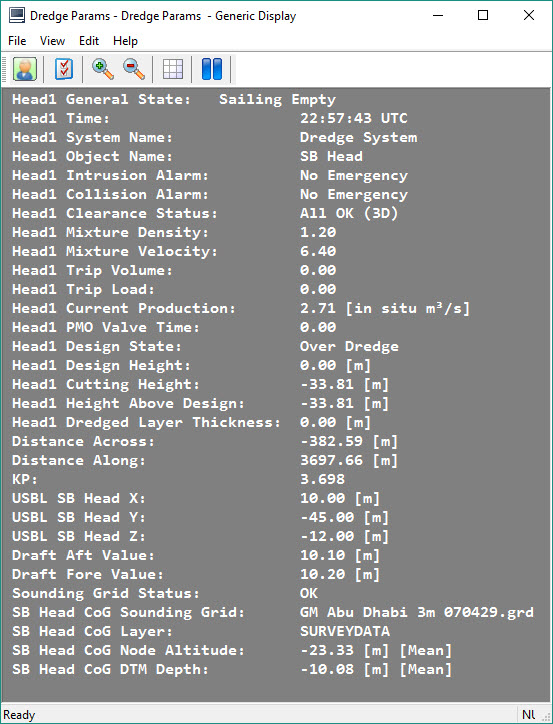
Return to: top of page.
Changing the Layout in the Display by Mouse
Items can be moved around within the main Generic Display dialog by mouse.
The next image illustrates what happens when you click on an item, in this case Mainline Name, and drag to another location; the whole block of text below this item is also picked up and moved.
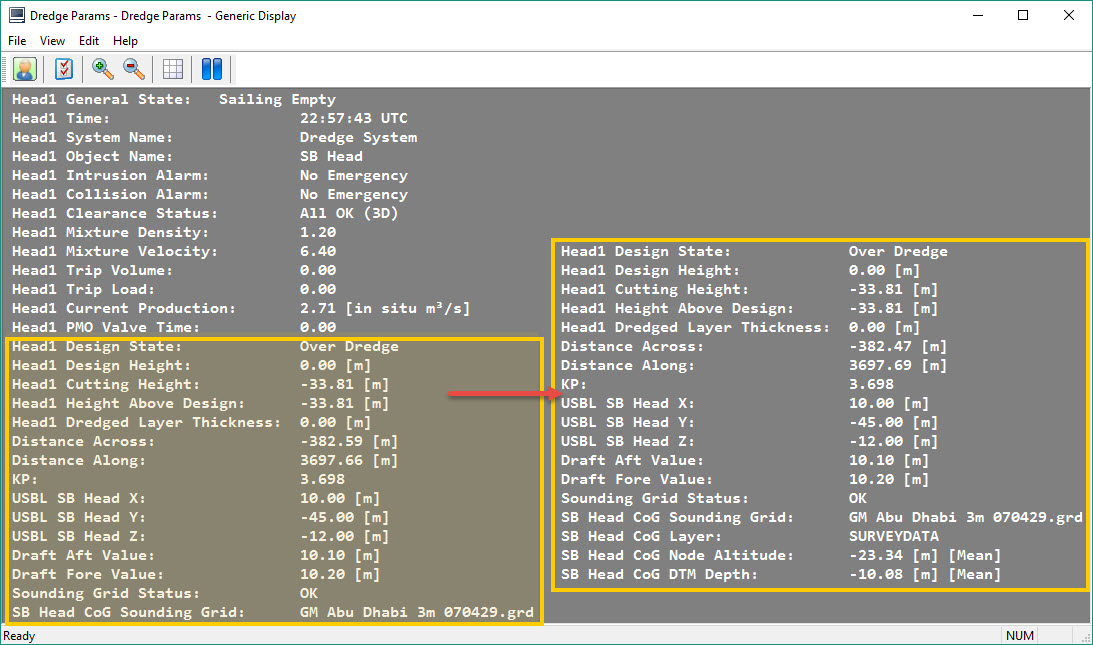
This means you have to separate blocks of text as illustrated in the next image where Distance Across was clicked and the block of text below was moved with it as the mouse was dragged to the left.
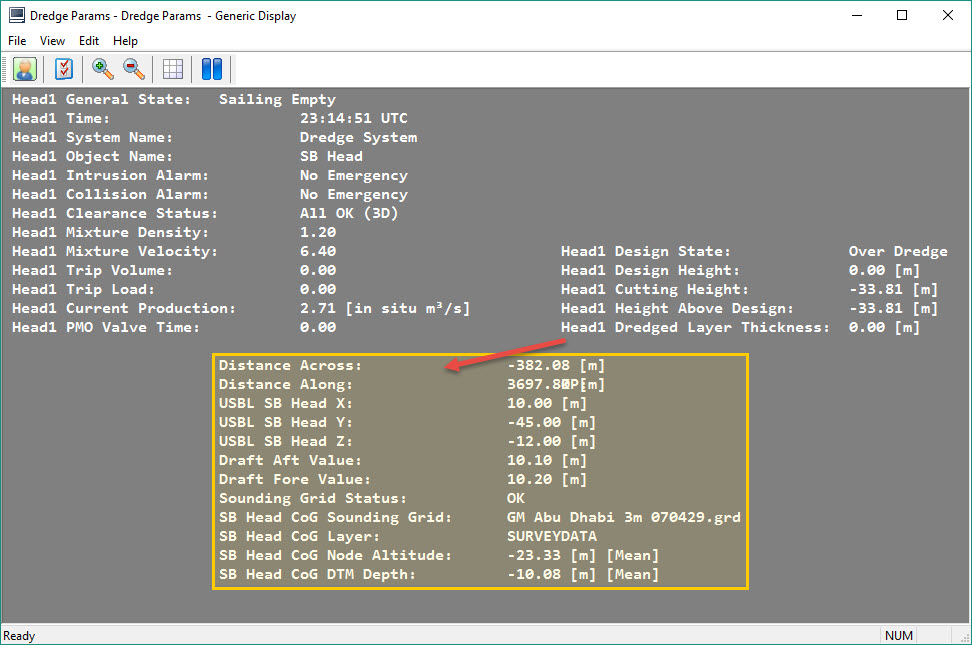
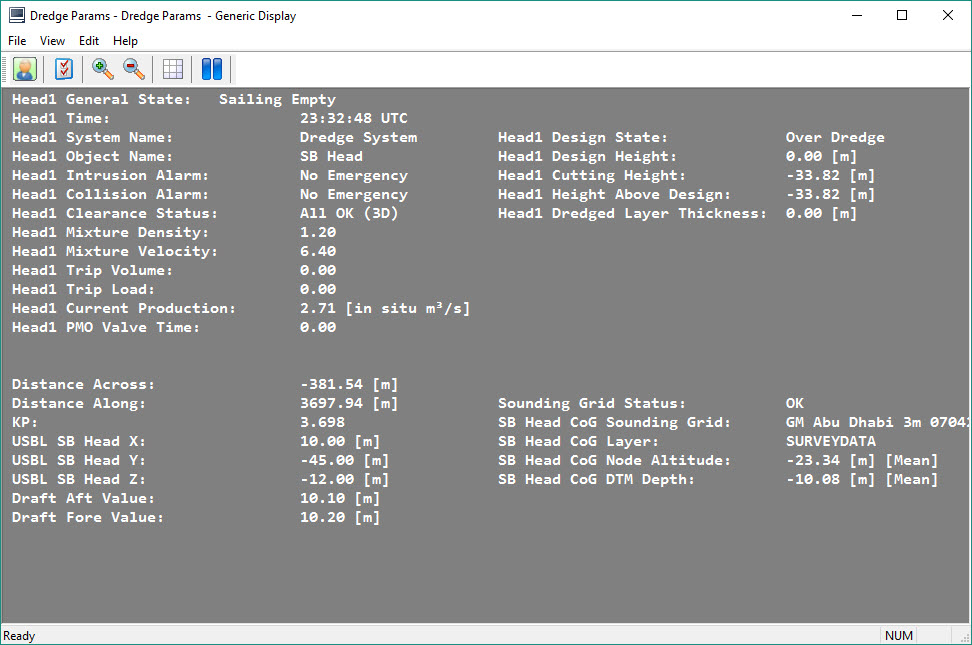
In this next image you see there is a block under Head1 General State, another under Distance Across, another under Head1 Design Status, and another under Sounding Grid Status.
Of course the idea is to move items around so related data are clustered.
In order to accomplish this you may have to separate individual items so each can be moved independently.
Once an item is isolated from other items it can be moved individually from then on, even when positioned right under another item.
As an example the display could end up with the layout shown in the next image.
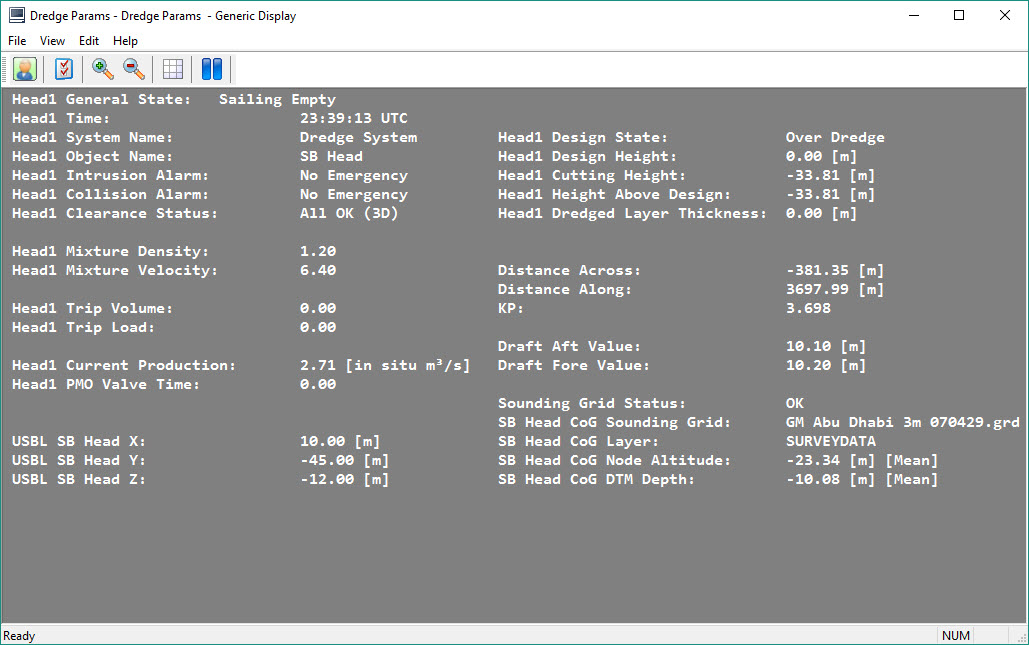
Next it might be useful to highlight certain items with larger text and/or different colors.
Using the right click menu select Display Properties. Modify one or more of the parameter values and notice that the changes apply to all items in the dialog.
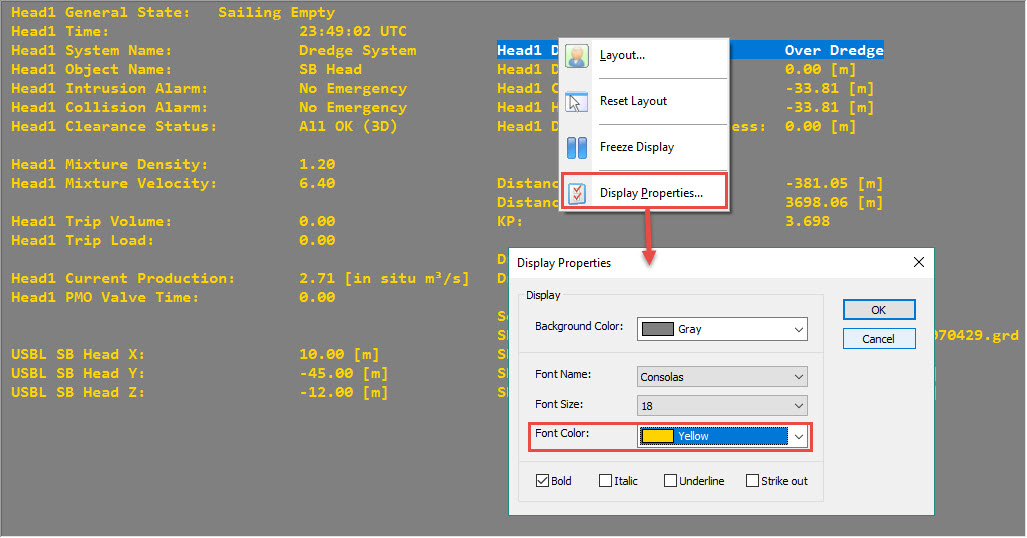
In order to change individual items, either double-click on the item, or right click on the item and select Layout from the menu. Each method takes you to the appropriate page of the Layout Editor.
In the item Properties pane, modify any one or more properties.
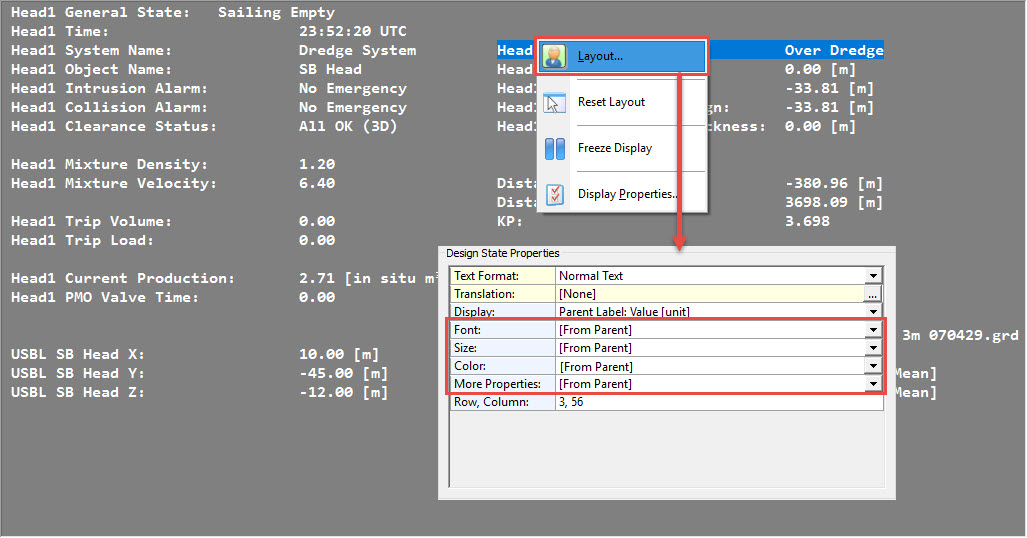
The Display and More Properties parameters offer the following options:
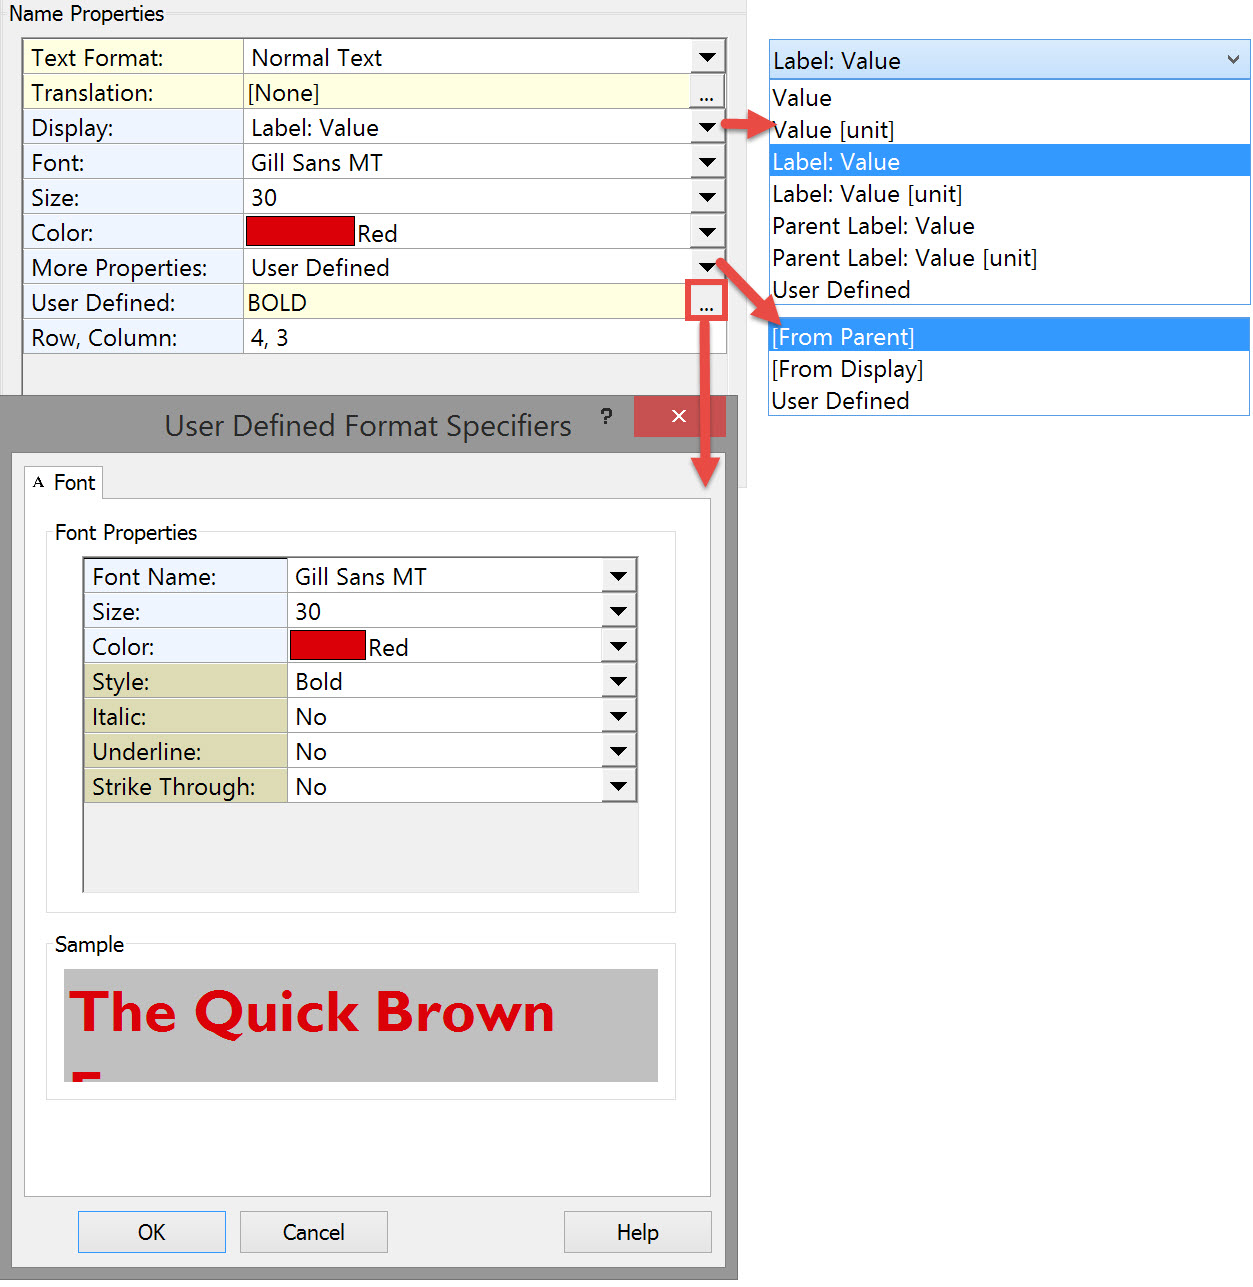
If User Defined is selected under More Properties, you can click on the button 
Selecting User Defined under Display opens the User Defined Format Specifiers dialog for labeling:
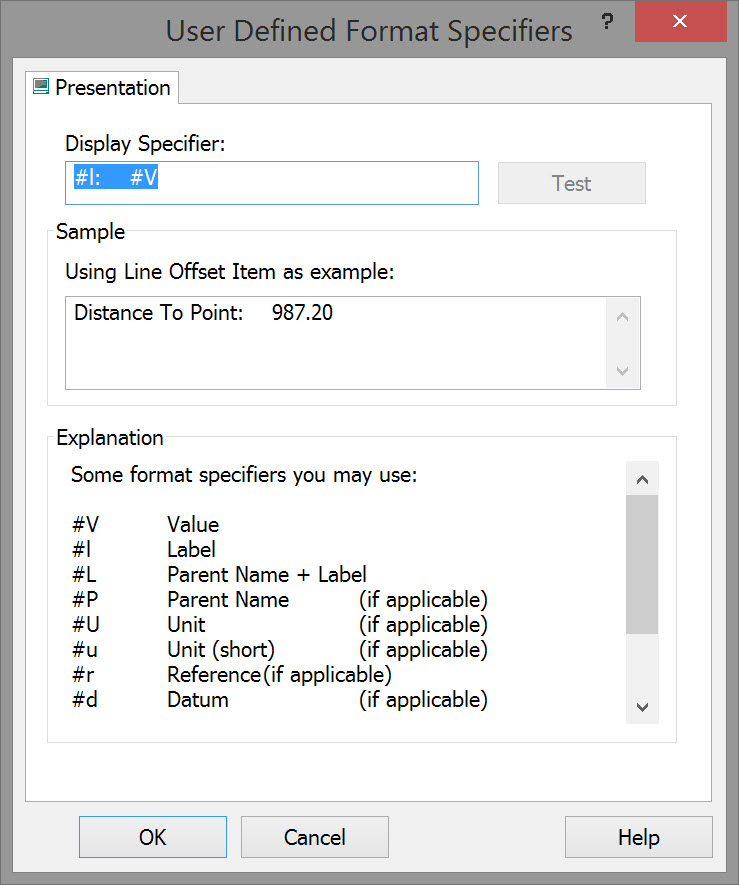
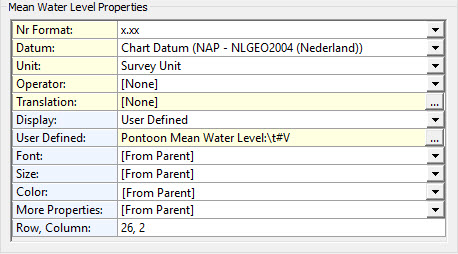
Here you can use predefined specifiers, your own text, spaces and tabs to define the label and position of the item value.
Other Properties to try are Operators and Translations.
The final display could look something like this, although there is probably too much information in this one display.
Return to: top of page.
3D Grid
The 3D Grid Display shows multiple three dimensional objects simultaneously:
DTMs, DTM Textures, Static Objects, Water Surface, Range Markers, Cables, Survey Lines, Anchors, and Vessels (dredger, trailing arms, dredge heads, etc.).
Objects are seen moving in real-time updating DTM depths as dredging proceeds, both excavation and dumping.
Orienting the Display
|
Button |
Description |
|---|---|
|
Left button |
Hold the left mouse button down.
|
|
Right button |
Right click in the scene to set a new pivot point.
|
|
Scroll wheel |
Zooms in toward and out from the pivot point. |
Setup Display

or clicking on the 3D Objects menu item....
or clicking on the View Properties task bar button
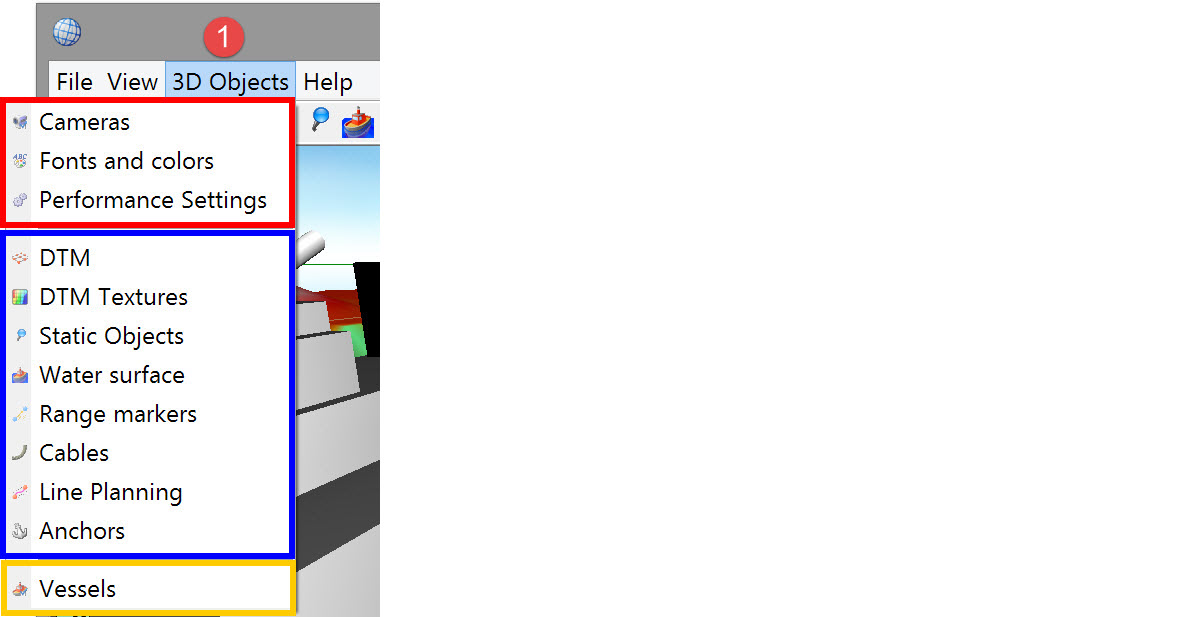
...all open the View Properties dialog. Which page of this multi-page dialog depends on which command is selected.
These are all the options:
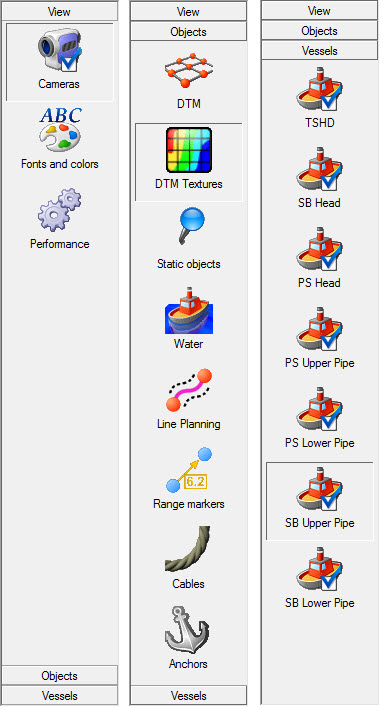
The best place to start is with Vessels. Once all objects have been enabled and Direct X models assigned, go to Objects.
Lastly go to View.
Return to: top of page.
Vessels

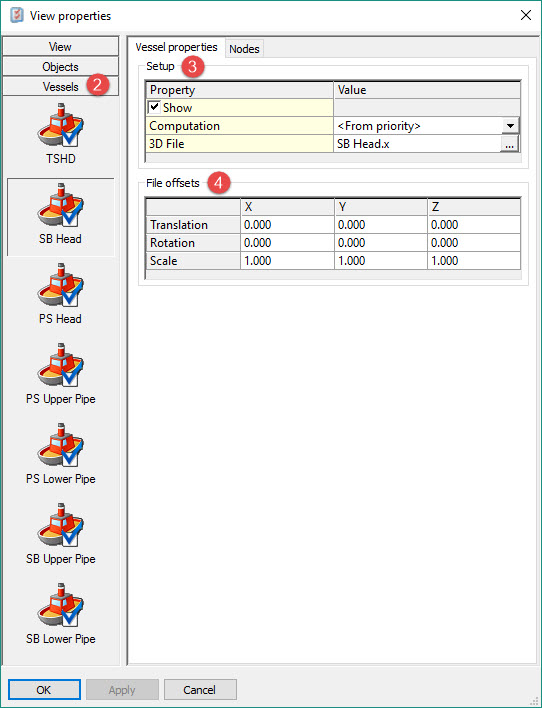

Then click on 

|
File offsets |
|
|---|---|
|
Translation |
The origin of the 3D File might not completely match the Reference Point of the vessel, so here it can be shifted in any of the three axes.
|
|
Rotation |
Sometimes the orientation of the 3D File does not match the orientation used by QINSy. For example, an object may appear rotated 180 degrees.
|
|
Scale |
It may be necessary to re-scale the object, sometimes because the units used in the original file are not real world units, or to convert meters to feet or vice versa..
|
Return to: top of page.
Objects
DTM

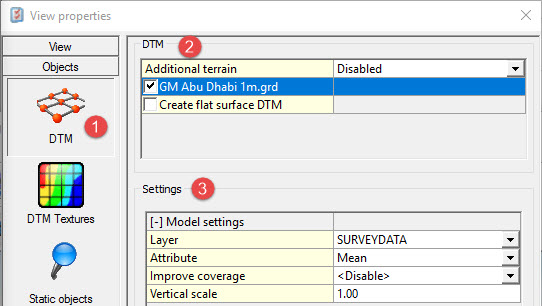
A wireframe model represents the shape of a solid object by its characteristic lines and points.
The currently active Sounding Grid is loaded by default.
Up to 10 Additional Terrains can be loaded - see Controller's Session Setup - Planning.
Alternatively, when no data from the other selected DTM files is available, choose Create Flat Surface DTM which adds an infinite horizontal plane.
DTM Textures

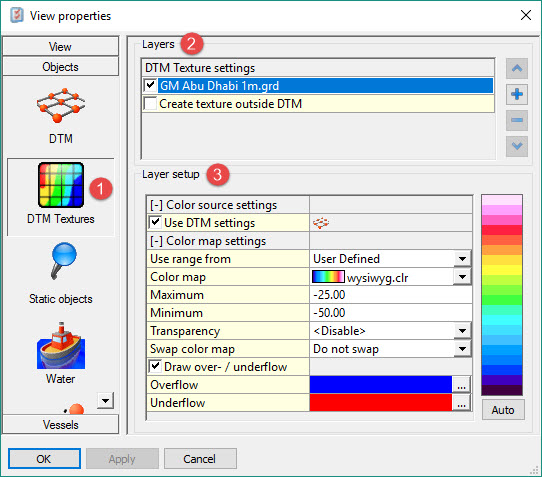
DTM files selected in the DTM page are already visible in this list.
Click the 
Create Texture Outside DTM adds an infinite horizontal plane where no data from the other selected DTM files is available.
This is meant as a visual aid only.
For the sounding grid use these options to set the colors and textures for the selected DTM files.
When 'Use DTM Settings' is checked you are electing to use the same layer and attribute that was set in the DTM dialog.
When unchecked additional options are added to the dialog to allow definition of an alternative Layer, Attribute, and Reference Layer if applicable.
The latter could be the design layer used to show the difference between two layers in a selected color scheme.
Return to: top of page.
Static objects
There may be a need to display objects within the 3D scene that do not move. For example, offshore structures like wind turbines or pipelines. If 3D models of static objects are available, they can be added to the scene.


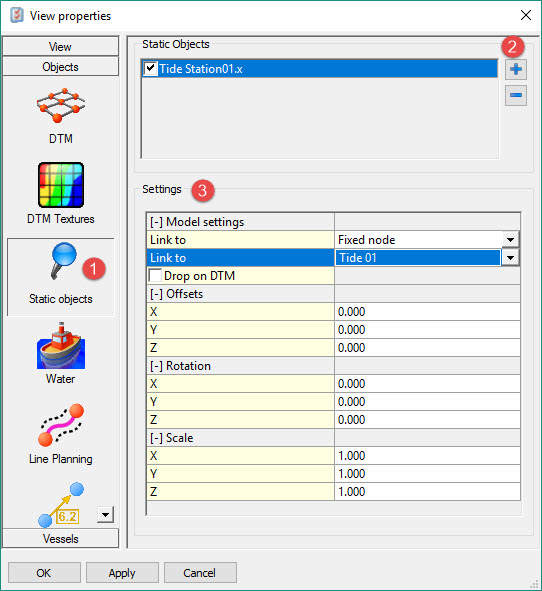
Select object model Direct X meshes (*.x) and/or *.pro / *.qgf files, i.e. designs created with Terramodel or in the QINSy graphical format.
|
Link to |
Select whether the object should be linked to:Manual - a manually entered position, which is entered in the Offsets fields. Fixed node - this node must be predefined in the Database Setup program.
|
|
Drop on DTM |
The Object origin receives the height of the DTM at that location. This overwrites the manually entered Z value.
|
|
Offsets |
These values shift the *.x file relative to the selected location, or they set the absolute position when Link To is set to 'Manual'. |
|
Rotation |
The object is rotated around its own pivot point. |
|
Scale |
The object can be re-scaled if the original model is not created in real world coordinates.
|
Return to: top of page.
Water Plane

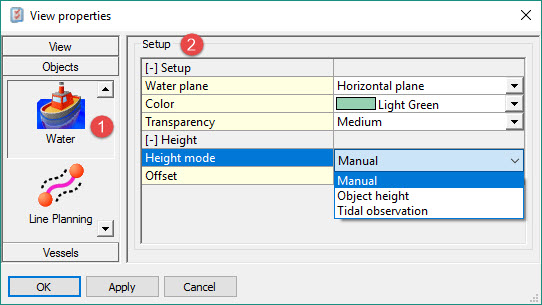
Select either a Horizontal plane or a Boundary. The boundary option uses a DTM from a *.PRO / *.QGF file.
For the Boundary option use the browse button
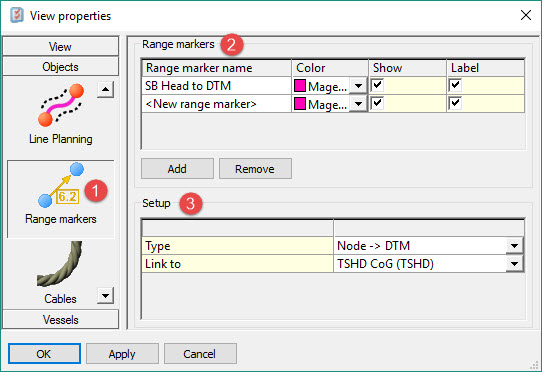
Note that in the Line Db file, you must use the DTM Link check box 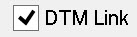
The height of the water plane is determined by either a Manually entered height relative to Vertical Datum or by an Object height.
In the latter case link the water plane to the height of the reference point of a selected object. The plane can be offset if that point is not at water level.
Return to: top of page.
Line Planning

Line heights are the same as those heights entered for each line when creating the Line Database file in the Processing Manager or Line Database Manager.
Return to: top of page.
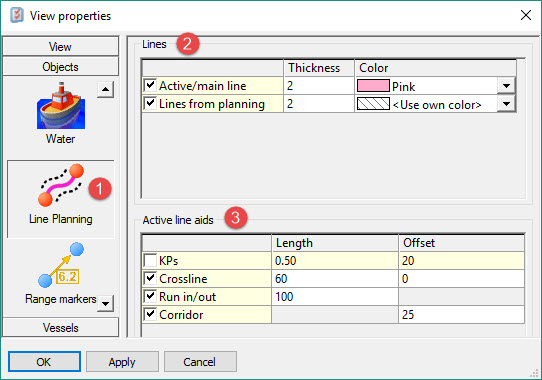
Range Markers
A range marker is a line between two selected points drawn with or without a label which indicates the range and bearing of the line, plus the height difference between the two points.

Label content depends on the Setup selection made, as depicted in the following image.
Select which type of cable and then make the appropriate selections.
|
Setup |
Description |
|---|---|
|
|
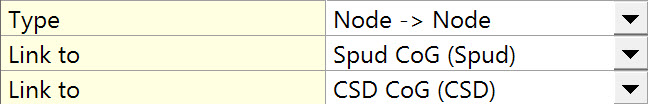
Range marker between two nodes on different objects. This type could be used to show the distance between two vessels.
|
|
|
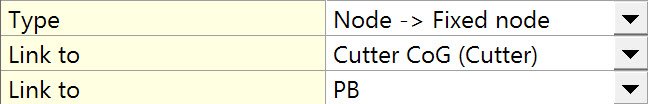
Range marker between a node on a vessel and a fixed node as defined in the Database Setup.
|
|
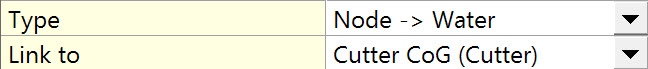
|
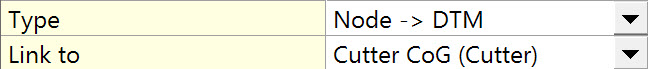
Vertical marker between a node on a vessel and the sounding grid DTM below.
|
|
|
Vertical marker between a node on a vessel and the water plane as defined under option 'Water' above.
|
|
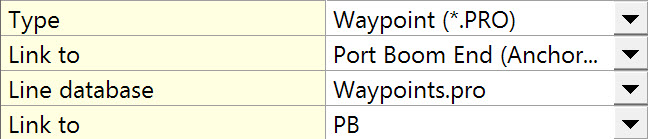
|
Range marker between a node on a vessel and a predefined point in a Line Database File.
|
|
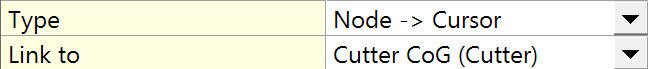
|
Range marker between a node on a vessel and the location at which the left mouse button is clicked in the display. A new label is generated at each mouse click.
|
|
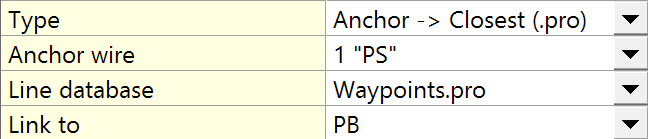
|
Range marker between an anchor wire and a selected waypoint. This option enables the monitoring of the separation between an anchor wire and any potentially hazardous object.
|
Return to: top of page.
Cables - Not applicable.
Anchors - Not applicable.
View
Cameras
Cameras provide preset views of the dredging operation. Multiple cameras may be defined and the view easily switched between them.
A camera position determines from which direction and angle the data in the 3D grid display is viewed.
Cameras may be fixed or they can track an object.

Click on

.
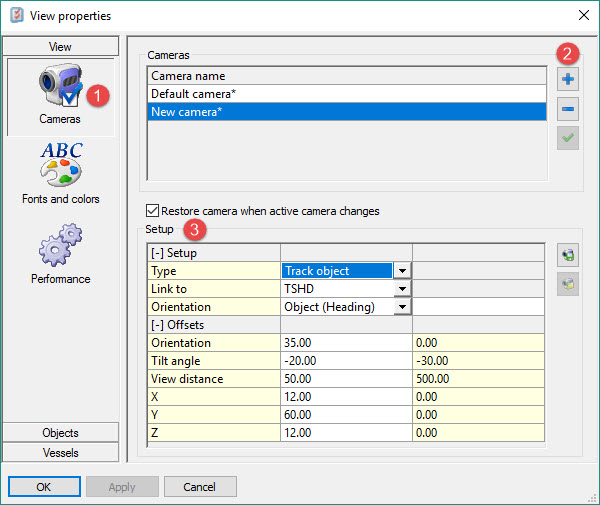

Click on
To add a camera in addition to the Default camera.
Default is the camera you have used thus far to zoom and pan with.
Its parameter values, shown in the bottom bar, reflect the last position it was in before entering this dialog.
Enter the Setup parameters for the new camera.
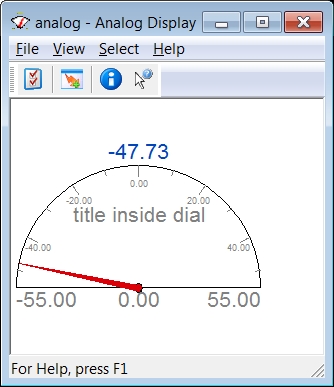
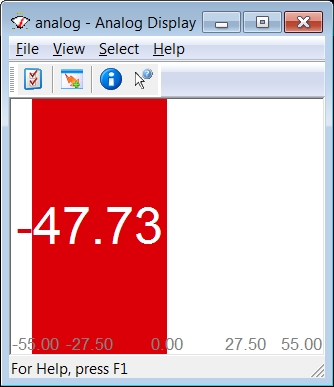
Analog
The Analog Display is used to display an observation in a meter or a gauge format.
|
An analog 'Meter' display could look like this: |
The corresponding 'Gauge' could look like this: |
|
|
|
For example, to display the object speed along and across, or to display dredging production parameters such as mixture velocity, density, and volume.
When “Observation Data” is selected, there is an option in the View menu to correct for C-Os and scale.
Select a Sensor system and an observation.
Alternatively


Return to: top of page.
Height Aiding Driver
“Height Aiding” means to “aid” the computation of the “height” of a node position by adding an additional 'height aiding' observation to the adjustment in which the node position is determined. However, all the resulting heights are still given with respect to the survey datum that has been selected in Database Setup.
The Height Aiding Driver Display is launched automatically when the Controller is started.
It is useful to check the height aiding components of the various nodes to make sure they are as expected.
You cannot close the display so, once values are checked, you are advised to minimize the window to gain screen space.
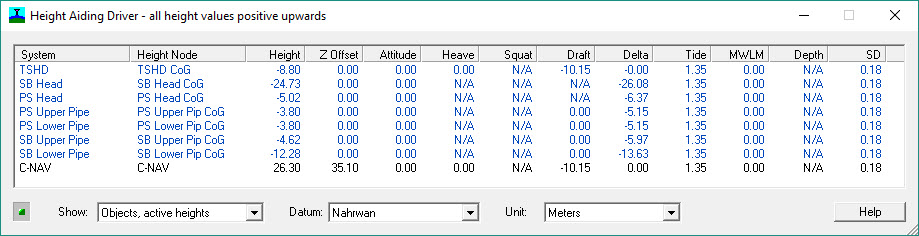
All the height component values are positive upwards, which means that positive bathy depths are displayed as negative heights.
'N/A' means either 'Not Applicable' or 'Not Available'.
|
Column |
Description |
|---|---|
|
System |
System name in case of height aiding observations (black text) and Object name in case of object heights (blue text). |
|
Height Node |
‘Height Node’ is just a short description for ‘height aiding observation at object node’. Height aiding observations are computed by the Height Aiding Driver for positioning systems and satellite systems that have unreliable heights, for bathy depth and pressure observations, and for the ‘to node’ with manual layback observations. |
|
Height |
Height above Survey Datum, or height above WGS84 Datum in case raw GNSS data are interfaced. |
|
Z Offset |
Offset of the node relative to the CoG, for example the node offset of a GNSS antenna or bathy sensor. |
|
Attitude |
Correction to Z offset to account for pitch and roll according to object attitude priority. |
|
Heave |
Heave component according to object height priority. |
|
Squat |
Squat component according to object height settings. |
|
Draft |
Draft component according to object height settings. |
|
Delta |
‘Delta Height’ is the height difference between an accurate height (e.g. from RTK) and an unreliable height (computed using database settings such as the mean water level model and object height settings as defined in the Computation Setup).
|
|
Tide |
Tide height according to object height settings. |
|
MWLM |
Mean Water Level Model height according to geodetic database settings. In case only a geoid model is selected in the database, this corresponds to Mean Sea Level height. |
|
Depth |
Bathy depth (or converted pressure) according to computation settings. |
|
SD |
1-sigma Standard Deviation of the Height Aiding Observation computed from object settings and component observation SD's. |
The object heights are computed for the object reference node in order to transfer height differences between objects and computations and in order to transfer object height components to other QINSy modules.
The delta height has been implemented in order to be able to combine accurate RTK heights on vessels with bathy depths on towed fish objects, in case accurate tide values (or geoid heights) are not available.
More information on the various height component settings can be found on the Help pages of the Database Setup program (Geodetic Parameters, Object Definition) and the Contoller's Computation Setup.
|
Option |
Description |
|---|---|
|
Show |
Select type of information to show. In release mode, three options are available:
|
|
Datum |
Select datum for heights. Currently only the computation datum is available.
|
|
Unit |
Select unit for height values. Currently only the survey unit is available.
|
Proceed to: QS TSHD - Volume Calculation.
Return to: top of page.
Return to: QS TSHD - Online.
Return to: Quickstart - TSHD.