
This How-to describes step by step how to apply tide offline in Qinsy via the Survey Manager
If it's applied online, the tidal data will be stored in the databases.
Additionally, we will explain how to apply tide to a survey that was done with RTK.
Area Method
If you are looking to set up a Tide method for an area in the Survey Manager, please see our 'How-to Area Method'
Qimera Tide
If Qimera is available to you, Qimera can also do reprocessing of the db/qpd with tide files.
For more information on this, please see the following How-to's:
-
How-to Qimera - Applying Tides
-
How-to Qimera - Tide Strategy
Survey Manager 
Tidal data is made up of two parts in the Qinsy software:
-
The first is the How-to Tide Processing | How toTideProcessing definitionfile. (See below.)
This file contains tidal method, station location and identification and the survey lines to be used. -
Next is the tide data. (See below.)
These are tidal values with corresponding dates and times.
This means that first a tidal definition file needs to be created and at any later stage tidal data can be added to this definition file.
This is all done with the Tide Data Manager, which is part of the Survey Manager.
So eventually the tide will be applied to QPDs.
Location of output file
The output file will be located at <project File>\Tide\TideDefinition folder (or a Common files folder as set in Console).
Tide definition file
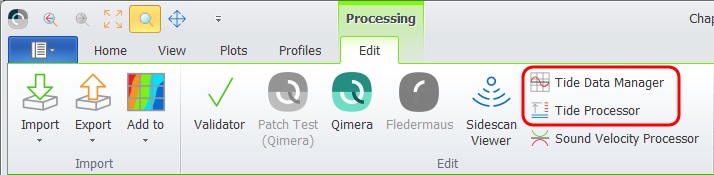
In the Survey Manager, select 
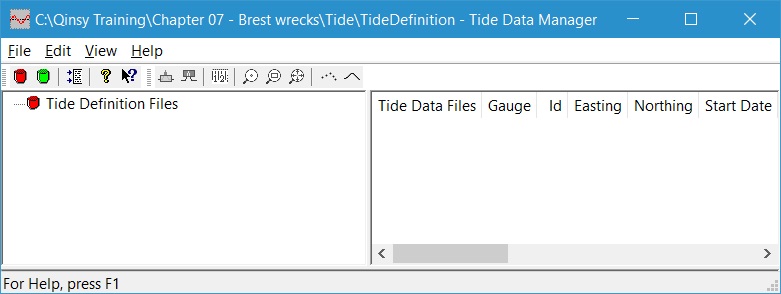
The Tide Data Manager screen appears:
-
Click on

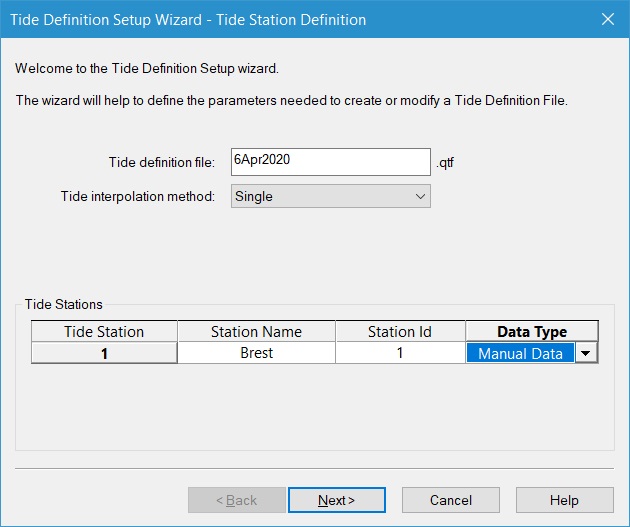
The Tide Definition Setup Wizard starts:
-
First enter a file name in the field 'Tide definition file'.
Use normal keyboard characters and numbers conform to MSWindows file naming conventions. -
Under 'Tide interpolation method' use the drop down menu to select an interpolation method for the vessel with reference to the tidal station(s).
Options are:
Single - Single tide method uses one fixed tidal station only. The tide value is applied 100% to the vessel regardless of position.
Linear - Linear tide method uses multiple stations. The distance from the vessel to each separate station is used when applying tide values.
Linear Co Tidal - Data is shifted based on HW level of two stations.
RWS (RWSLOD) - Interpolation of four tide stations. Developed for Dutch Public Works.
Virtual - One tide station. Tide data is based on vessel position.
Area - For different areas a unique tide calculation method can be defined. (See Knowledge Base document 'How-to Area Method'.) -
If Linear, Linear Co Tidal or Area is selected, at 'Number of tide stations' set the required number of stations to be used.
-
Under Tide Stations, enter the station name, station ID and Data Type. Select from Manual data, Tide Data File or Simplified ATT.
-
Repeat this if multiple stations exist.
-
Click on Next.
-
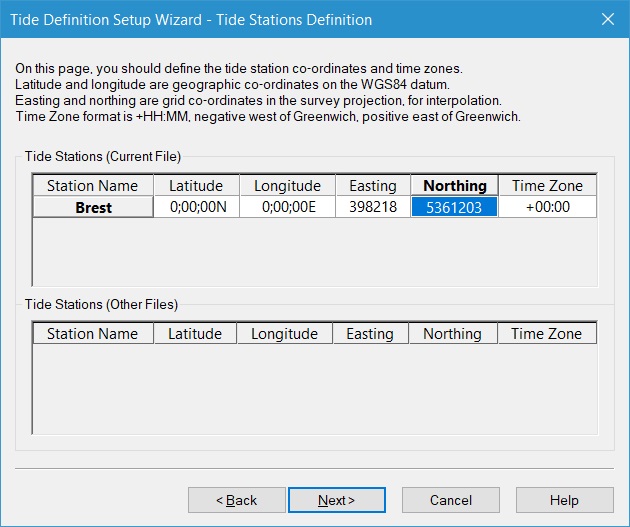
On page 2, enter the station coordinates in Easting and Northing. The fields for Latitude and Longitude can be entered but these values are not used for calculations.
-
Enter the time zone relative to UTC. (east = +, west = -).
-
Click Next.
-
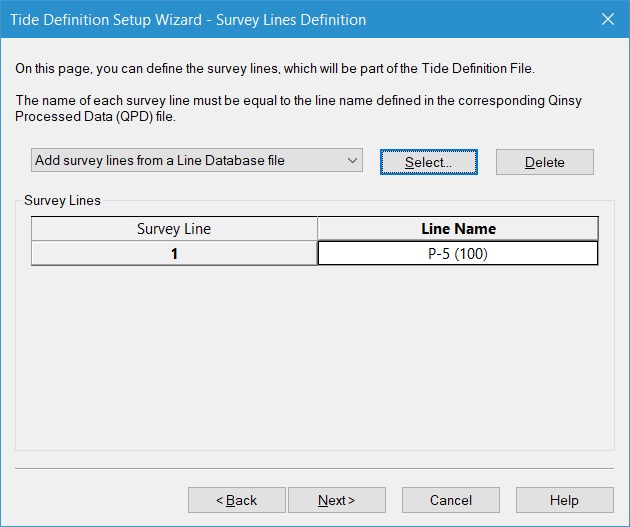
On page 3, the survey lines can be selected. The line name must correspond to the line name defined in the QPD file!
-
Add survey lines from a database or manually (although it can also be done without selecting a survey line file).
-
Click 'Select' to browse for the Line Database file:
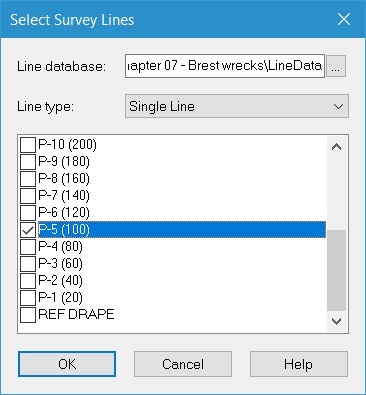
Under Line type, select Single Line or Route.
Click the boxes of the intended lines. (use <shift> or <ctrl> to select multiple lines at once).
Click OK. -
Click Next.
-
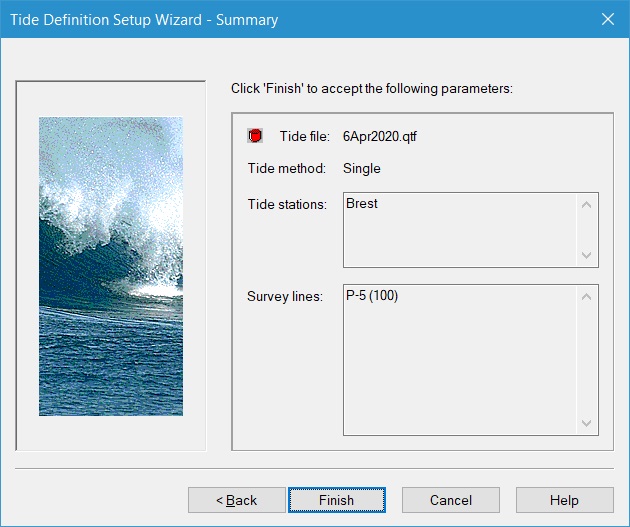
Page 4 gives a summary. Check all entered values and click Finish if all is ok.
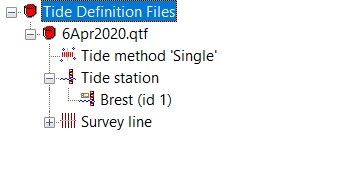
In the tree View of the Tide Data Manager the settings are visible:
Tide data
Now tide data can be added to the definition file:
-
Click on

-
Under Data type, select How-to Tide Processing | How toTideProcessing ManualData or How-to Tide Processing | How toTideProcessing TideDataFile. (See below.)
Manual Tide File
-
If 'Manual Data' is selected as Data type, enter the Time Period and Interval:
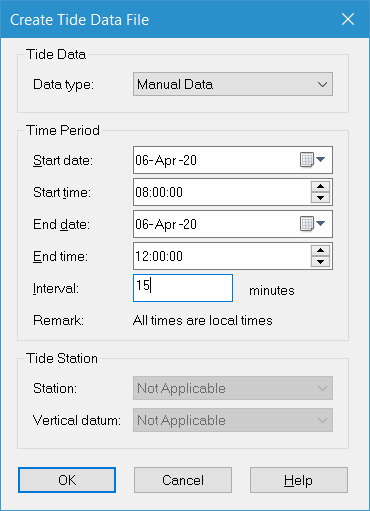
-
Click OK.
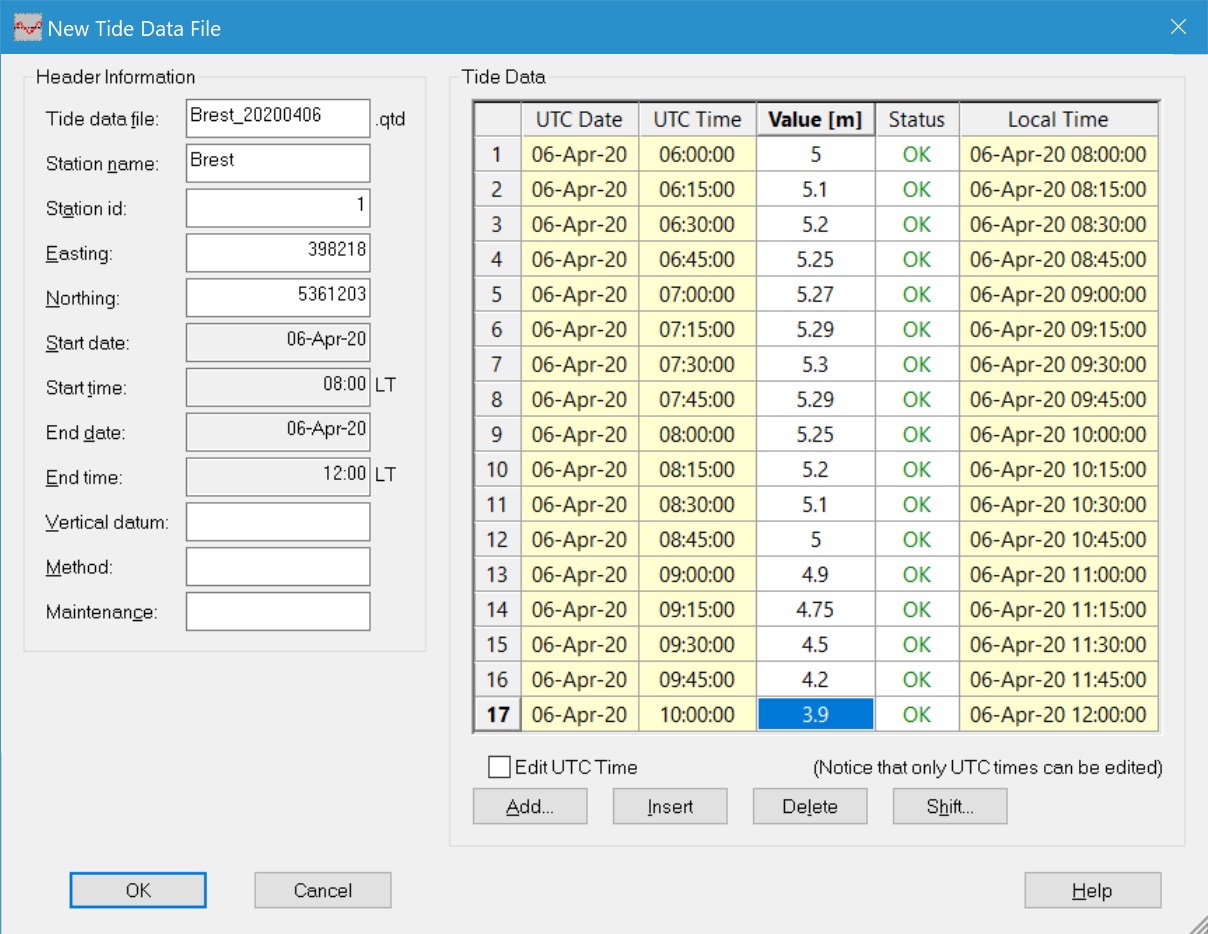
The 'New Tide Data File' screen opens:
-
Under 'Tide data file' enter a filename (e.g. location combined with a date).
-
Enter the 'Station name' and/or 'Station id' as defined in the Tide Definition File. Easting and Northing will be updated automatically.
-
The fields 'Vertical datum', 'Method' and 'Maintenance' are descriptive only. Enter as appropriate.
-
In the table under 'Tide Data' enter the values at the correct date and times.
-
At the bottom, actions can be carried out on the fields:
Add - Opens a window to add values at the bottom of the existing list.
Insert - Adds a value above the value currently selected at half the interval.
Delete - Removes selected values without recalculating the time frame.
Shift - Opens a window to shift data in days/hours/minutes (optionally backwards in time).
Edit UTC time - Opens the Time table for editing. Only one field at a time can be changed. -
Click OK if all data is correct.
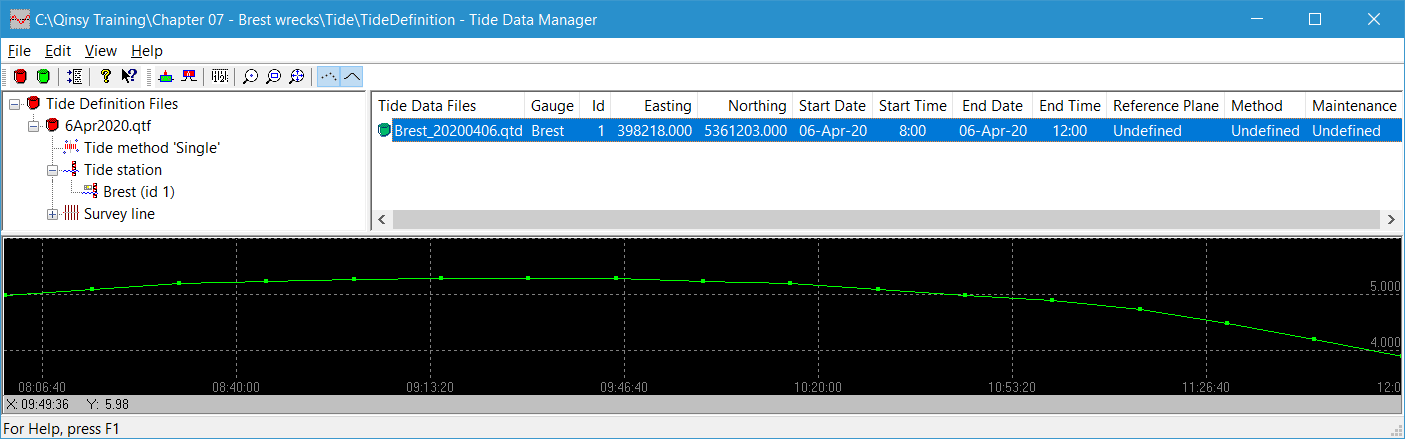
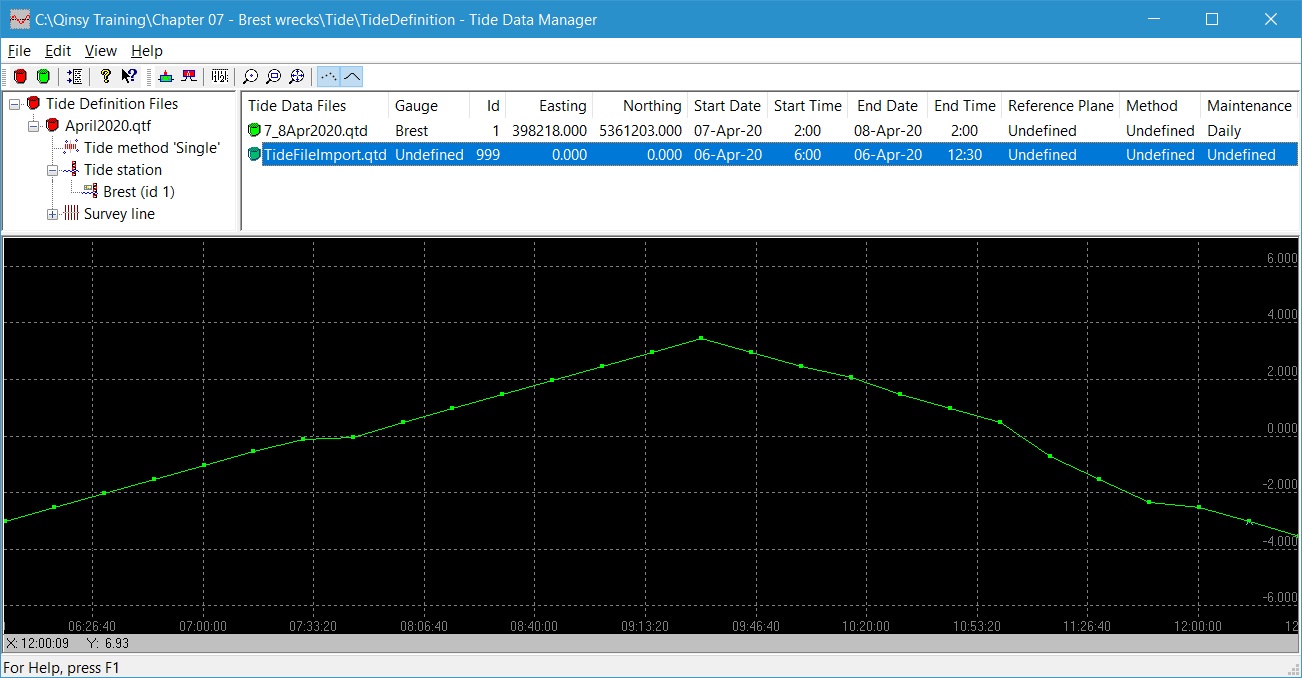
Click on the Tide Data File in the right hand panel.
In the bottom panel of the Tide Data Manager, a graphical view of the entered tides is seen.
Import Tide Data File
-
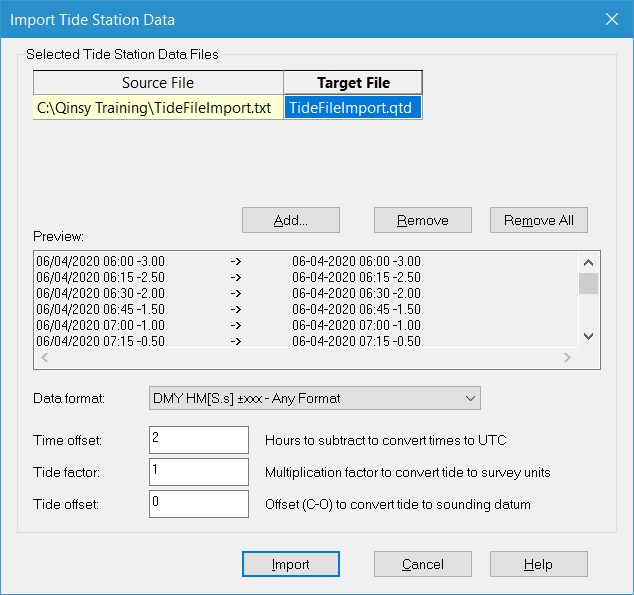
If 'Tide Data File' was selected as Data type, the Import Tide Station Data window appears:
-
Press 'Add' to browse for the correct file to be imported.
-
Select the correct Data format:
YMD HM[S.s] xxx – Any format - 2020207 13:20 1.25
DMY HM[S.s] xxx – Any format - 07022020 13:20 1.25
MFPS – Format (MET) - Format for Dutch Public Works; 3 files needed. (.adm .dat .kwa)
RIKZ Fixed format - Format for the Dutch Public Works
PREDUCT – Fixed format - Specific format for the Dutch Royal Navy
DMYHM xxx MSQ Dialmace format - 070220201320 1.250
Queensland MSQ HeightData format - Specific format containing four record types
ARGOSS – Fixed format - Date+time xcel format, x.xx m
FMA – Fixed format - First is a header and after that columns in the order year month date hour tide (in centimeters): 2020 9 17 1 43
HMS - Fixed Format - HH:MM:SS A.A Bige C.C D.D E. HH:MM:SS = Time of observation, A.A = Water level at time of observation
The other fields are unknown and not used: 02:03:01 24.47 Bige -0.03 24.5 29 -
Highlight the filename. Its contents will be displayed in the Preview pane.
-
Under 'Time offset' enter the time difference from UTC to local time.
-
Under 'Tide factor' enter a scale factor if the height is not in survey units.
-
Under 'Tide offset' enter a fixed C-O value if applicable.
-
Click on 'Import'.
The data is imported and in the right pane of the Tide Data Manager the file is available:
-
Highlight the file. In the bottom pane the tidal curve is displayed.
-
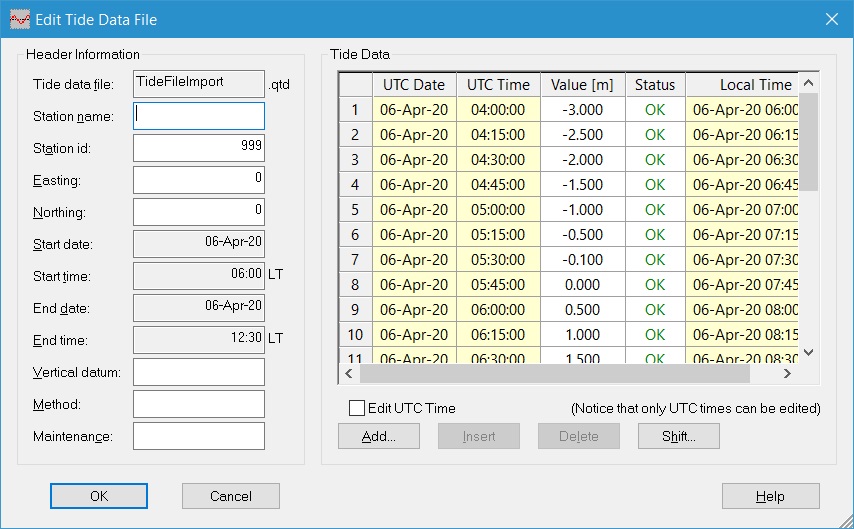
Double click the filename.
The 'Edit Tide Data' screen opens:
-
Enter the 'Station id'. The 'Station name' and coordinates (E/N) are automatically updated.
Press 'OK' to store the file. -
To import a second tide data file, go to menu File – Import Tide Data.
-
Repeat steps 1 to 11.
Now one or more tide files have been imported.
Before applying the tidal correction to the recorded data, the tidal data itself can be edited:
-
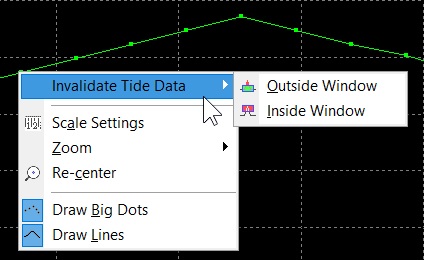
Move the cursor to the graphical pane.
-
Use the right mouse button to open the submenu. Select 'Invalidate Tide Data'.
-
Use the 'Inside Window' to de-activate a tidal reading.
-
Use the 'Outside Window' to activate a tidal reading.
-
Alternatively, double click the filename or select 'Edit Tide Data File' from the Edit menu.
-
There, in the field 'Status', right mouse click to open a submenu. Select 'OK', 'Invalid' or 'Predicted' from the list.
-
Click 'OK' once edits are finished. Answer 'Yes' to overwrite. Close the Tide Data Manager.
Tide Processor
Tidal data has been set up. Now it needs to be applied to the QPDs.
-
In the Survey Manager, select the QPDs to which tide will be applied.
-
Click on

-
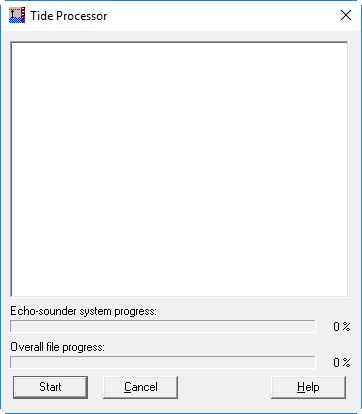
Click on Start.
-
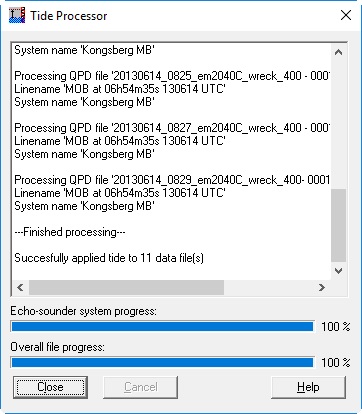
The following information should appear:
“Initializing”, “Processing QPD file ‘filename’”, list of system names,
“Finished processing”, “Successfully applied tide to <number> data file(s).
-
If this does not appear, something in the definition setup or tidal values, times, dates is incorrect. Repair and try again.
-
Click on Close.
Return to the Survey Manager.
-
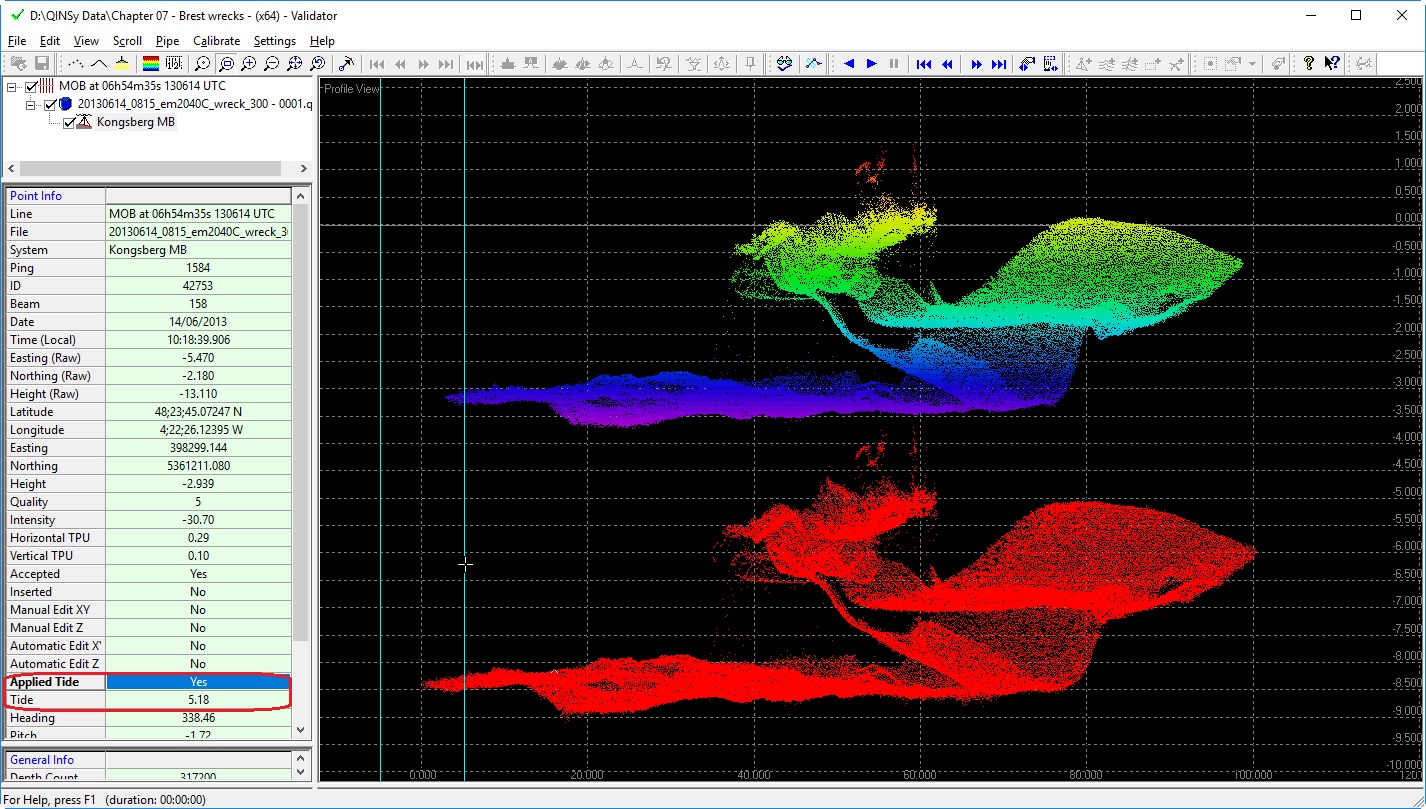
Load the QPD into the Validator.
-
In the Profile View, click right and activate “Show raw data”.
The raw data is displayed. The height difference should be the tidal correction. Move the cursor across the DTM and view the tidal value in the Point Info index. -
To compare raw value versus tidal filtered values, right click in Profile View. Select “Apply Tide to Raw data” to overlay the filtered with the raw values.
-
Tidal correction can be removed. Use Viewed Data=Validated from the Settings menu. And then Reset Tide from the Edit menu. Select All Data.
-
Close the Validator.
Working on a river
When using the linear method for multiple stations along a river, only use the two nearest stations required.
This method assumes an open water situation with tidal influence from all stations simultaneously.
Linear
The processing works as follows: Per ping (swath) one transducer position, ping time and tide value are stored in the QPD.
The time is used to look up the time interpolated station tide. Next the inverse distance from tide station to ping position is used as a weight to determine a single tide value.
So the closer the position to the tide station the larger the weight and the more influence its tide value has on the calculated tide.
If only one station is used then the weighting process is skipped.
Co Tidal
Per station you can define a time offset, scale factor and offset value. Positive time offset means that the tide lags behind on the station tide, e.g. High tide at station 11:00, in area 11:30, co tidal offset time is +00:30.
The processing works as follows: The ping time with the co-tidal time offset subtracted is used to look up the time interpolated station tide.
This value is corrected for scale factor and offset according to the formula Tide = scale factor x ( Station Tide + Offset).
For Co Tidal you can select one or more stations. When multiple stations are used then a distance weighting as explained above is applied to calculate a single value.
Applying tide to an RTK survey
If a survey was done with RTK it's always possible to replay the data and apply the tide afterwards.
When you have tidal data from only one or two stations, the easiest method is to create one or two tidal files and replay your data using these file(s).
First add one or two tide gauges to your recorded database, if they are not available in the database yet.
If they are already in the recorded database, check the vertical datum of the fixed node and check the position (position is only necessary when two tide gauges are used).
Add tide gauge(s)
It's not possible to clone new systems to other recorded databases. So if you have multiple databases that need to be replayed with tide, you will have to add a tide gauge individually for each database.
So if you know beforehand that possibly you will want to replay using tide add (a) tide gauge(s) to the template database.
See paragraph Database Setup for more information about adding tide gauges to a database.
After that replay your databases using the tidal files. See for more information on how to do that: How-to Tide Processing | How toTideProcessing TideDataFile.
Unreliable Positioning System
Make sure that the position system is set to Unreliable when replaying the database(s).
It is also possible to apply the tide to your QPD files in the Survey Manager.
First you have to replay all your databases with the position system set to Unreliable and create new QPD files.
Then follow the instructions given at How-to Tide Processing | How toTideProcessing Processing. (above)
Info
For offshore operations the heights from a GNSS receiver can be quite accurate, but still have some noise and sometimes even an incorrect height (spike).
The solution is filtering the height and presenting this as a pseudo tide.
To use the RTK Tide for height aiding, please refer to the following document: 'How-to Use/Setup RTK Tide'.