Description
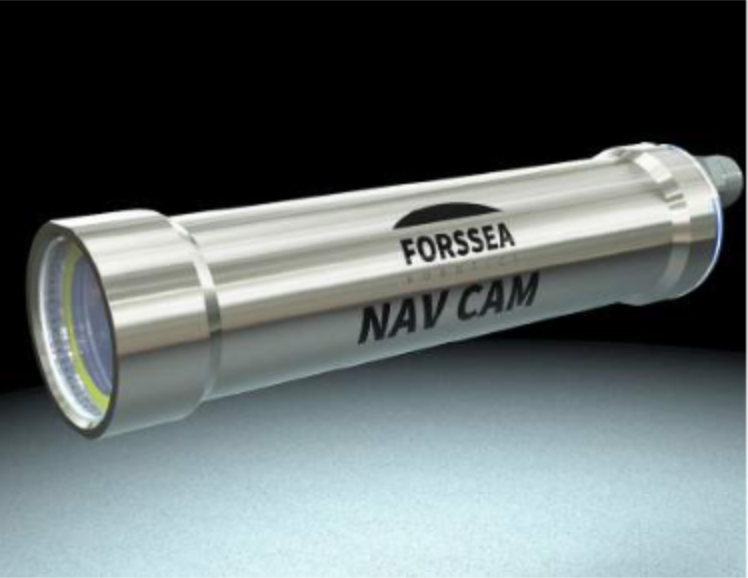
Driver to interface to the Forssea Robotics VLOC system. Forssea Robotics VLOC system is a computer vision based method, able to track and position underwater markers.
Measurements are done in real-time by a dedicated high-grade camera (called the Nav Cam), which is mounted on an ROV.
The driver provides relative positions of markers and absolute orientations of those markers when the VLOC system is coupled with a performant gyro.
Driver Information
|
Driver |
Forssea VLOC |
Interface Type |
UDP |
Driver Class Type |
Freebase |
Created |
|
|---|---|---|---|---|---|---|---|
|
Yes |
Input / Output |
Input |
Executable |
DrvQpsFreebase.exe VLOC UTC |
Updated |
|
|
|
Related Systems |
|
||||||
|
Related Pages |
|
||||||
Format
The system uses a text based format. Depending on whether or not a 'high performant gyro' is coupled to the system, the system will output the $VLOC string (no gyro coupled) or the $VLOC_ABS string (gyro coupled). The only difference between the two strings is that the $VLOC_ABS string contains absolute attitude data. The data string look as follows:
$VLOC,hhmmss.ss,mm,dd,yyyy,i,x.xxx,y.yyy,z.zzz,R.RR,P.PP,Y.YY,I.III,J.JJJ,K.KKK,L.LL,M.MM,N.NN<CR><LF>
$VLOC_ABS,hhmmss.ss,mm,dd,yyyy,i,x.xxx,y.yyy,z.zzz,R.RR,P.PP,Y.YY,r.rr,p.pp,h.hh,I.III,J.JJJ,K.KKK,L.LL,M.MM,N.NN<CR><LF>
|
Parameter |
ASCII model |
unit |
Resolution |
Range |
definition |
sign convention |
Available in |
|---|---|---|---|---|---|---|---|
|
Header |
$VLOC/$VLOC_ABS |
|
|
|
ASCII Header
|
|
Both strings |
|
UTC Time |
hhmmss.ss |
second |
10^-2 s |
|
UTC Time in Hour, Minutes, Seconds |
|
Both strings |
|
Month |
mm |
month |
1 |
1<->12 |
Month
|
|
Both strings |
|
Day |
dd |
day |
1 |
1<->31 |
Day
|
|
Both strings |
|
Year |
yyyy |
year |
1 |
2019<- >2099
|
Year |
|
Both strings |
|
Id |
i |
|
|
0 <-> 10000 + |
Identifier of the marker |
|
Both strings |
|
X |
+/-x.xxx |
Meter |
10^-3 m |
|
Distance from the center of the camera glass to the center of the marker on Nav Cam X axis |
>0 When the center of the marker is to the right of the center of the camera glass |
Both strings |
|
Y |
y.yyy |
Meter |
10^-3 m |
|
Distance from the center of the camera glass to the center of the marker on Nav Cam Y axis |
>0 |
Both strings |
|
Z |
+/-z.zzz |
Meter |
10^-3 m |
|
Distance from the center of the camera glass to the center of the marker on Nav Cam Z axis |
>0 When the center of the marker is above the center of the camera glass |
Both strings |
|
Roll |
+/-R.RR |
Decimal Degree |
10^-2 Deg |
-180<->180 |
Roll of the marker relatively to the camera |
>0 When the bottom left corner of the marker goes up
|
Both strings |
|
Pitch |
+/-P.PP |
Decimal Degree |
10^-2 Deg |
-90<->90 |
Pitch of the marker relatively to the camera |
>0 When the top of the marker gets further from the camera |
Both strings |
|
Yaw |
Y.YY |
Decimal Degree |
10^-2 Deg |
0 <-> 180 |
Yaw of the marker relatively to the camera |
>0 |
Both strings |
|
Absolute Roll |
+/-r.rr |
Decimal Degree |
10^-2 Deg |
-180<->180 |
Roll of the marker relatively to the gravity frame |
>0 When the bottom left corner of the marker goes up |
only in $VLOC_ABS string |
|
Absolute Pitch |
+/-p.pp |
Decimal Degree |
10^-2 Deg |
-180<->180 |
Pitch of the marker relatively to the gravity frame |
>0 When the top of the marker gets further from the camera |
only in $VLOC_ABS string |
|
Absolute Heading |
h.hh |
Decimal Degree |
10^-2 Deg |
0 <-> 360 |
Heading of the marker relatively to the gravity frame |
North =0 East= 90 |
only in $VLOC_ABS string |
|
X standard deviation |
I.III |
Meter |
10^-3 m |
|
Standard deviation in X measurement |
>0 |
Both strings |
|
Y standard deviation |
J.JJJ |
Meter |
10^-3 m |
|
Standard deviation in Y measurement |
>0 |
Both strings |
|
Z standard deviation |
K.KKK |
Meter |
10^-3 m |
|
Standard deviation in Z measurement |
>0 |
Both strings |
|
Roll standard deviation |
L.LL |
Decimal Degree |
10^-2 Deg |
0<->180 |
Standard deviation in Roll measurement |
>0 |
Both strings |
|
Pitch standard deviation |
M.MM |
Decimal Degree |
10^-2 Deg |
0<->90 |
Standard deviation in Pitch measurement |
>0 |
Both strings |
|
Yaw standard deviation |
N.NN |
Decimal Degree |
10^-2 Deg |
0 <-> 180 |
Standard deviation in Yaw measurement |
>0 |
Both strings |
Decoding Notes
The driver decodes USBL, Gyro, Attitude and Miscellaneous systems.
The following table shows how the observation data is related to the data in the decoded string:
|
System |
Observation |
Data field |
|---|---|---|
|
Gyro |
heading |
Absolute Heading |
|
heading quality indicator |
Yaw standard deviation |
|
|
Pitch Roll Heave |
Pitch |
Absolute Pitch |
|
Pitch quality indicator |
Pitch standard deviation |
|
|
Roll |
Absolute Roll |
|
|
Roll quality indicator |
Roll standard deviation |
|
|
USBL |
X |
X |
|
X quality indicator |
X standard deviation |
|
|
Y |
Y |
|
|
Y quality indicator |
Y standard deviation |
|
|
Z |
Z |
|
|
Z quality indicator |
Z standard deviation |
|
|
Miscellaneous |
X SD |
X standard deviation |
|
Y SD |
Y standard deviation |
|
|
Z SD |
Z standard deviation |
|
|
Roll SD |
Roll standard deviation |
|
|
Pitch SD |
Pitch standard deviation |
|
|
Yaw SD |
Yaw standard deviation |
Warning
Please note that Gyro and Attitude observations are decoded from the absolute attitude parts of the data string.
This data will only be available when 'a performant gyro' is coupled to the system.
System Interfacing
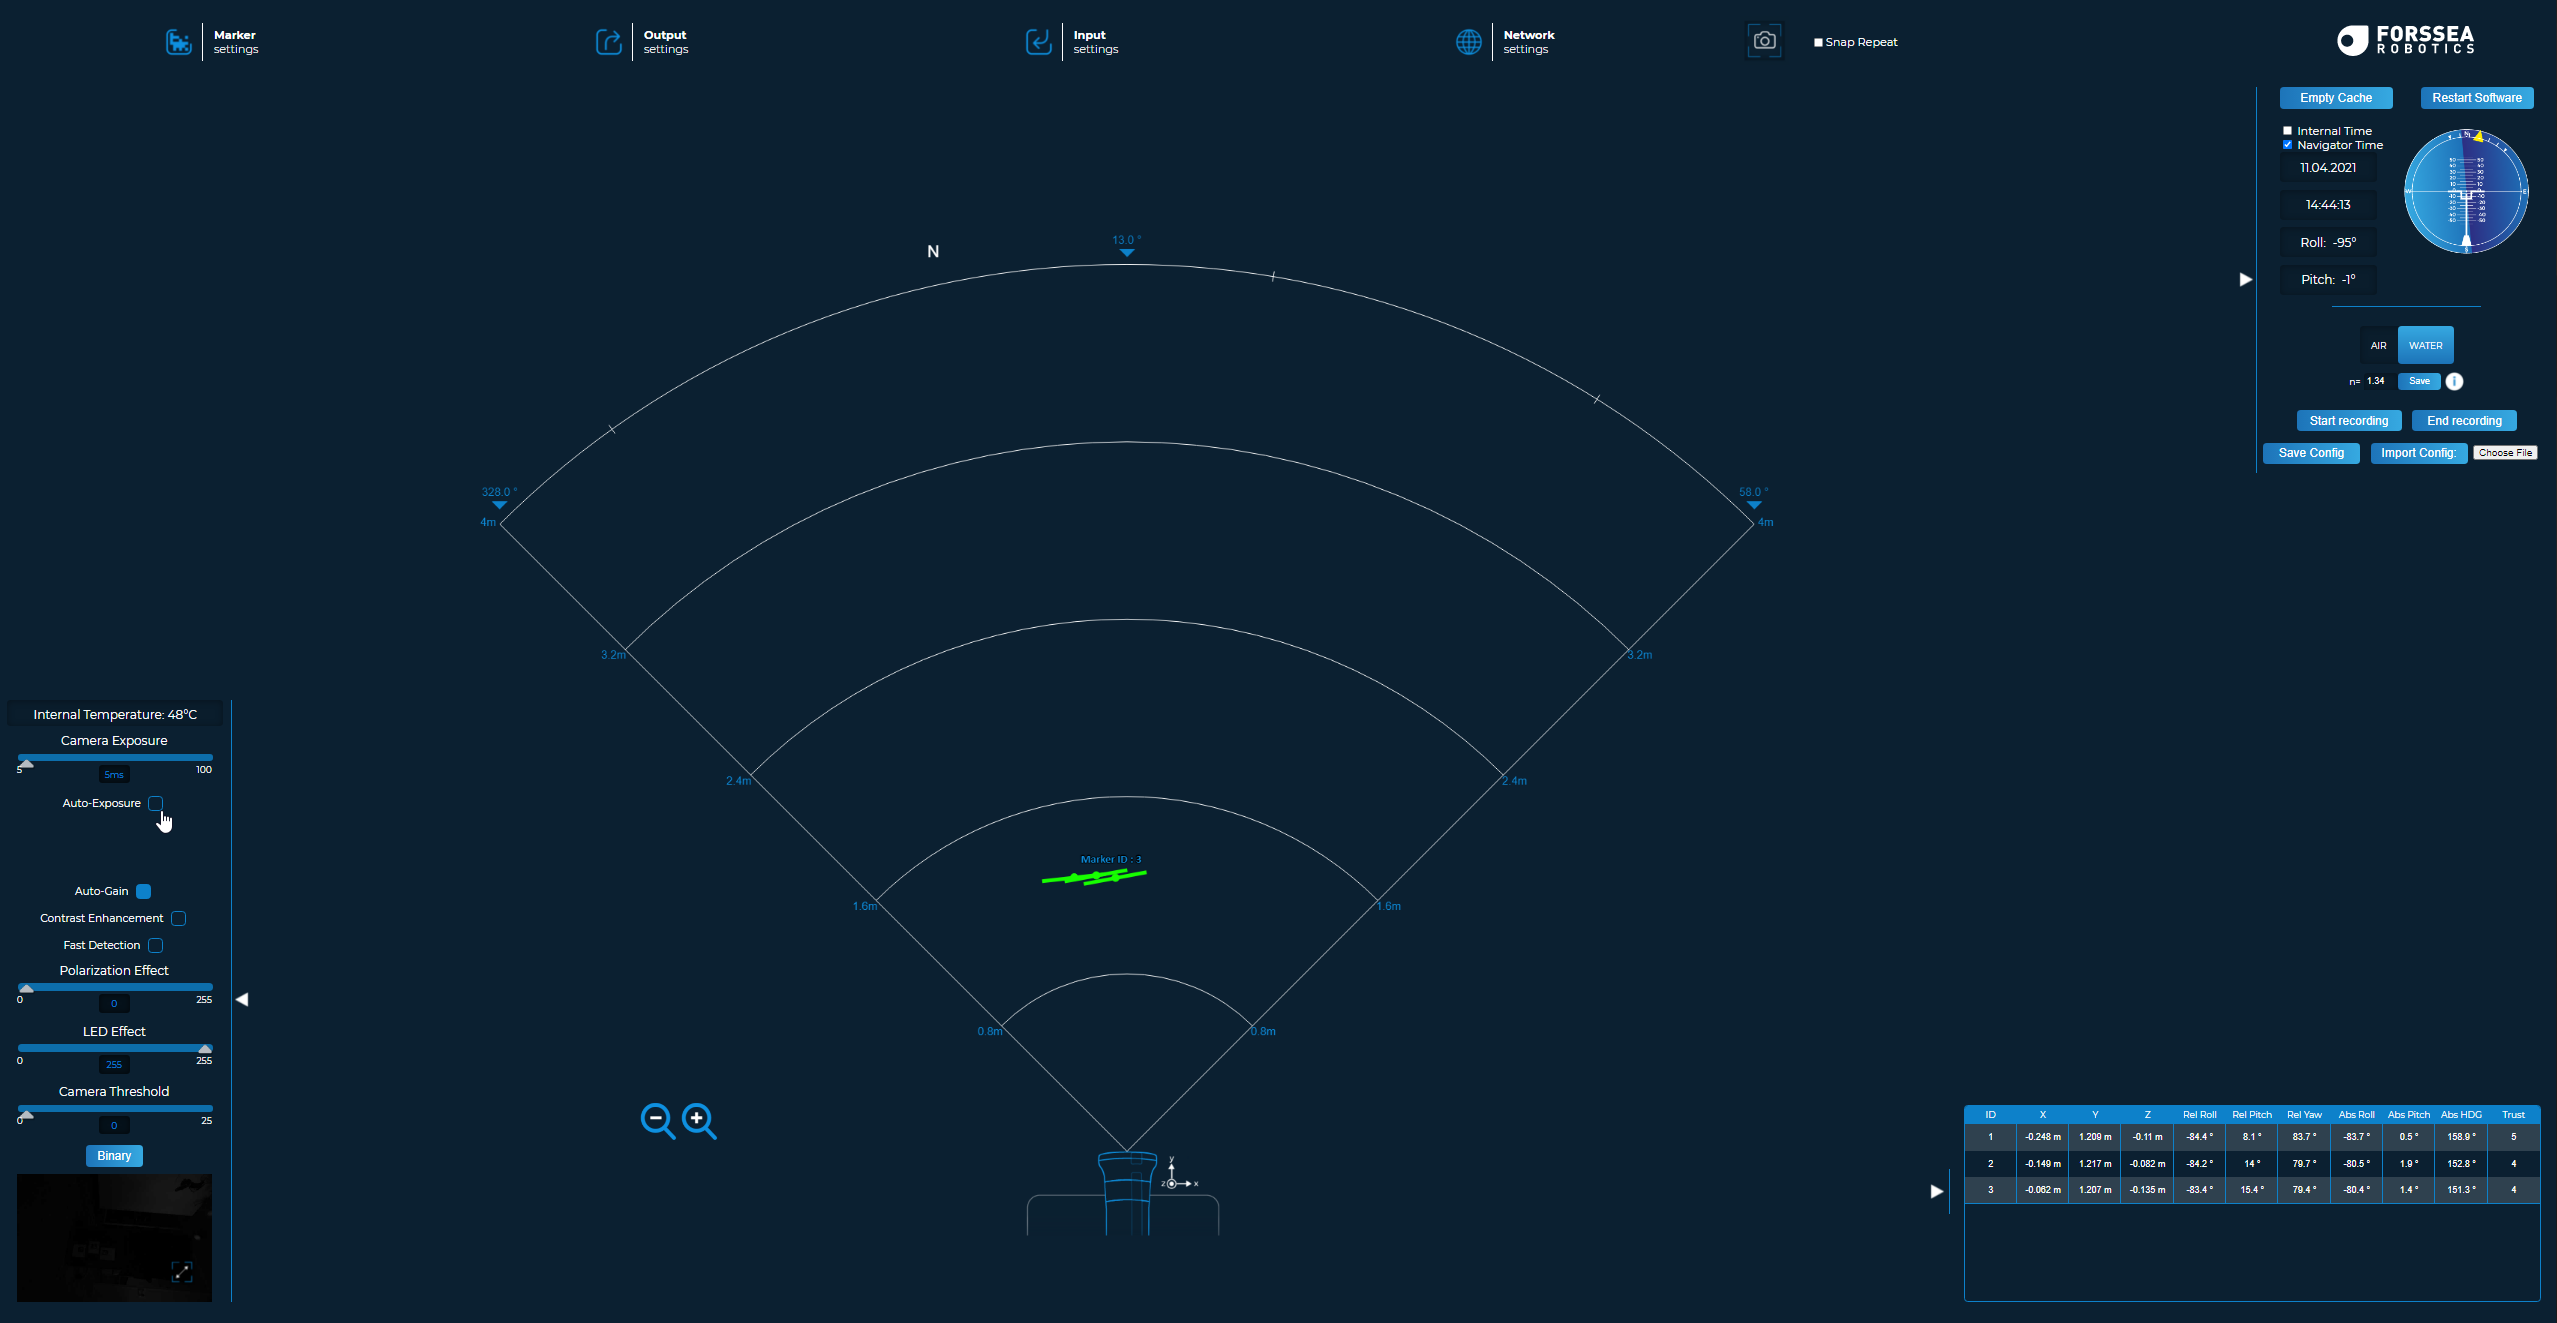
The interfacing of the Forssea camera is done via the general web interface.
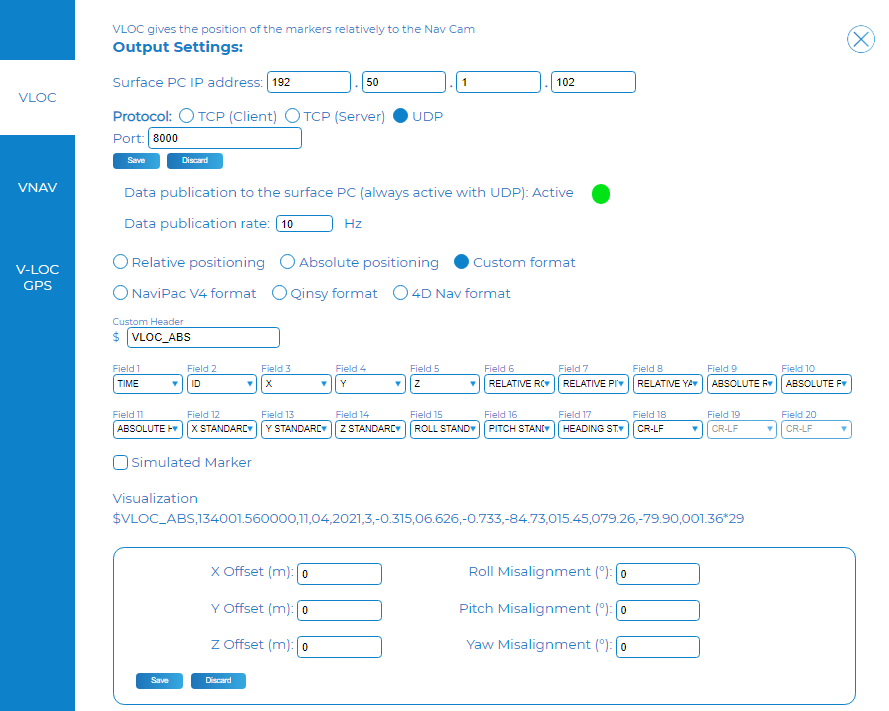
In the Output Settings tab the format can be defined. Select to output a Custom format and select the fields as explained in the Format section of this document.
Output the VLOC_ABS to decode Pitch, Roll and Yaw; output the VLOC if only dx dy dz (USBL) are required.
To be able to decode the absolute pitch, roll and heading, an AHRS (gyro and motion) sensor needs to be interfaced which outputs a TAH ($PHOCT) string.
This can be done in the Input Settings:
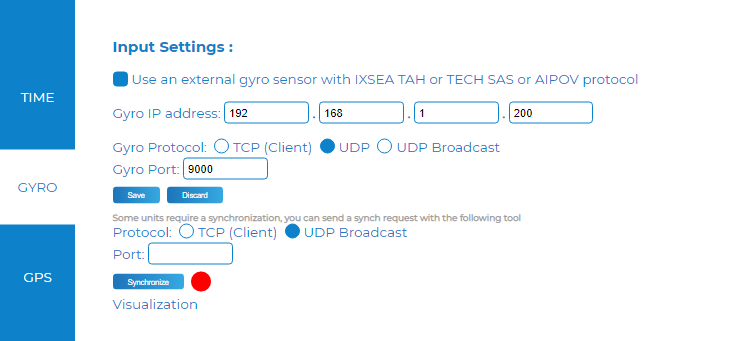
For further information please refer to the Nav Cam User Guide.
Database Setup
The V-LOC system outputs UDP data. Make sure that the system sends data to the same port as the one configured in Qinsy.
We advise to send the data to the broadcast IP address (255.255.255.255).
Depending on whether or not a 'high performant gyro' is coupled to the system, the system will output the $VLOC string (no gyro coupled) or the $VLOC_ABS string (gyro coupled).
The only difference between the two strings is that the $VLOC_ABS string contains absolute attitude data, but this means a different database setup is required.
Below follows a step by step guide on how to interface the 2 different methods. At the end of the section a detailed system setup can be found.
Option 1: Interfacing the VLOC (USBL)
When interfacing the VLOC as a USBL sensor only, each marker can be added as a node on the subsea structure that needs to be positioned.
Pay attention to the SD values defined in the Computation Setup: if these are too tight the computation might fail.
In case markers are added as node locations, the least squares adjustment will calculate a mean position for the subsea structure.
For more information see Knowledge Base article 'How-to Computation Setup'.
-
Add a USBL sensor as described below. For each Marker on the object a target can be added.
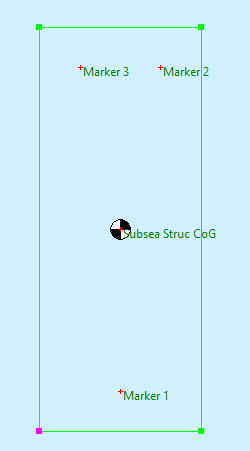
-
On the object all the marker can be added as node locations.
Option 2: Interfacing the VLOC ABS (USBL, MRU and Gyro)
By interfacing the VLOC ABS, the absolute pitch, roll and heading of the Marker can be decoded. All the individual markers have their own reference frame.
This means a correction must be made to align the reference frame of the marker with the reference frame of the object in Qinsy.
To be able to correct for this misalignment, it is advised to make use of separation objects, rotation angle sensors and linked objects.
Below a description on the suggested database setup.
-
Treat each marker as a separate object.
Create an object of type ROV, and create a shape that represents the size of the marker.
Add a node location for the reference point of the marker.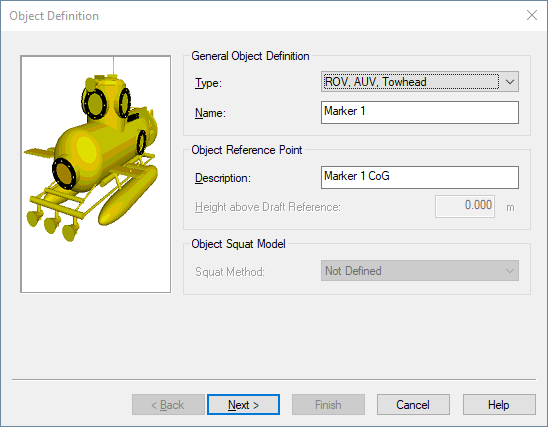
-
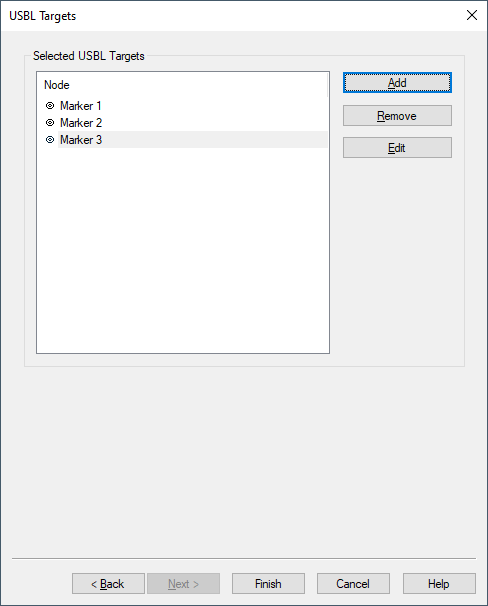
From the main object, add a USBL sensor as described below. Add a target for the Marker:
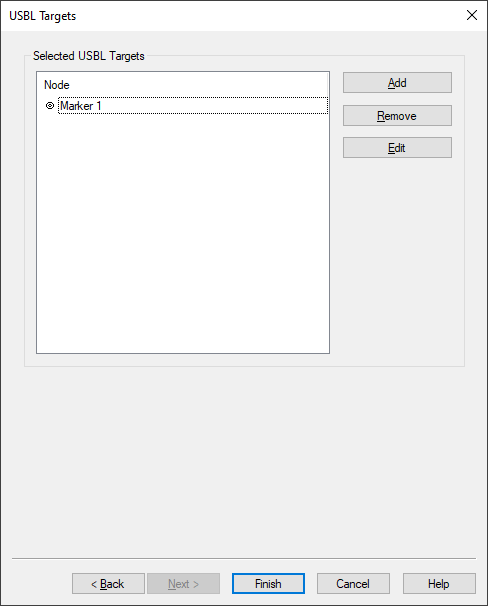
-
Create for each marker object a Linked object which represent the subsea structure.
Add a node location that represents the reference point / location of the marker.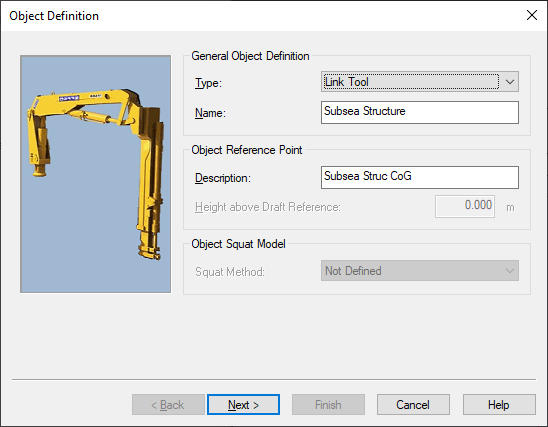
-
Link both marker nodes on the subsea structure and the Marker object itself.
A link is created by right clicking on Link: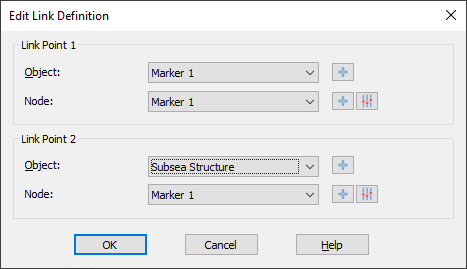
-
Add a PRH and Gyro sensor as explained in the PRH and Gyro section on the marker ROV object.
-
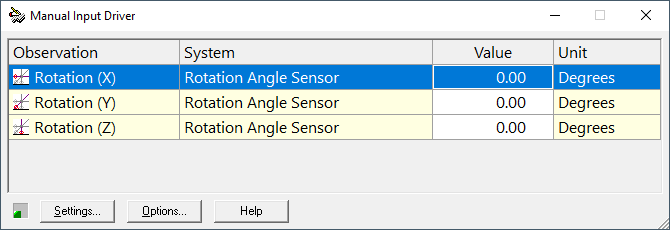
Add a manual rotation sensor on the linked object (not the marker object). Add all rotation axes on each subsea structure object.
This manual rotation sensor is used to correct for the misalignment between the Qinsy reference frame and the marker reference frame.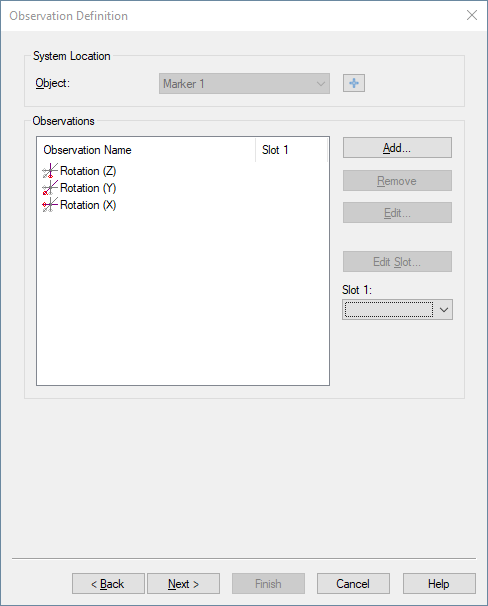
-
Below an overview of the database Setup when using a single marker:
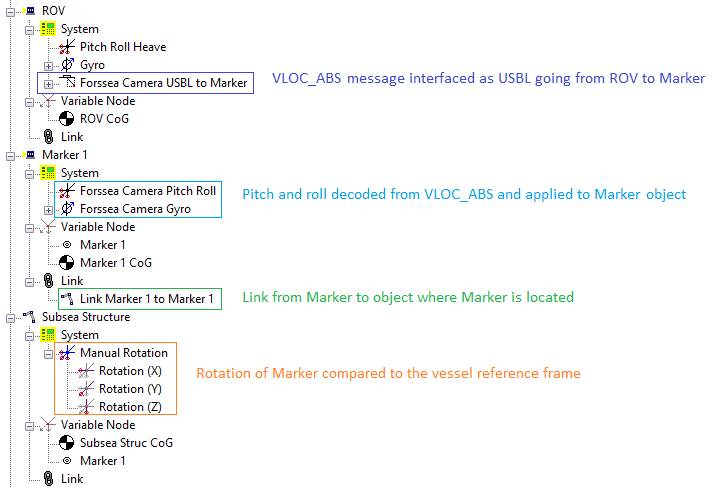
-
Repeat step 1 till 7 for each individual marker.
-
When online, each calculated marker position can then be compared and enabled/disabled.
This is different from interfacing the VLOC message only where an LSA calculates a mean position.
Example template
Please find attached an example template:
Template Forssea Test Setup.db
USBL system
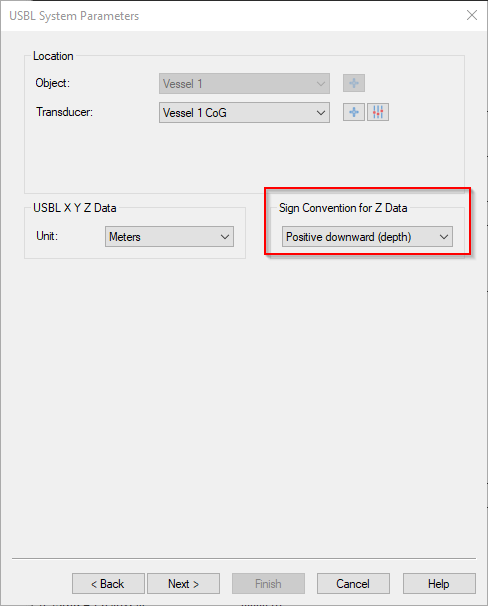
-
Make sure the Sign convention for Z Data is set to 'Positive upward'.
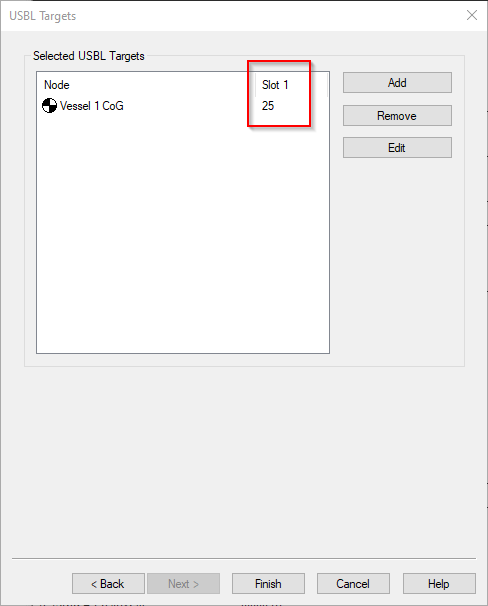
-
Use the marker ID as the slot ID when adding targets.
Pitch Roll Heave system
The absolute pitch and roll are decoded by this system.
Warning
If 'a performant gyro' is not coupled to the system, pitch and roll will not be decoded.
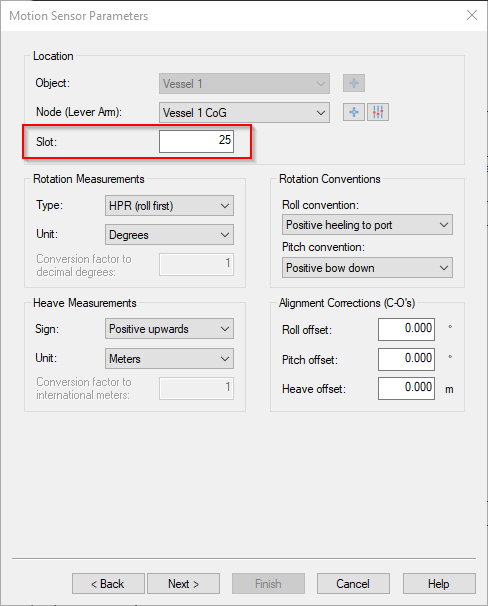
-
Use the marker ID as the slot ID.
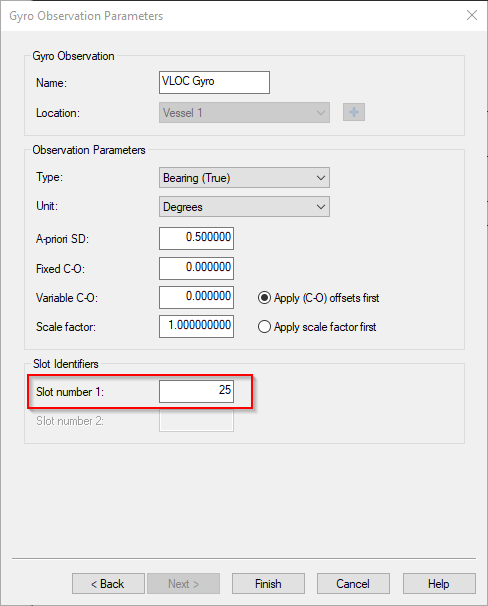
Gyro system
The absolute heading is decoded by this system.
Warning
If 'a performant gyro' is not coupled to the system, heading will not be decoded.
-
Use the marker ID as the 'Slot number 1'.
Miscellaneous system
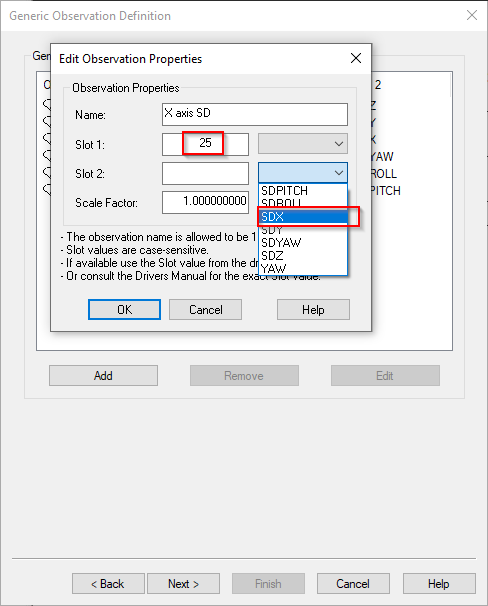
When adding observations:
-
Use the marker ID for Slot 1
-
Choose the observation to decode from the drop down box for Slot 2
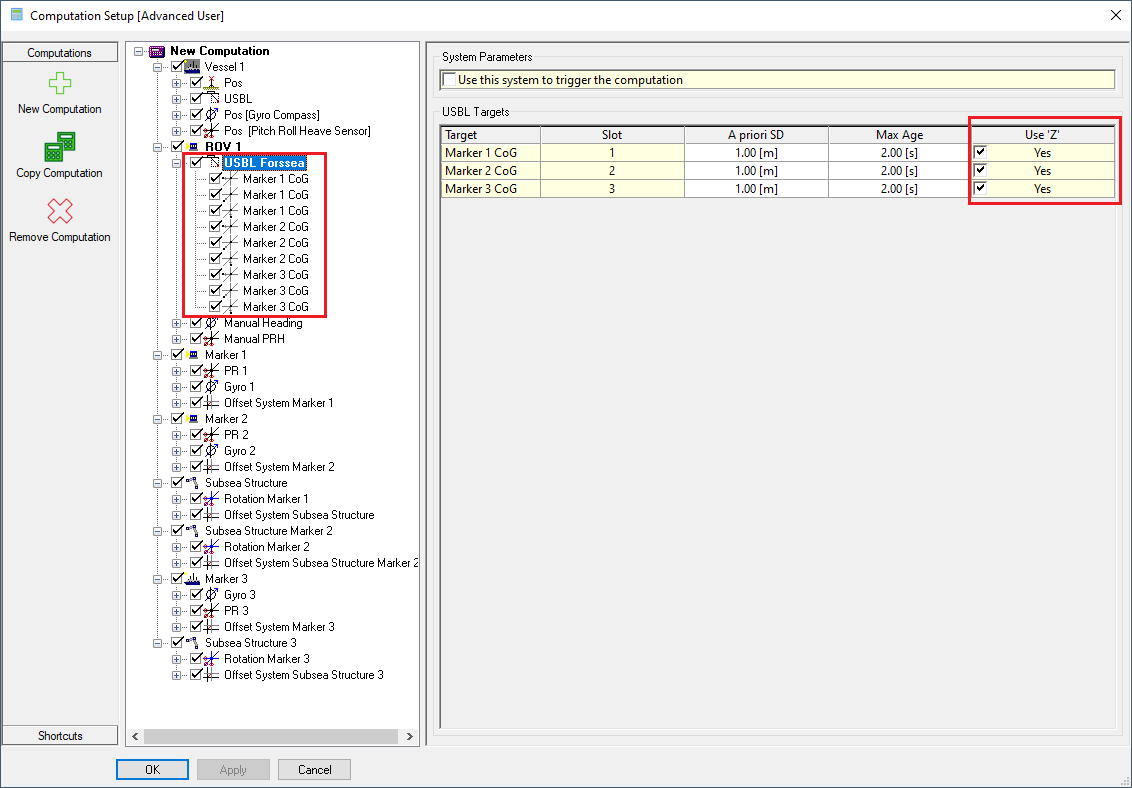
Qinsy Online
Make sure to enable all USBL observation in the Computation Setup with the 'Use Z' option ticked.
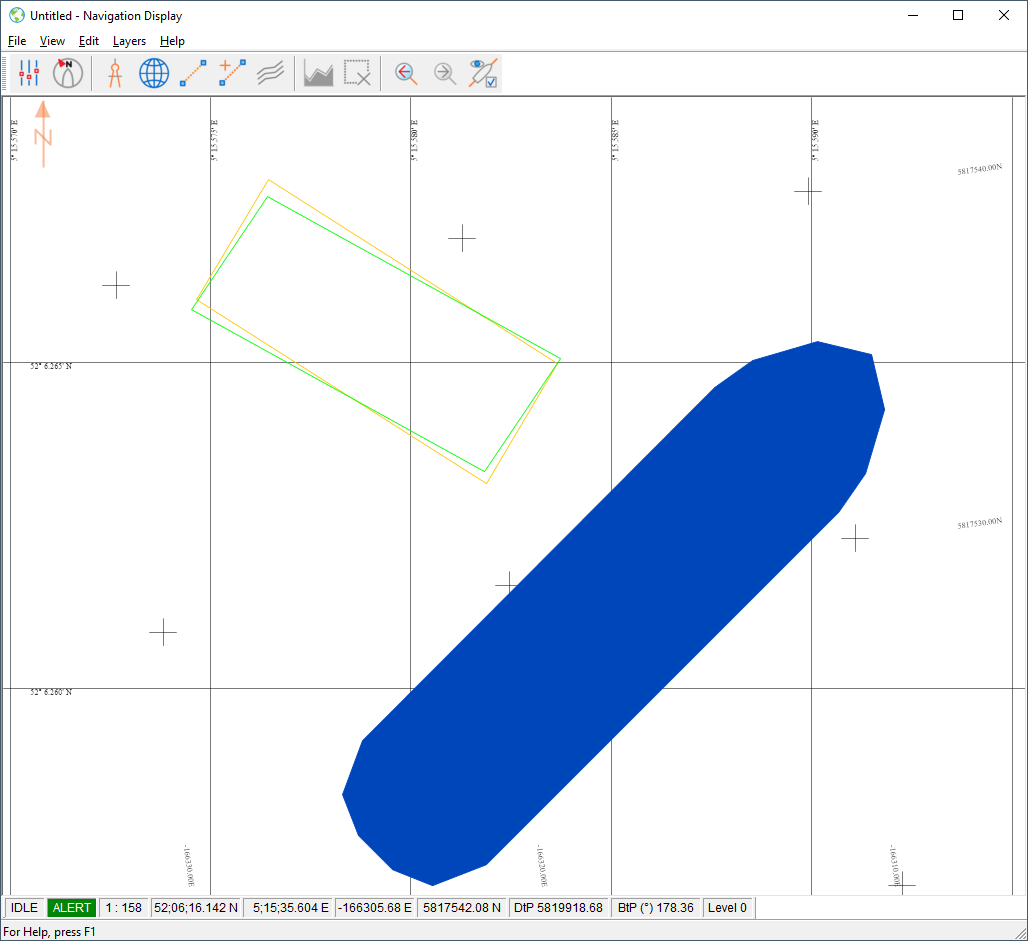
A single object will be calculated in case the USBL VLOC message is interfaced:

Or multiple if the VLOC_ABS is interfaced and depending on how many markers are in view:
When online, an additional window is shown where the rotation offsets can be entered to align the reference frame of the Marker with the Object reference frame: