
This page goes through how-to create THU/TVU layers for your survey, as well as whether the resulting values make sense.
Step 1: Verify your SD values
The first thing to do is check your standard deviation (SD) values for each hardware system in your survey.
If neither specific static or variable SD values are entered or imported, Qimera will use default SD values of a 0.5m horizontal uncertainty and a 1m vertical uncertainty.
Variable Values
In some circumstances, a time series of your SD values can be imported and used by Qimera:
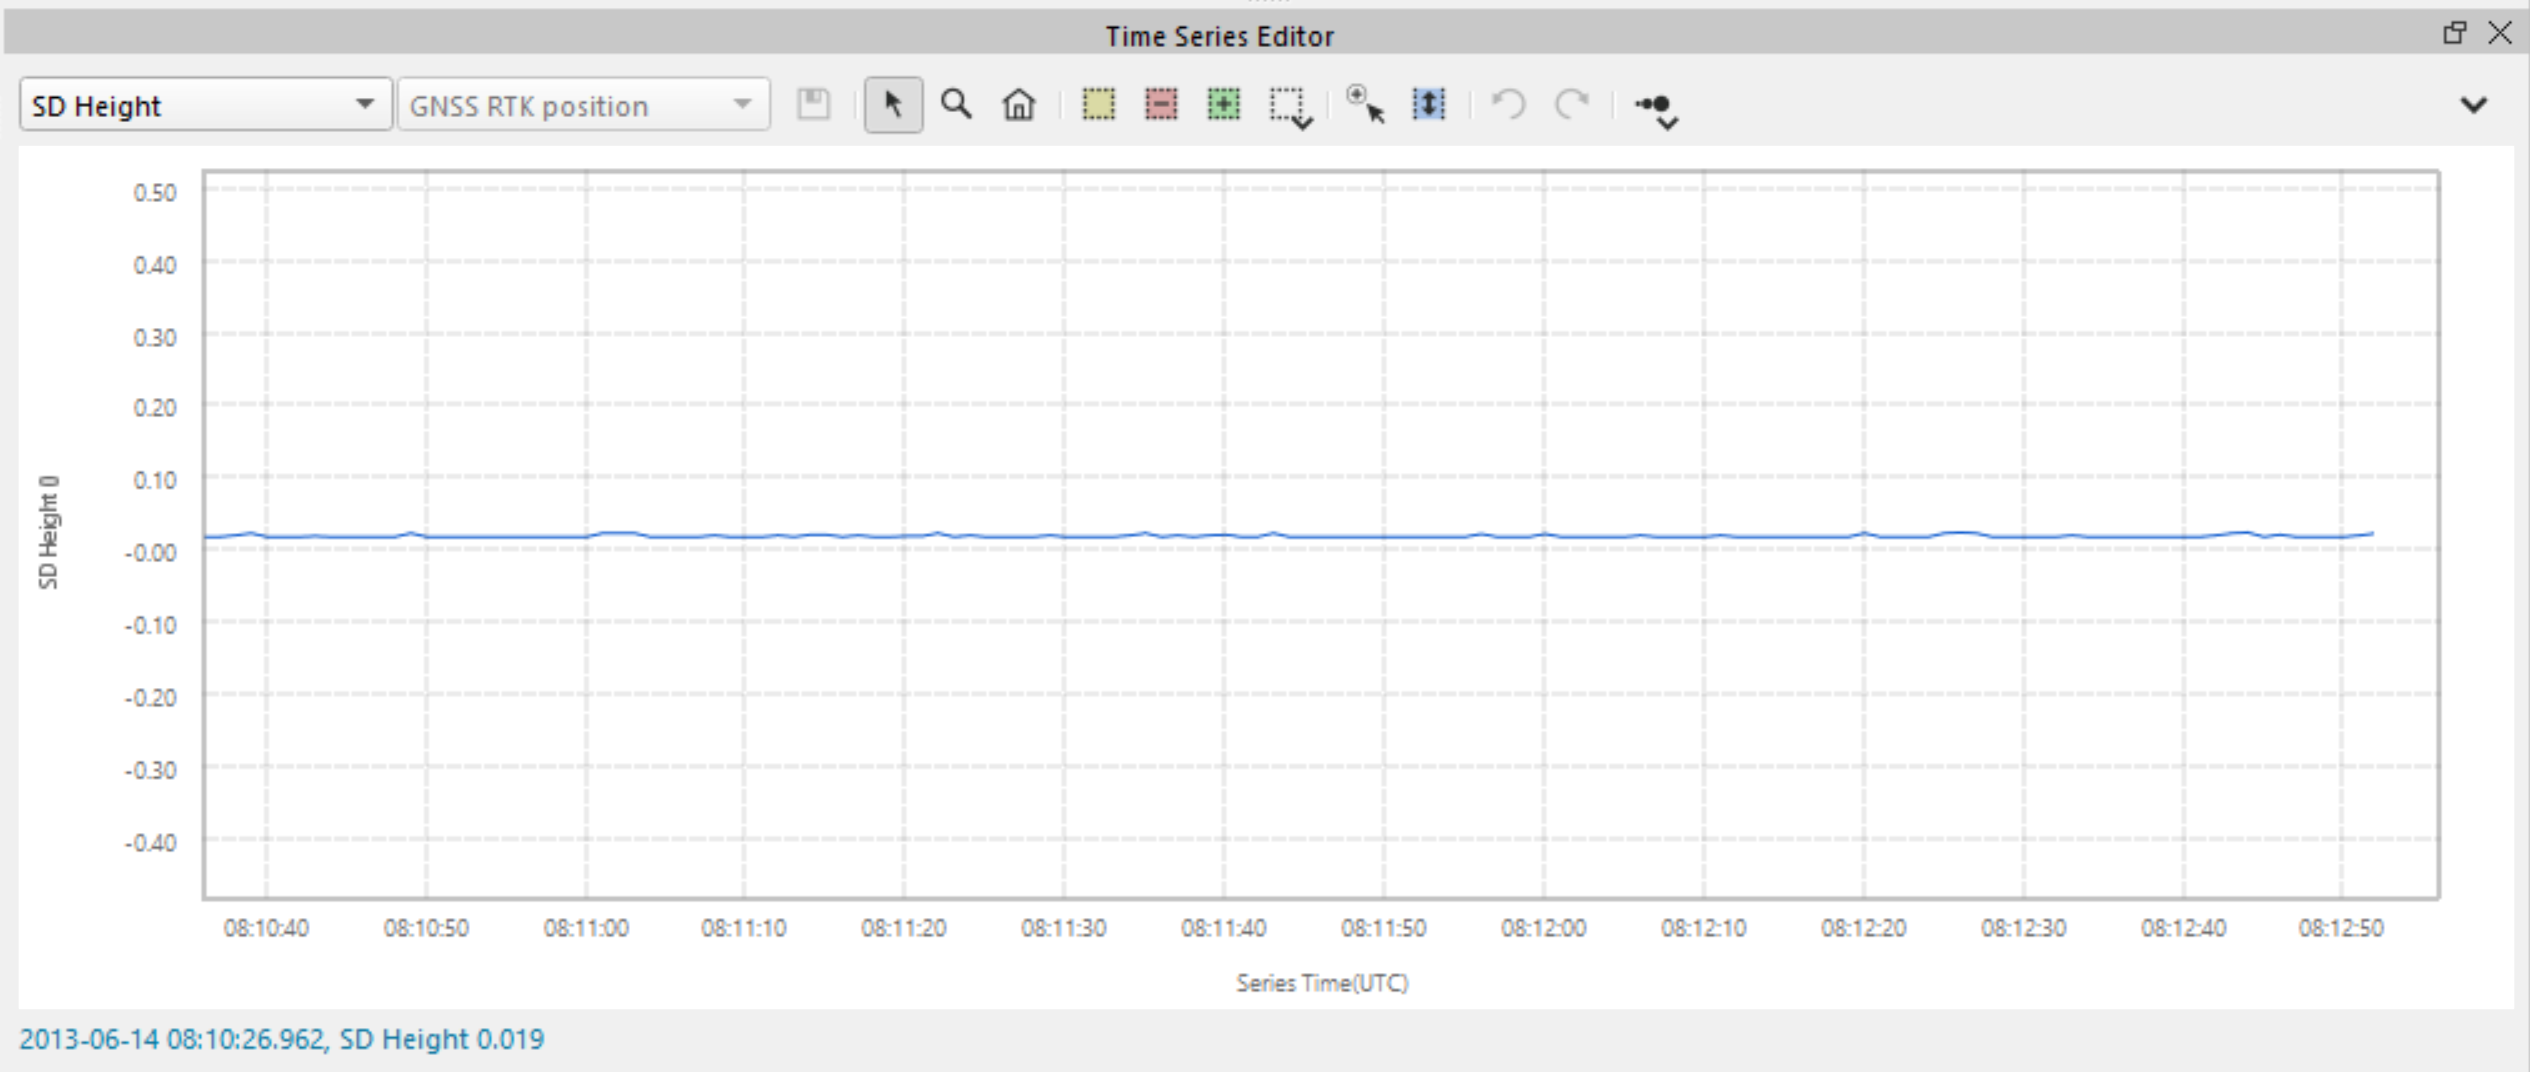
Where Qimera will use the time series of SD values from the raw file for the THU/TVU layer creation when available, which can be seen in the time series editor. These time series are given higher priority than the static values in the vessel editor.
There are two ways to bring this data into Qimera, either by importing raw source files or navigation files which contain the SD time series. For example if you are working with a POSMV system, you may be importing your sbet/smrmsg file pair into your Qimera project, which would include the SD values in the smrmsg file. For more information on that import, please see the following how to: https://qpssoftware.scrollhelp.site/qimera/how-to-import-binary-navigation
Static Values
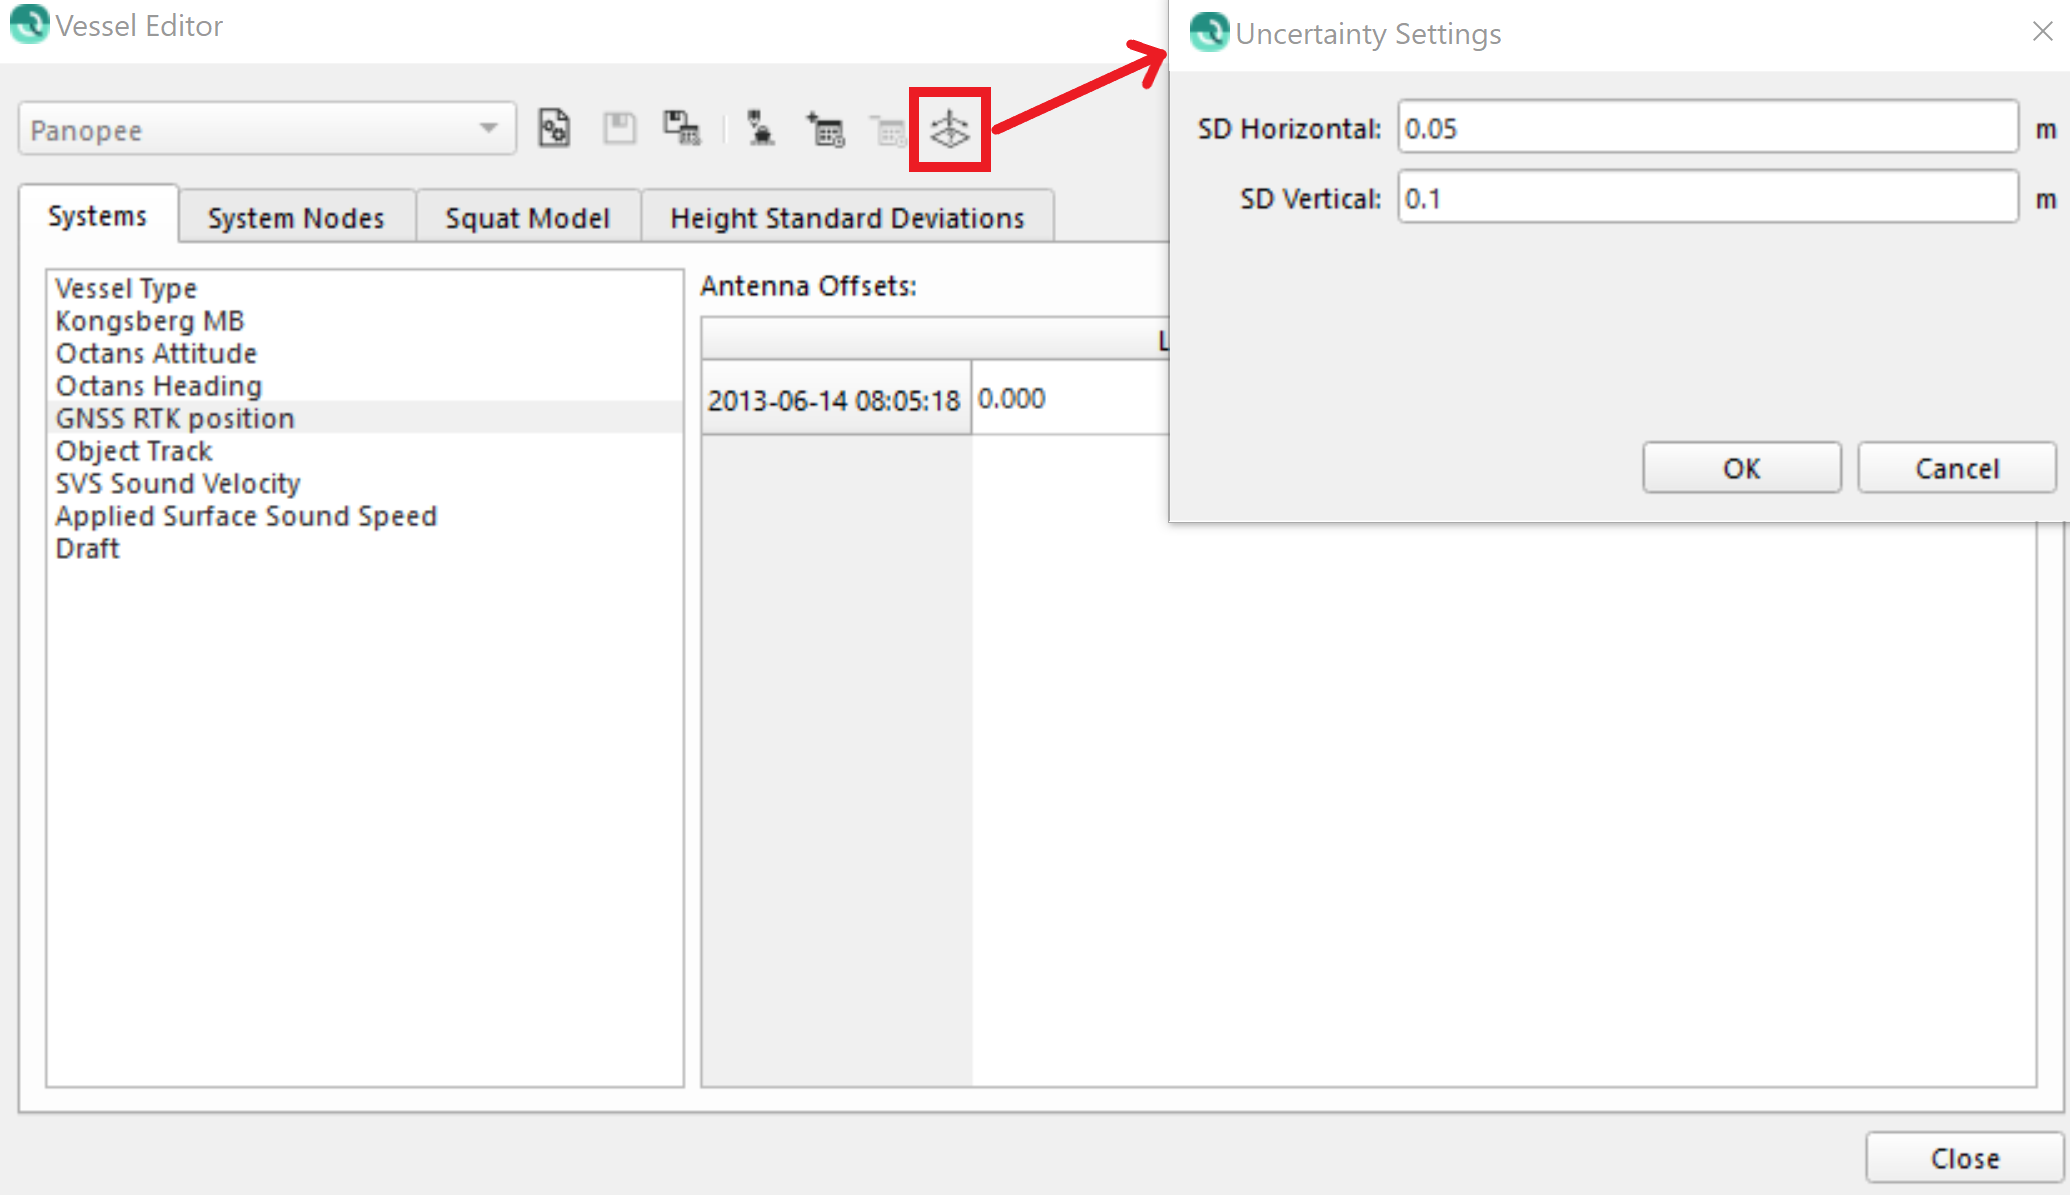
The SD values for your specific systems can be found in the manufacturers manuals that should have been received with your systems. Once found, you can enter them in the Vessel editor for each selected system by selecting the TPU option:
These may have been saved into the vessel configuration, if they were entered by the onboard survey team during data acquisition and you are working with a raw sonar file format which Qimera can read the SDs from. For more information on the SD values that would be setup in Qinsy by the survey team, please see the following how-to: https://qpssoftware.scrollhelp.site/qinsy/how-to-total-propagated-uncertainty-tpu
Whether the SD values are read from the raw file or not, we always recommend double checking the SD values in the vessel editor with the values from the manufacturer.
Step 2: Create THU and TVU layers
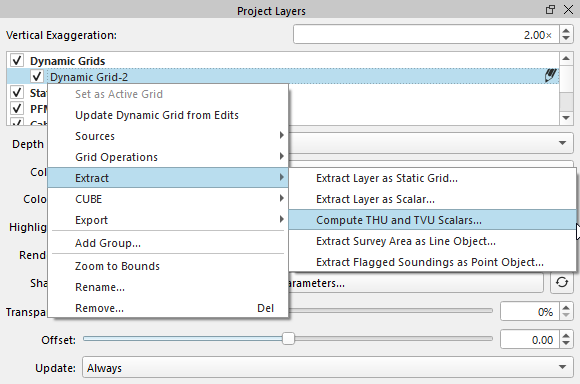
Now that the SDs are confirmed, you can have Qimera use them to create the THU/TVU layers. To do this, select a dynamic grid you would like to create the TPU layers for. Then right click on the Dynamic Grid and select Extract - Compute THU and TVU Scalars:
If you are working with a version of Qimera older than 2.7.0, you would instead select the ‘Create THU and TVU layers’ from the Dynamic Grid dropdown menu.
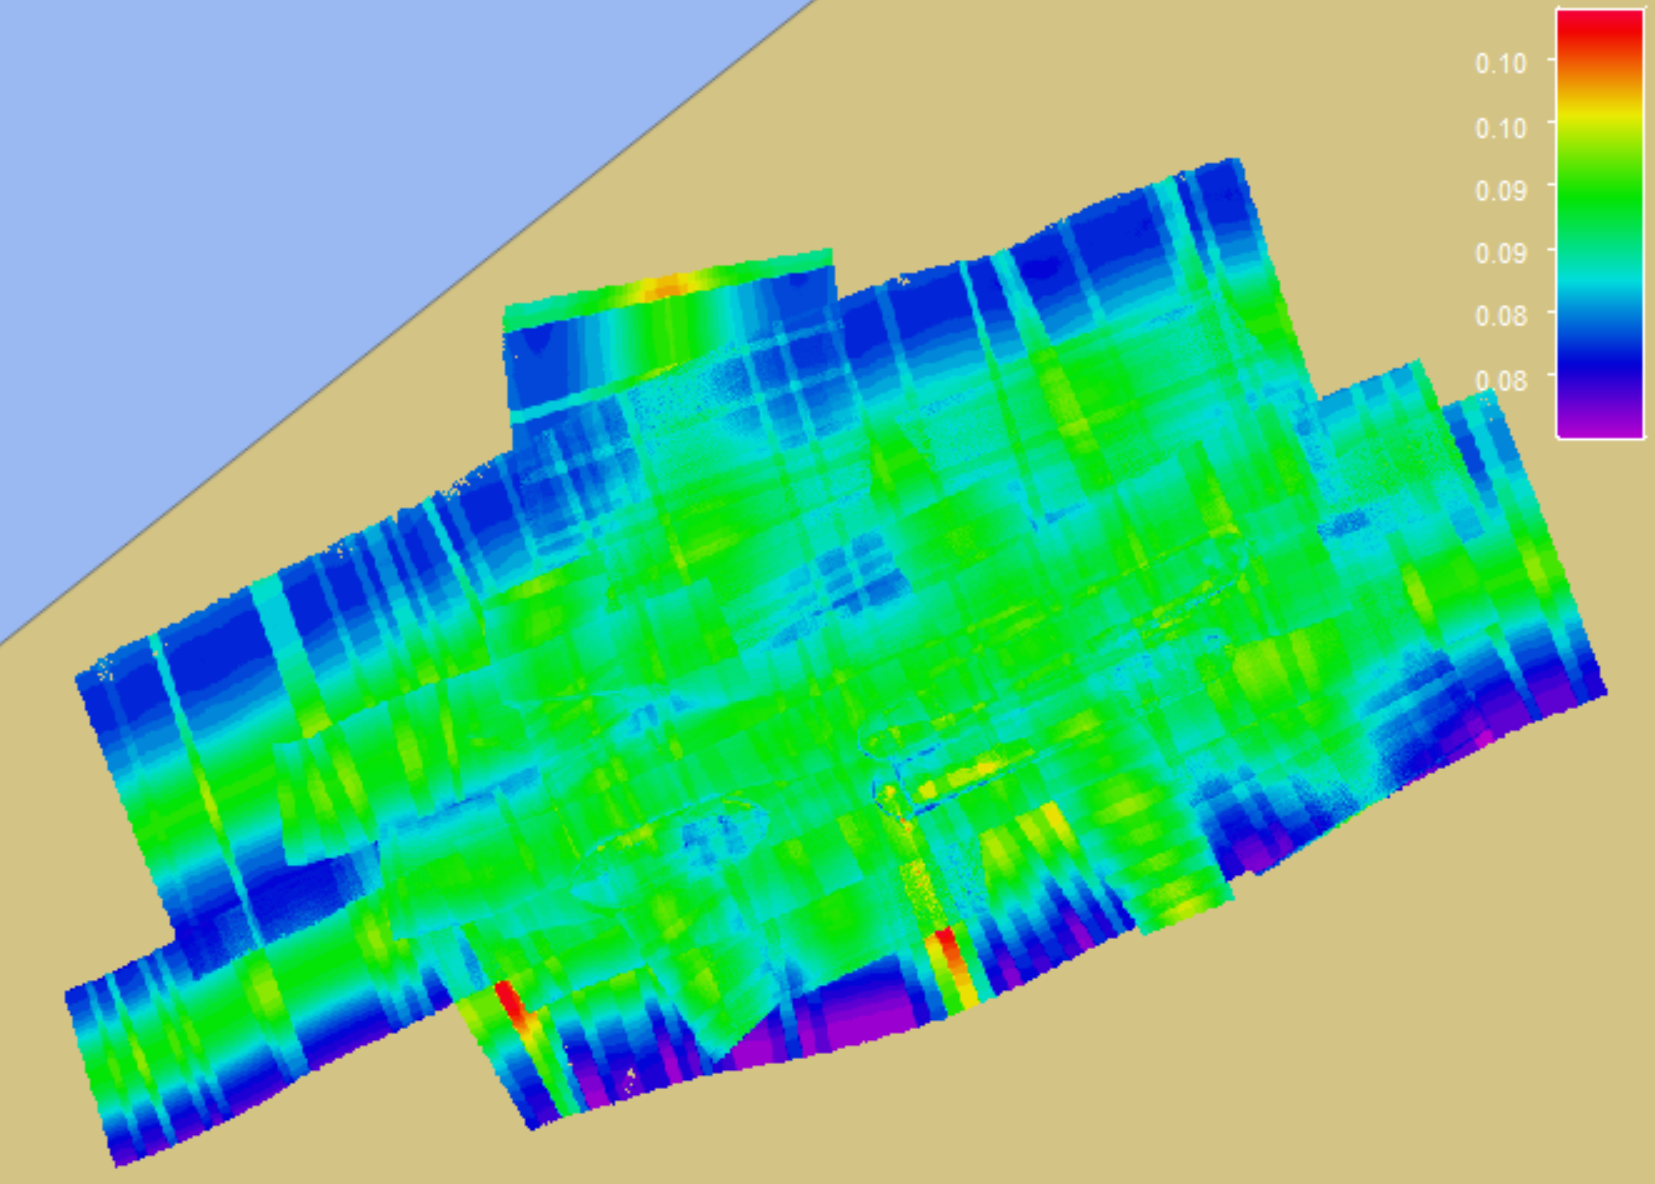
This will begin the process, and once the layers are created they will be automatically loaded into the project, and will be found under the SD Objects section in the Project Layers tab.
Step 3 - Check the results (Optional)
This step can technically be done before the creation of the TPU layers or not at all, but it can be handy to know whether the values you are getting from Qimera make sense with general uncertainty equations.
Please keep in mind that the following is a simplified outline, as we are only looking at the nadir values and not taking many factors into consideration.
Total Vertical Uncertainty (TVU)
Looking first at the TVU values, with the file selected and the time series editor dock open, we can see that the priority positioning (Which in this example is the object track source) SD Height values are pretty consistently about 9 to 10 centimeters (if this series is not available, Qimera will only have the SD in the vessel editor to go off of):
Then opening the swath editor and coloring by TVU, when you mouse over the nadir beams you find a value of about 18 cm:
Then thinking about the rough calculation that happens here just based on basic standard deviation math, you would be looking at a 95% confidence interval, so you would multiply the SD value by 1.96; this would get you to 0.176 m. You can see that this matches the reported 18cm TVU value computed by Qimera, with a small difference due to rounding.
Total Horizontal Uncertainty (THU)
Now looking at the THU. The SD of the X position of the system used as priority gives 16 cm:
Since this is in a different dimension (2-sigma rather than the 1-sigma which the SD is reported in), we would multiply by 2.45, (result= 0.392), then set this value aside (will refer to it as value A).
Now looking at the beam footprint at nadir, based on beam width and depth (avg. across/along track, convert to radians and multiply by depth), we get value B = 0.26612.
Then take the root mean squared for a result of 47 cm.
Which matches pretty closely what we see in the swath editor, colored by THU now and looking again at the nadir beams, which gives about 46 cm:
Step 4 - Troubleshooting (Optional)
If the TVU/THU values computed by Qimera are not what you expect, there are a couple troubleshooting options.
The first is of course double checking the SD values used (as described in step 1).
There is also a possibility that there are some outliers which are not indicative of the survey, but which raise the average TVU/THU values. If this is the case, you can utilize the ‘Reject Above Uncertainty Threshold’ filter, available in the Manage Filter Profiles Dialog window. More information on that filter can be found here: https://qpssoftware.scrollhelp.site/qimera/qimera-manage-filter-profiles-dialog#QimeraManageFilterProfilesDialog-RejectAboveUncertaintyThreshold and information on running filters on your data can be found here: https://qpssoftware.scrollhelp.site/qimera/how-to-filter-operations-and-filtering-profiles Once that is run, you can recreate the THU/TVU layers (see step 2), should the scalars be required.