Pipeline Visualization Classes
This family of data types involves those that deal with the visualization of Pipeline imagery data and the variety of methods that they can be visualized and represented in the 3D virtual world of Fledermaus. Refer to Pipeline Docks for reference. The class types include;
Dynamic Surface Class
Refer to Dynamic Surface Class for reference.
Video Player Class
The Video Player Class is used for video replay synchronization. The Video Player Class can be created using the Create > Video menu command. Launch Player will start a separate application in which you will see the video. The IP Address of the player is configured to your local machine by default. The Port number is configured to the SaabListening port by default. On Windows, the videos need to be located here: C:\Users\<username>\QPS-Data\Videos. The video name indicates the start time of the video: For example, "1402580763000 2014-06-12, 13-46-03.asf". Where, 1402580763000 is the Epoch time (in milliseconds), followed by the date separated by dashes, followed by a comma, followed by the time separated by dashes.

Video Player Class Attribute Panel

Video Player Application
Pipeline Events Class
The Pipeline Events Class is used for creating time/space notes for Pipeline. The Pipeline Events Class can be created using the Create > Pipeline Events menu command. The events can be exported using Export > Export Pipeline Events.

Pipeline Events Class Attribute Panel
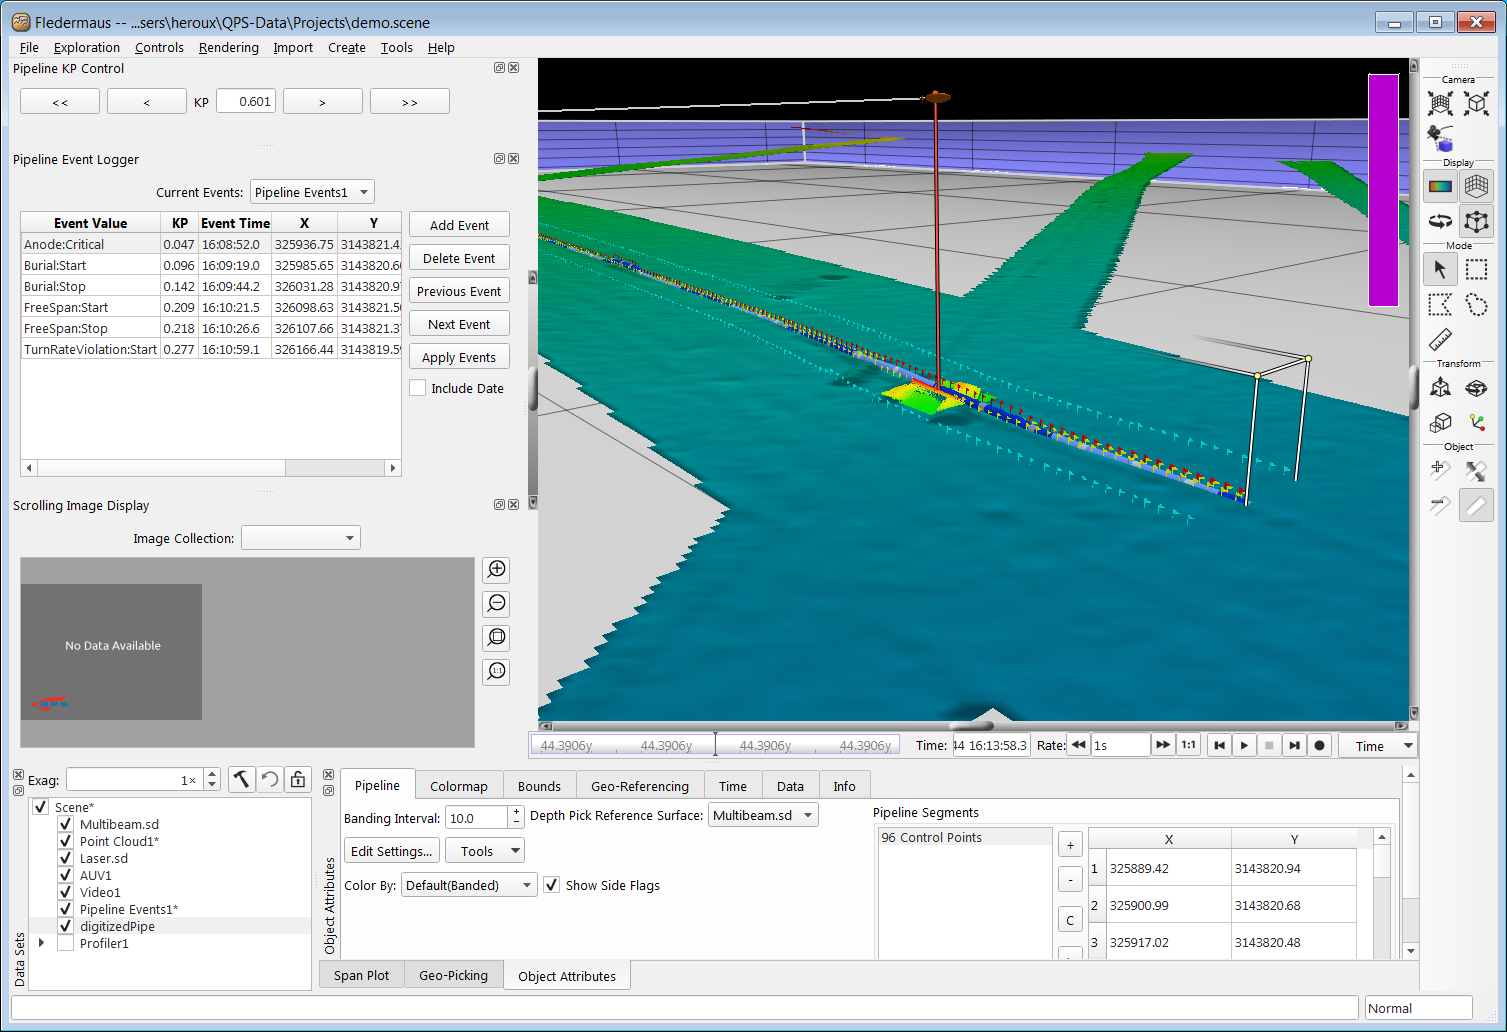
The Pipeline Event Dock displays the events contained in the Pipeline Events Class. The Current Events drop down is used to select which Events Class to display. The Add Event/Delete Event buttons are used for creating/deleting events, respectively. The Previous Event/Next Event buttons are used for selecting the previous/next event, respectively. When selecting an event, the scene locator will move to show the location of the event in the scene. Double-clicking an event will show the location of the event as well. If the camera mode is set to Follow an Object, the camera will follow. The Apply Events button is used to apply events to the pipeline and update the pipeline status so that you can color by the different status later. The Include Date toggle allows the user to hide the date display of the Event time to save space as generally the date aspect of the time is less important.

Pipeline Event Dock
When Add Event is pressed, the New Pipeline Event Dialog will popup. The KP, time, and location of the event will be automatically filled in with the distance along the Pipeline, current scene time, and location of the active pick point, respectively.
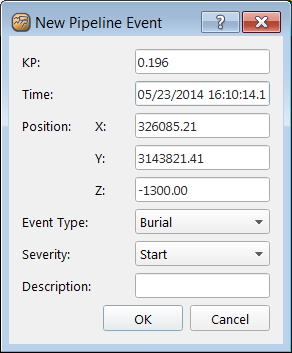
New Pipeline Event Dialog
Image Collection Class
The Image Collection class contains pointers to a set of images that are related by position and time on disk. The images must be present on the computer that uses this class. That is, if the object or scene containing this class is copied to another computer, then the images must also be copied to that computer. It is expected at this time that the images represent a sequence of images that are more or less sequential, as would be output from an AUV following a pipeline. Other uses may work, but are not supported yet.
The panel shows the location of the images on disk, which must all reside in one directory. The default render mode at this time is to display the current image. At any time, new images or modified images added to the directory may be included in the Image Collection class by clicking Reload.
The image file name indicates the timestamp of the image: For example, "20140523-160634.758-015741.jpg". Where, 20140523 is the date, followed by a dash, 160634 is the time, followed by a period, 758 is the milliseconds, followed by a dash, 015741 is the image number in the image collection.
yyyymmdd-hhmmss.milliseconds(3digits)-imagenumber(6digits)
Also, each image needs to be accompanied by a georeferenced file .jgw by the same name.
For example,
20140523-160706.529-015759.jpg
20140523-160706.529-015759.jgw

Image Collection Attribute Panel
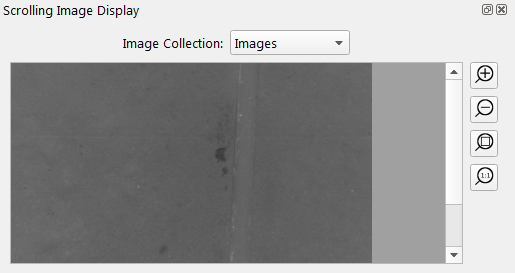
Image Collection Dock
Pipeline Class
The Pipeline Class is used for visualization of Pipeline imagery data and the variety of methods used during the pipeline inspection process. The Pipeline Class can be created using the Create > Pipeline menu command. Alternatively, import a pipeline using the Import > Pipeline menu command. The side flags can be toggled on/off using the Show Side Flags checkbox. The banding interval is used for determining the length of the alternating blue bands when the banded coloration mode is selected. The Depth Pick Reference Surface is used for determining which surface will be used for depth picking purposes. The Edit Settings button is used for editing pipeline settings. The control point table in the pipeline attribute panel displays X, Y, and KP. The KP Points can be toggled on/off using the Show KP Points checkbox.

Pipeline Attribute Panel
Pipeline Class 3D Visualization
Pipeline Settings Dialog
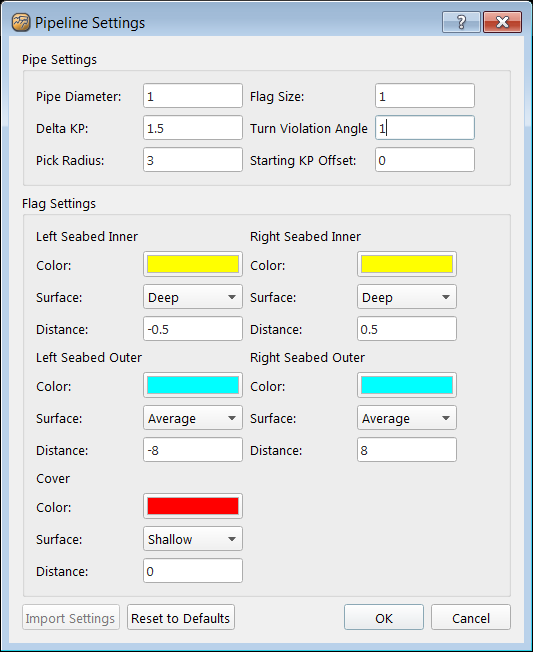
When the Edit Settings button is pressed, the Pipeline Settings Dialog will popup. The Pipeline Settings Dialog allows editing the Pipe Diameter, Flag Size, Delta KP, and Turn Violation Angle, Pick Radius, and Starting KP Offset. The Pick Radius is measured in cells. When adding a new picked point to the route the Pick Radius is used to select the shoalest sounding of the Dynamic Surface within that area. The Starting KP Offset is used during Pipe Recalibration and allows the user to change the Pipeline starting KP and have the remaining KP's adjust accordingly. Furthermore, for each side flag, the dialog allows editing the color, surface, and distance.
Pipeline Settings Dialog
Pipeline Import
When importing a pipeline, the Pipeline Reference Surface Dialog will popup. This is the surface that will be used for depth picking purposes.
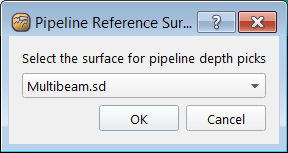
Pipeline Reference Surface Dialog
Pipeline Color By Option
The Color By option allows the pipeline to be colored by Burial Status, Freespan Status, Turn Violations, Selected Segment, or simply banded (default).
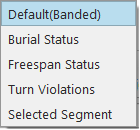
Color By Dropdown Menu
Pipeline Tools
Create Pipeline Profile using Tools > Create Profile. Begin process to review algorithmic events using Tools > Review Violations. Export 5 point Profile using Tools > 5-pt Profile. Export Along-Track Profile using Tools > Along-Track Profile. The Move Shoalest options moves the pipeline to the shoalest point on the surface given a radius.
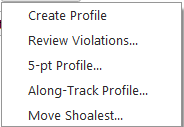
Tools Dropdown Menu
When Review Violations is pressed, the Review Violation Dialog will popup. The Review Violation dialog is used for applying algorithmic events to an events object. The Approve button is used to set approved flag. The Clear button is used to clear approved flag. The Select All button will select all events in the list. The Previous Event/Next Event buttons are used for selecting the previous/next event, respectively. When selecting an event, the scene locator will move to show the location of the event in the scene. Double-clicking an event will show the location of the event as well. If the camera mode is set to Follow an Object, the camera will follow. The Apply Events button will copy all approved events to the Events object selected in the Event Object dropdown.
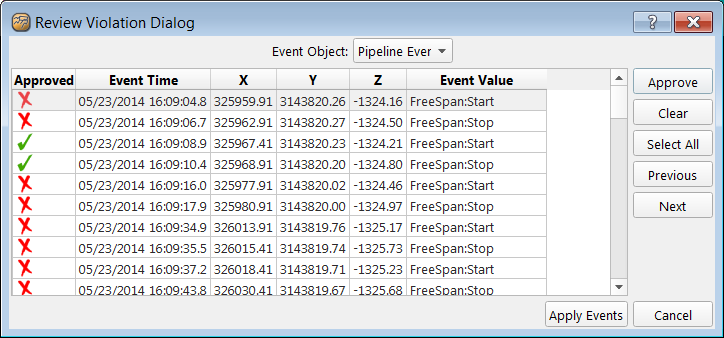
Review Violation Dialog
When Move Shoalest is pressed, the Move Shoalest Dialog will popup. The Pick Radius is measured in cells. The Pick Radius is used to move the pipeline to the shoalest sounding of the Dynamic Surface within that area.

Move Shoalest Dialog
The Move Shoalest operation cannot be undone.

Move Shoalest Warning Dialog
Vessel Track Class
The Vessel Track Class is used to create a Vessel that includes navigation. The Vessel Track Class can be created using the Import > Vessel Track menu command.

Vessel Track Attribute Panel
When importing a Vessel Track, the Import Vessel Dialog will popup. Specify the navigation file. The navigation file can either be a single ASCII file or one or more QPDs. If QPDs are chosen, select the vessel name from the drop down. The import vessel function will import the center of gravity line from the QPDs. Specify the model file. Make this vessel the active pick point object is checked by default.

Import Vessel Dialog
Dynamic Points Class
The Dynamic Points Class is used to visualize point data from the Dynamic Surface Class. The Dynamic Points Class can be created using the Tools > Create Point Cloud menu from the tools menu for the Dynamic Surface from which you want to display point data. The Height and Width specify the dimensions of the point cloud. To load point data, simply go into select mode(s) and pick anywhere on the Dynamic Surface. If the scene contains a Vessel Track Class, then point data will be automatically loaded.

Dynamic Points Attribute Panel
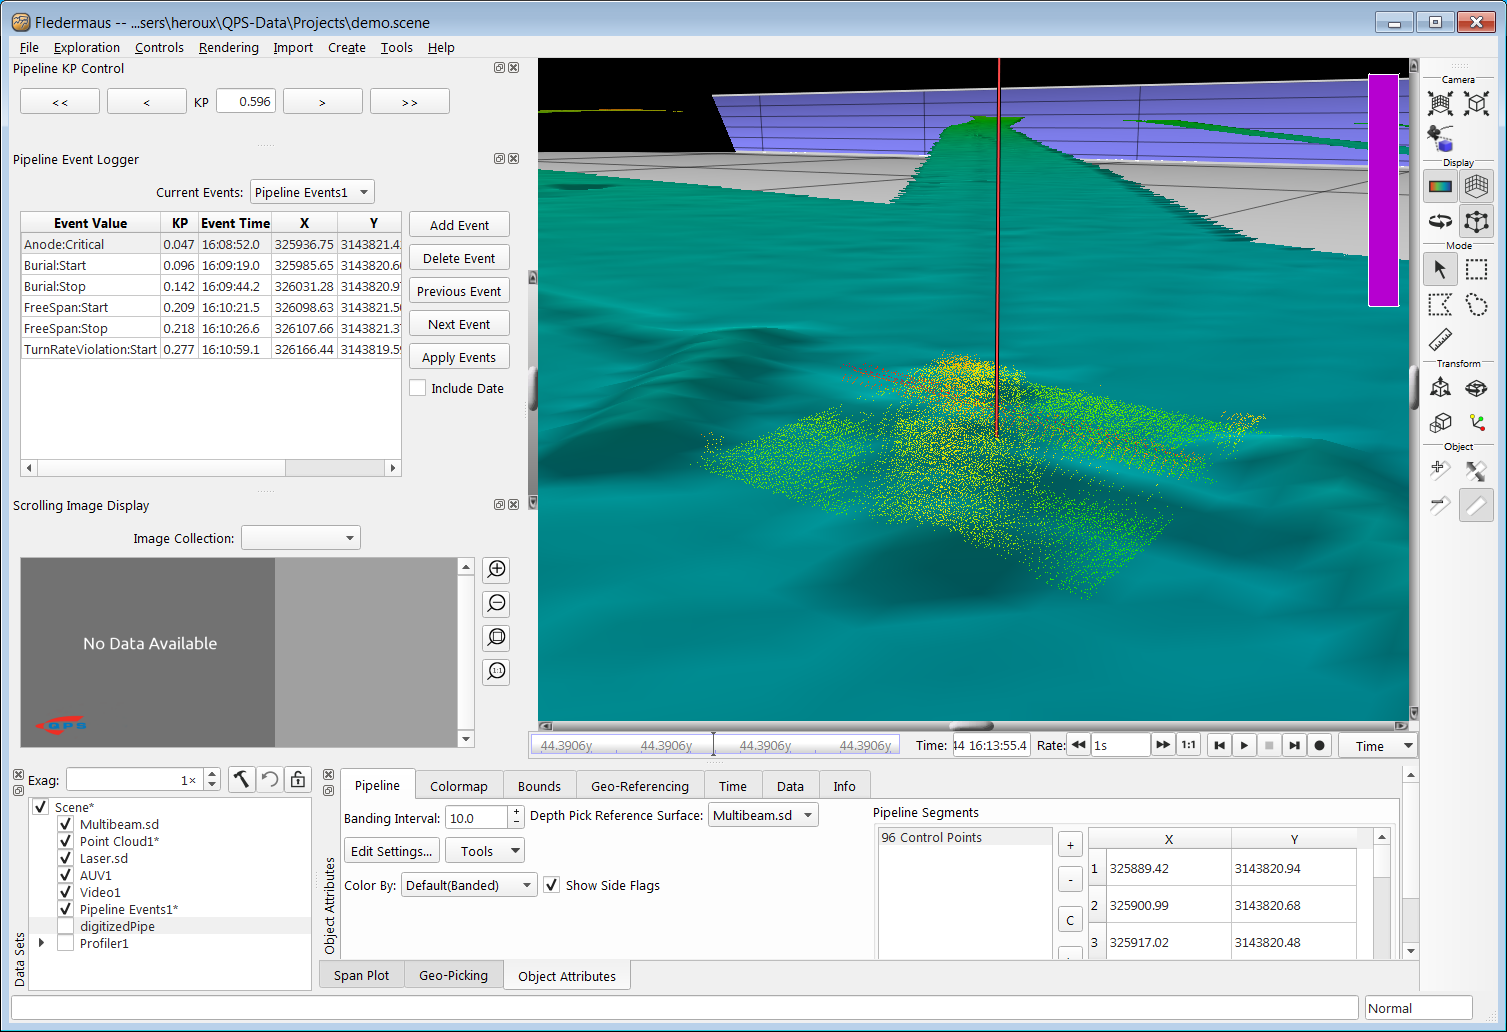
Dynamic Points Class 3D Visualization
Return to: Reference Manual
