Dynamic Surface Class
The following section describes the capabilities of viewing and editing Dynamic Surface files within Fledermaus. More information about general DTM options can be found at Digital Terrain Model (DTM) Classes.

The Dynamic Surface object shares most of the same controls as the Sonar DTM. The Dynamic Surface will not always load the surface as full resolution but rather at the resolution best determined by the graphics engine. This allows for very large surfaces to be loaded. The Dynamic Surface maintains a link to the qpd sounding files used to generate the Surface. The soundings from individual qpd files can be edited in the 3DEditor, from the Sounding Selection tools in the Filter panel, or from the CUBE Filtering option if a CUBE surface is included. When edits are made to the soundings, the Dynamic Surface will update to reflect those changes.
The Surface display option allows for the selection of what surface from a Dynamic Surface to display, Shallow, Average, Deep, and CUBE (if CUBE surface included). The Color By option allows the surface to be colored by Height, Standard Deviation, Sounding Density, Checked Flat, Plotted Flag, Feature Flag, and suspect Flag. The Highlight By options will highlight the surface for Checked, Suspect, Plotted, or Feature flags (highlighted areas will appear lighter than the surrounding areas). The Use Pre-Computed Illumination check box allow you to change the shading mode of the Dynamic Surface. The major difference is how the shadows are represented. When the checked off, the shadows are show through a standard hill shading algorithm. This is all done by the video hardware and requires no additional processing. When checked the surface will show Fledermaus cast shadows using the Fledermaus shading engine. While superior to hill shading, there is additional processing required to generate the additional illumination parameters.
DTM Tools Menu
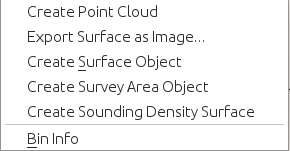
Tools Menu
The Tools Menu offers six options. Use Create Point Clout to create a dynamic point cloud from the data underlying the dynamic surface. Use Export Surface as Image... to export the surface data as either a GeoTIFF or a JPEG image with World file. Use Create Surface Object to create a SonarDTM surface from the dynamic surface. Use Create Survey Area Object create an outline of the survey area. Use Create Sounding Density Surface to create a sounding density surface. The Bin Info option opens a dialog to display information about the surface under the current cursor position. Move the cursor over the surface in the Explore mode and the fields will display the data for the bin closest to the cursor position.The dialog may be blank if the cursor is not over any dynamic surface objects in the scene.
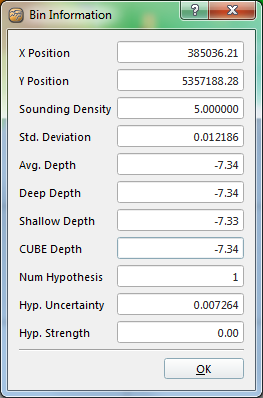
Bin Information Dialog Box
Edit Tools
Launch 3D Editor – runs the Fledermaus 3D Editor on the selected area. Also can be started by pressing the '3' key. See Section 3DEditor for a full description.
The Check button allows the users to set areas that have already been processed and approved. This can then be shown on the visualized surface. The Check button sets all bins in an area as checked and the Uncheck button undoes this process.
Grid Header -- Displays summary information about the Dynamic Surface.
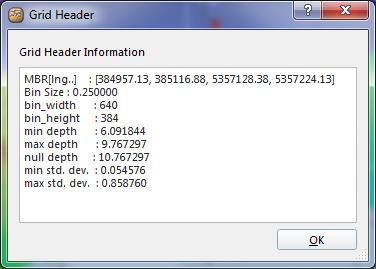
Grid Header Dialog Box
The Tools menu button has the following options:
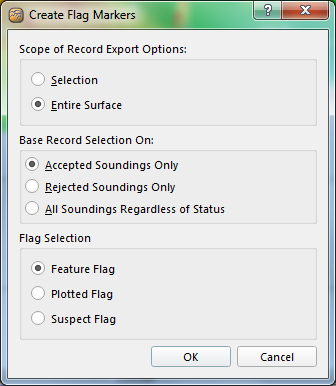
Create Flag Markers - This operation creates a Fledermaus SD point object of soundings. This object contains soundings marked with the Feature Flag, Plotted Flag, or the Suspect Flag, based of the selected criterion. If you have selected a rectangular area in the main window, the Selection option will only add soundings that fall within the selected area. You can further restrict the selection criteria based on the Accepted, Rejected, or all soundings.
Export Soundings – This operation exports soundings from the selected surface to an ASCII file. This option can be used to export soundings from the files used to makeup that surface. If you have selected a rectangular area in the main view you can limit the export to that region by setting the Scope of Record Export to Selection instead of the Entire Surface. You can then choose whether you want to export Accept Soundings, Rejected Soundings, or all soundings. You can then optionally refine you export based on sounding flags including those selected for Plotting, Feature, or those with a suspect flag set via other processing operations. If the 'Export as Geographic (Lat/Lon)' toggle is set the soundings will be converted to geographic coordinates before they are output.
You can choose from three ascii export options via the output format pulldown menu. Just x, y, z coordinates, the xyz coordinates + additional attributes which you can configure, or NAVO/Caris which is a legacy export format support in Fledermaus PFM processing. When choosing to export Horizontal or Vertical Errors as additional Attributes, these will be represented as a 95% Confidence Interval value.
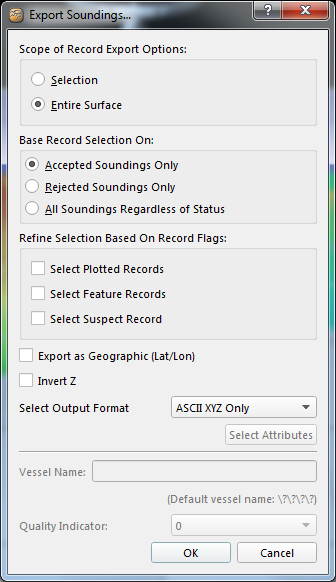
Export Soundings Dialog
Export Shoal Soundings – This option lets you export the shoal soundings from the files used to create the selected dynamic surface.This dialog will output a text file that contains a set of XYZ points representing the shoalest sounding in each cell of the selected area. If you have selected a rectangular area in the main view you can limit the export to that region by setting the Scope of Record Export to Selection instead of the Entire Surface. If the 'Export as Geographic (Lat/Lon)' toggle is set the soundings will be converted to geographic coordinates before they are output. The output format can be specified with the Select Output Format drop-down list and can either be Ascii XYZ Only, Ascii XYZ + Attributes, or NAVO/CarisAscii. . When choosing to export Horizontal or Vertical Errors as additional Attributes, these will be represented as a 95% Confidence Interval value.
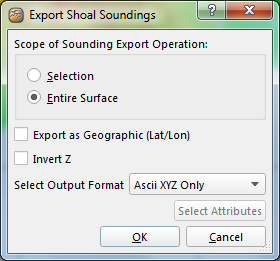
Export Shoal Soundings Dialog
Cube – contains a submenu with a number of options for working the CUBE Dynamice Surface.
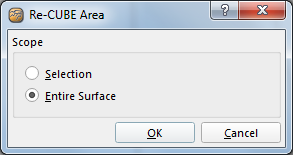
Re-CUBE Area - This dialog lets you re-run the CUBE algorithm on a dynamic surface.
You can re-run the CUBE algorithm on a dynamic surface for either the selected area from the main window or on the entire surface. It will utilize the current CUBE parameters which have been set by the user. If you do this any selected hypothesis in the given area will be reset based on the results of the algorithm for the selected area of interest. Normally this is used if one run a sounding filtering algorithm first then want to utilize CUBE on the now reduced(more clean) set of soundings that remain un-rejected.
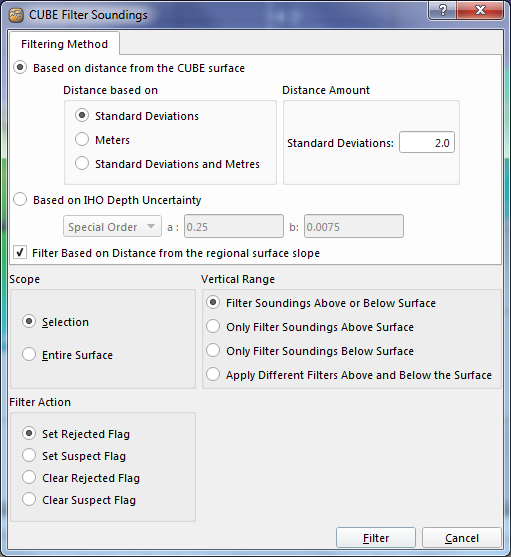
Filter Soundings - The CUBE Filter Soundings dialog lets you reject soundings based on the current CUBE surface. Soundings that are far enough away from the surface based on selected criteria can be marked as rejected. If you have a good CUBE surface this can help eliminate a lot of noisy data in the selected dynamic surface. The Filtering Method lets you setup this selection criterion. The distance can be based sounding distance from the CUBE surface via several methods including Standard Deviations of the data in a cell, in Meters, or by a combination of both (if either passes then the sounding will be rejected). A second option lets you filter based on the computed IHO Depth Uncertainty whereby the expected maximum uncertainty of a sounding is computed based on the parameters provided and if the soundings uncertainty is larger then that it is a candidate to be rejected. By default these selection criteria are based on a flat surface cell. However if you check the Filter Based on Distance from the regional surface slope then the system will lets at the slope of the soundings in a given cell and compute the distance away from the direction of the slope. The calculation is more intensive then the flat surface assumption but generally yields superior results.
You can choose to Apply this filter to only soundings above the surface, only below the surface, both above and below, or select different criteria for above and below. If one chooses different criteria for above and below the CUBE surface you will get two tabs for entering the filtering parameters, one for each.
By default the action is to mark soundings as rejected that are selected by the filter however you can reverse the nature of the filter by telling the algorithm to Clear the rejected flag as well. Sometimes this is useful to run the algorithm on an area, if you over filter then change it to clear the rejected flag and run it again to reverse your filter and try again with new parameters. Note however that clearing the rejection flag could bring back soundings which have been previously rejected by other operations. As well as setting or clearing rejected flag, soundings can be marked as suspect or suspect flags cleared.
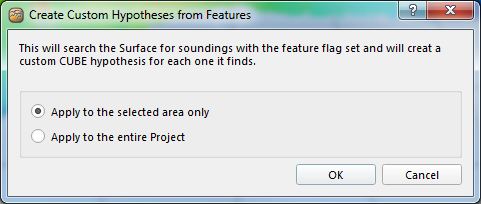
Create Hypothesis from Features - This dialog lets you create custom CUBE hypothesis at the height of each soundings in a cell that has the feature flag set. You can select if you want to apply it to the entire project or only the selected area.
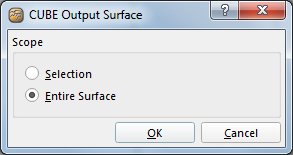
Output Surface - This option creates a text output file of the CUBE grid with X, Y, CUBE estimated depth and the CUBE uncertainty. Note that CUBE uncertainty is different than the standard deviation layer. The CUBE uncertainty is the standard deviation of the samples that contributed to the selected hypothesis. The standard deviation reflects the spread of all soundings that would have contributed to the CUBE analysis, regardless of which hypothesis they contribute to.
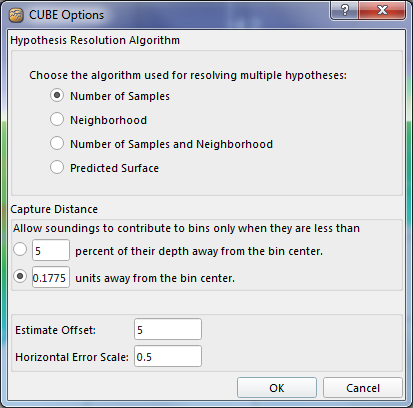
CUBE Options - This dialog provides editing of key CUBE processing parameters.
When running the CUBE algorithm, sometimes multiple hypotheses are generated. The algorithm must make a best guess on which hypothesis is correct using a Hypothesis Resolution Algorithm. The following algorithms are supported:
- Num. Samples – The hypothesis containing the most soundings will be chosen.
- Neighborhood – The algorithm searches all the neighbors of the cell looking for a cell with only one hypothesis. If a cell is found with one hypothesis, this cell is used as a guide in choosing a hypothesis; otherwise the Num. Samples algorithm is used.
- Num. Samples + Neighborhood – A combination of the two previous algorithms.
- Predicted Surface – The algorithm computes the median surface of the input soundings as uses that surface as a guide in choosing the hypothesis.
Internally, the CUBE algorithm has no concept of cells. A sounding may contribute to many different hypotheses depending on how far away the sounding is away from the hypothesis center in the XY plane. The Capture Distance option controls how far the sounding can be to contribute to a hypothesis and the algorithm assumes that deeper soundings will be less accurate. If the distance from the hypothesis center to the sounding is less than the sounding height multiplied by the Capture Distance percentage, the sounding will be included in the hypothesis. Smaller Capture Distance values result in less soundings contributing to a hypothesis and larger values result in more soundings contributing to a hypothesis. If the Capture Distance is too small, holes may appear in the data. In some cases, this Capture Distance does not make sense so to turn the algorithm off, enter 100 as the Capture Distance value.
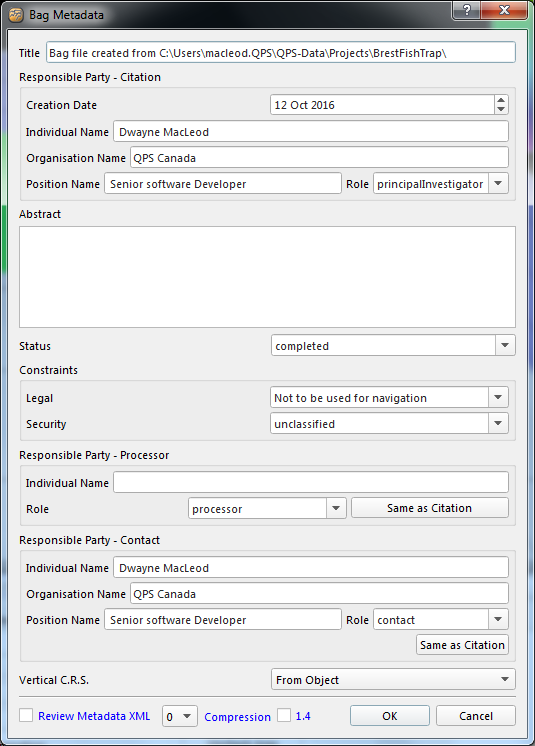
Export Bag Surface - This dialog is used to export a bag surface from a selected surface. This option allows the current selected Dynamic Surface to be exported to a bag surface. This dialog simply gathers all the metadata information that can be stored with a bag surface. The uncertainty layer will come from the CUBE surface.
The ArcGIS menu button
This Button is only available when using the Windows 32 bit version of Fledermaus. Please refer toFledermaus and GIS for more information about these options.
Filters Panel
The Filters Panel allows filters to be run on the current Dynamic Surface. All operations in this panel depend on the setting of the Scope pull down menu. The different options for the scope are as follows:
- Selection – area selected by dragging with the mouse in Select mode;
- Entire Surface – all soundings in the Dynamic Surface.

Figure 148 - Filters Panel
Three types of operations exist in the Filters panel: Select, Clear, and Export. Each operation can be run on the Suspect, Plotted, or Feature flags and the buttons for each flag are located to the right of the flag label. The Select button will run a filter on all soundings in the selection scope to automatically set flags of a certain type. The Clear button will remove the given flag from all soundings in the given selection scope. To save all soundings in the selection scope that have a certain flag, click the Export button.
Selecting Suspect Soundings
The suspect soundings selection filter assists the user in identifying soundings that may be incorrect. Clicking the Select button beside the Suspect Soundings label will display the Suspect Filter Options dialog. The filter will select all soundings with depths that are more than a certain threshold away from the average depth in a bin. Enter a threshold in the Depth Threshold Difference text field and click the Filter button.
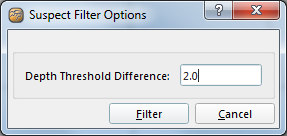
Filter Options for Suspect Soundings
Bins that contain suspect soundings can be shown by setting the Color popup menu to Suspect or the Flags menu to Suspect on the Surface Control panel.
Selecting Plotted Soundings
Automatically selecting soundings for plotting can be accomplished through the Select button to the right of the Plotted Soundings label. This operation is used to run a sounding selection algorithm and will display the dialog box as shown in Figure 150. Normally the chart scale is specified to determine the default distance between selected soundings that are entered in the Chart Scale text field. For example a value of 20000 implies a chart scale of 1:20000. This gives the default minimum distance between soundings and is based on assuming 5mm text for the resulting chart. You can directly enter the minimum distance, overriding the suggested default for the given chart scale, by typing a new value in the Minimum Distance text field. The Selection Factor that defaults to two is used in algorithm and generally should be left alone. A smaller number improves the quality of the selection but increases running time (the default has been found to be a good balance). The Parameter Status field shows the criterion for running the algorithm. You cannot select soundings if you select an unreasonable chart scale for the bin size of the Dynamic Surface. The dialog box will display a message just below the parameter status to indicate if the selected parameters are acceptable or not. If they are not you must increase the chart scale (or minimum distance).
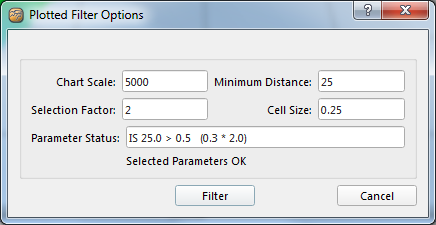
Filter Options for the Plotted Soundings Algorithm
If advanced filters are to be used with the selection algorithm, enable the Use Filter Parameters toggle. Before being selected by the filter, the sounding must pass three criteria: it must be in a bin with more than a certain number of soundings, its height must be far enough away from the average bin height, and the standard deviation of the sounding must be above a certain level. Enter values in the Minimum Beams, Difference from Average Surface (0.25 = 25%), and Standard Deviations for accept text fields respectively to control these options. If Use Filter Parameters is off, the bottom three text fields are ignored. Click the Filter button to run the filter on the selection scope.
Setting the Color popup menu to Plotted or the Flags menu to Plotted on the Surface Control panel will display which bins contain the plotted flag.
Selecting Feature Soundings
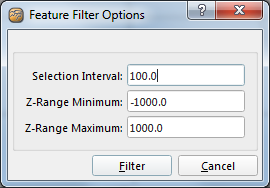
Filter Options for Feature Soundings
Selecting feature soundings is performed by clicking the Select button to the right of the Feature Soundings label. This will display the dialog as shown above. Specify the minimum distance apart of shoals in the horizontal plane (Selection Interval), and specify the depth range for consideration in the Z Range Minimum and Z Range Maximum text fields. Click the Filter button to begin the algorithm.
The actual algorithm is a two-step process. In the first step, the process searches through all the data based on the defined cell size and finds the shallowest sounding that is not flagged as deleted and is within the selected depth range. In addition, the entry of the minimum and maximum values allows the user to restrict the process to only those soundings within the selected depth range. The second step prunes the list of selected shoal soundings based on the range interval entered. In this step, the selected soundings are first sorted in descending order. The shallowest is selected and then any sounding that lies within the entered range is deleted. The next shallowest sounding is selected and any soundings that lie within the entered range to it are deleted.
Soundings with the feature flag set can be shown by setting the Color popup menu to Feature; or the Flags menu to Feature on the Surface Control panel. Also, a list of feature soundings can be shown by clicking the Table button to the right of the Feature Soundings label.
Feature Soundings Table
The Feature Soundings Table is used for both the displaying and working with the data records that have been flagged as features. The selected sounding in the table will be highlighted and will also be highlighted by a red stalk in the Fledermaus window. If further details of the data point are required, the details can be examined in the same manner to the 3D Editor table. On completion the table can be saved as an ASCII file for use elsewhere by right clicking on the table and selecting Save able As.
If saving a Dynamic Surface as part of a scene, it suggested that the scene file be saved in the Project Folder of the Dynamic Surface. Dynamic Surfaces depend on an associated .GRD file, so a .sd file and a .scene file need to always know where the .GRD file is. Usually, there is a hard coded link as part of the .sd or .scene, but if scene file is moved to another computer that link can be broken. Saving the .scene file in the project folder will assure the .scene file will know where the .GRD file is. If multiple Dynamic Surfaces are part of one scene, then all the Dynamic Surfaces should be part of the same Project Folder. For .sd files, they always exist in the same directory as the .GRD so they always know where the .GRD file is located.
Return to: Reference Manual
