
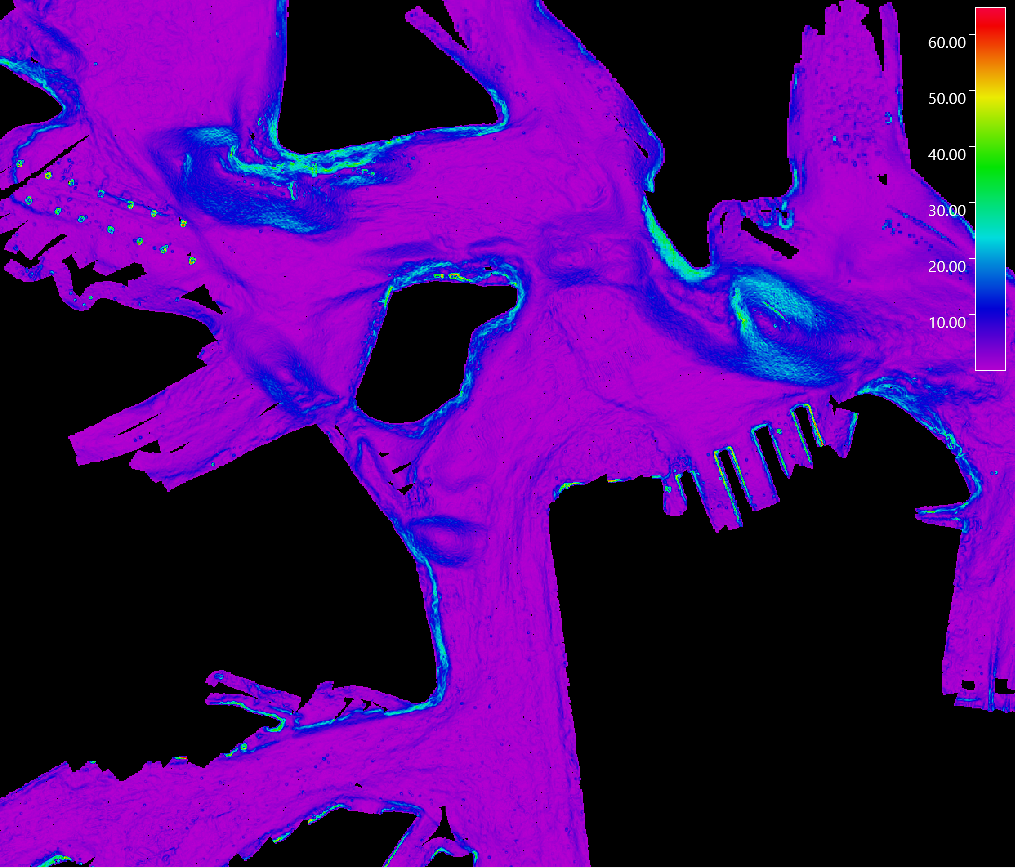
Sample slope scalar produced from Sydney Harbour, Australia bathymetry data. Color is slope in degrees.
Introduction
The Scalar object type is used to represent any particular value that is sampled on a uniform grid. i.e. scalar = f(x, y) where x and y are sampled on a uniform grid. Typical it is used for items like Slope, Rugosity, Pressure, Temperature, Classification, Geologic classes, etc. Often this scalars are combined with surface to shade a surface based on the scalar value. The visualization of the scalar object is done on a plane in the x/y space at a specified height (z value). The color of each cell is based on mapping the scalar value through a color map to select the color used in the visualization of that cell. Like the surface the scalar is also dynamically streamed off disk as its size grows and more higher resolution data will be pulled in as needed when you zoom in or move around the data space.
Storage Format
Fledermaus scalar objects are stores in files with the .scalar extension.
Properties
|
Name |
Description |
|---|---|
|
Column Count |
Number of columns in the scalar array. |
|
Row Count |
Number of rows in the scalar array. |
|
Cell Size |
The base resolution of each cell in the scalar array. |
|
Scalar Minimum |
The minimum scalar value (minimum slope in the example above) |
|
Scalar Maximum |
The maximum scalar value (maximum slope in the example above) |
Attributes
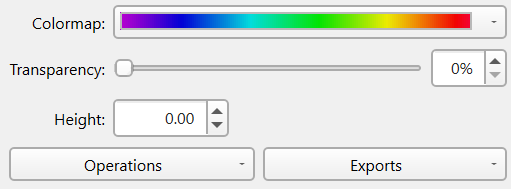
The ColorMap widget provides the standard color map tool including the ability to select a color map, edit the color map, and control how the scalar values are mapped to color map values.
The Transparency control how transparent the rendering of the scalar surface is and how much data behind the scalar may blend with the scalar colors.
Finally the Height control specifies that height (Z-value) for the plane that the scalar is rendered onto.
Operations
To see the operations available for the scalar object type right click the object's name and look in the Operations sub-menu or look at the Operations dropdown menu at the bottom left of the attribute panel. These operations include:
Change Object Coordinate System...
While this should be very rarely needed it can be used if necessary to change the coordinate system currently applied to the object. No projection is done here you are just telling it that this new coordinate system is what the object should have been in in the first place.
Reproject Object...
Generally there are better ways to handle (re)projection work but if you really just want to convert this scalar into a new projection this will work. The Reproject Object option will produce a new scalar by transforming the existing one into the new projection you have chosen then adds the result to the current scene.
Reproject Object To Scene...
If an object is current marked as Undisplayable in the Scene control dock this is normally because it is in a different projection than the scene is. As scalars don't dynamically auto-project if you want to see this object in the current scene's CRS than one can use this option. It will result in a new surface being produced that can be displayed in the current Scene.
Statistics
This option computes a number of statistics based on the information contained within the scalar object and presents the results. Click here for details.
Interpolate
Does a basic interpolation of the scalar which can be used to fill in small holes based on the neighboring cell scalar values. When cells are filled by interpolation they are flagged as such so they can be differentiated from real cell data for certain other operations. Click here for details.
Extract
Use this operation to extract a sub-area from the selected scalar to make a new surface with the given area. The area can be specified directly by coordinates or it can use selections that have been made on the scalar. Click here for details.
Merge
The merge tool is a data fusion tool which allows one to merge multiple selected scalars into a single new scalar object with a specified resolution and various option for how to merge overlapping cells from multiple surfaces. This is a very handy tool if one needs to deliver a single final surface built from separate individual ones. Click here for details.
Exports
Export to ArcGIS...
Assuming you have the ESRI GIS Engine setup this tool lets you push data into ESRI geodata sets. The tool is described in detail here.
Export to Google Earth KML...
Exports the surface to a Google Earth KML file which can be easily loaded into Google Earth. Click here for details.
Export to Image...
This exports the colored scalar data to various imagery formats. Click here for details.
Export to XYZ...
This options supports exporting the data to an x, y, z, scalar ascii file.
Export to Floating Point TIFF Grid...
This exports the scalar data to a floating point TIFF. This can be used to load the data as values in other software or Fledermaus.
Return to Fledermaus Visual Objects
Return to Fledermaus Reference Manual