
Introduction
The Fledermaus line object type is used to represent information that has been broken down into 2D and 3D lines. Lines objects are poly-lines and can consist of any number of line segments. Polygons can also be represented as line objects by making closed poly lines. Thus lines, poly-lines and polygons can all be represented by this object type. For each continuous line segment, the object stores an index and the points that define the line. The indices are used to select a particular line for certain operations and are visible in the Data Viewing Panel.
Common line and shape files like ArcView .shp or Ascii files could be easily be imported into Fledermaus through the Import > Import Lines ... menu option.
Storage Format
Fledermaus lines object are stored in files with the .lines extensions.
Properties
In addition to the standard object properties and bounds, lines objects have a couple additional properties:
|
Property Name |
Description |
|---|---|
|
Polyline Count |
The number of continuous line segments contained in the object. Each line segment has its own index. |
|
Total Point Count |
The number of points stored by the lines object as a sum of the number of points in each line segment. |
Attributes
Color By
Solid Color
The color of the lines in the scene. This applies to all lines in the object.
Z
Color the lines by Z. The color of the lines will be shaded by the colormap selected according to the height of the line at its vertices.
Attributes
Color the lines by the selected attribute. When lines are imported, it is possible to select columns as attributes. Those columns may be used to color the lines according to the colormap selected.
Offset
Offsets the Z position of all lines by the set amount. Note that this is only a visual offset; it does not affect the underlying data and will not change the results of operations.
Draped
Used to toggle between the original and draped Z coordinates. This only applies after using either the Drape operation or the Drape and Resample operation to generate draped Z coordinates for the line.
Data Viewing Panel
A column to add a color for each line may be added to lines object in the Data Viewing Panel. Refer to documentation there for details.
Operations
Change Object Coordinate System...
Allows you to manually set the coordinate system of the object. This should only be used if the object somehow ended up with the wrong coordinate system for its data. No re-projection is done, you are just telling it that this new coordinate system is what the object should have been in in the first place.
Reproject Object...
Converts the lines into a new coordinate system. This is usually not needed since lines objects are able to automatically re-project themselves to the scene coordinate system. If a lines object is automatically re-projecting itself, you will see "(Auto-projected)" at the end of the object name in the Scene Tree View.
Reproject Object To Scene...
Re-projects the lines into the scene coordinate system. This is rarely needed since lines objects are able to do this automatically. If a lines object is automatically re-projecting itself, you will see "(Auto-projected)" at the end of the object name in the Scene Tree View.
Set All Vertices to a Single Height...
Sets the Z coordinate of every point in every line to the same value. When clicked, a dialog box will open to ask you what Z value to set the points to. After choosing a value and clicking OK, you will be asked if you want to preserve the current Z values.
Drape
Drapes the lines on the surface immediately below by setting the Z coordinate of each point to the height of the topmost surface under that point. The lines themselves will not rest on the surface, only the control points.
The draped Z coordinates are stored separately from the original Z values so they can be toggled on and off using the Draped check box in the attributes panel.
Resample and Drape
Similar to Drape except that the lines are resampled between the control points so that the line rests on the surface for its full length rather than just at the corners.
The draped Z coordinates are stored separately from the original Z values so they can be toggled on and off using the Draped check box in the attributes panel.
The Resample and Drape dialog, illustrated, has a field to enter the sampling interval and a checkbox to crop the lines to visible or selected grids only. When not checked, the dialog has the traditional behavior of Fledermaus to drape the lines between grids (surfaces) on the base plate. When checked, the lines will be cropped between grids. The last choice will be remembered.
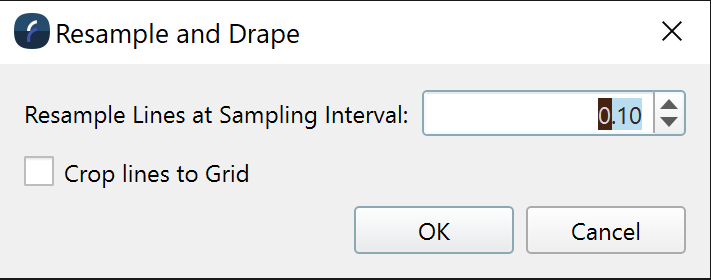
Resample and Drape DIalog
Create Profiler...
Uses one or more of the line segments to make profiler objects. When clicked, a dialog will open where you can choose to make a profiler for each line segment or pick one line segment by index to make a profiler from. You can also choose to use the name of the lines object as the name of the profiler, otherwise the default name "Profiler" will be used.
If you are creating more than one profiler, instead of being asked to save each profiler file you will be asked for a folder in which all the profiler files will be created. If you choose a folder with profiler files sharing the same name as the ones you are generating, those files will not be overwritten.
Create Pipe From Lines...
Uses a line object in a scene to create a Dynamic Pipe object. When a line object is selected and the operations button is clicked an option to Create Pipe From Lines... appears and converts the .lines file to a .dynamicpipe file. The .dynamicpipe is then added to the scene.
Use as Reference Profile
This operation allows you to use line data in the Profile Dock to compare the line with the surfaces in the scene. When clicked, this operation opens the Profile Dock and generates a graph of height data for all surfaces and the line object it was used on. However, it only samples surfaces at the control points of the line. This means you will only get data points in the graph where there are data points in the line, the rest of the graph is a linear interpolation. This operation does not work well with lines that have only a few control points, rather it is meant to be used with profile data gathered outside Fledermaus imported as a lines object. Since Fledermaus profiles are automatically updated according to the surfaces in the scene, a line object is the only way to keep static profile data in a scene. This operation lets you use those line objects to compare the static profile data with surfaces in Fledermaus.
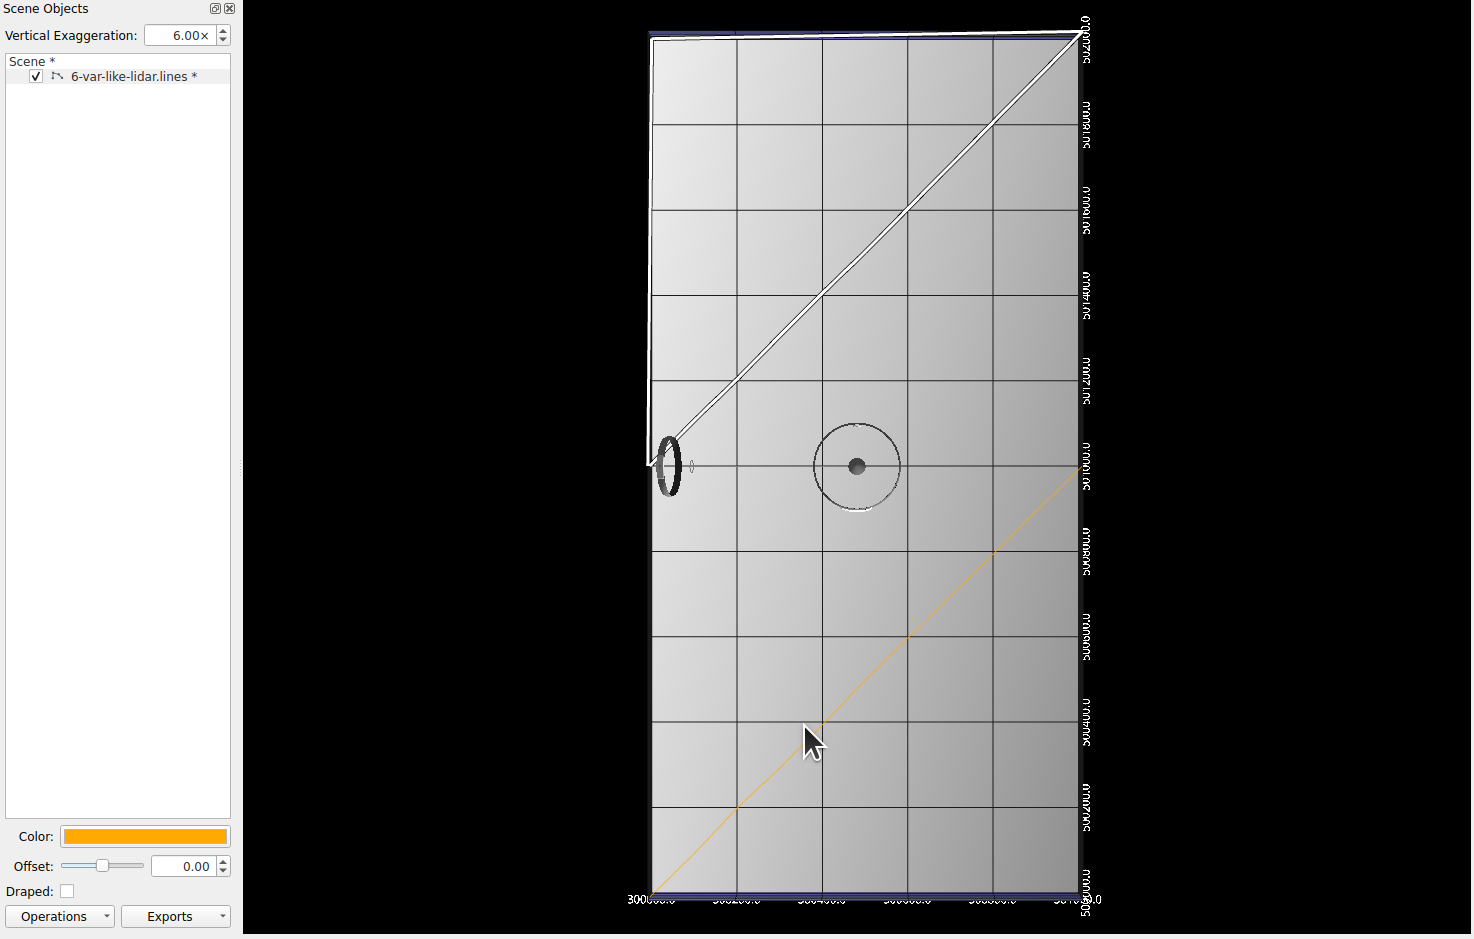
Create Selection
Creates a selected area based on one of the line segments. When clicked you will be asked to choose which line to use by inputting an index number. After creating the selection you can use the selection tools to edit the selection if need be.
Example of a selected line. There are two lines in the scene. The upper, triangular shaped line is selected and is shown in selected mode. The lower, slanted line is in orange. Both lines are orange, as can be seen in the line properties panel in the lower left, however the selected line shows the selection mode marking.
Calculate KP Values
This is the same Calculate KP Values operation found in the Data Viewing Panel for lines objects. For convenience, it is available in the operations menu. The same procedures and restrictions listed there apply here, also.
Exports
Export to ArcGIS...
Allows export of a lines object to an ArcGIS line, polygon or contour.
Export to Google Earth KML...
Allows export of a lines object to a *.kml file.
Export to 3D PDF...
Allows export of a lines object to a PDF file with an embedded 3D model of the object.
Export to XYZ file...
Allows export of a lines object to a simple *.xyz text file containing the coordinates of the control points for each line. Line segments are separated by a sentinel value of 9999.
Export to XYZ+Attributes file...
Allows export of a lines object, including any loaded attributes, to a *.xyz text file similarly to an XYZ file, except with the extra attributes written out along with the XYZ data. Only attributes that were included in the import dialog will be written out.
Export to CAD (Qgf/Dwg) file...
Brings up a dialog that allows export of a line object to various CAD formats including AutoCAD's DWG and DXF formats along with QPS vector formats including .qgfline, .qgback, .qgfarea, .qgfanno, and .qgfdes.
Return to Fledermaus Visual Objects
Return to Fledermaus Reference Manual