
Data Viewing Panel Dock
Data Viewing Panel Dock
The Data Viewing Panel dock is designed as a supplementary display to the main 3D display to show detailed information about any object types data that it supports. This currently includes:
-
PointCloud Objects → The x, y, z and other attributes of the points are displayed in spreadsheet form.
-
Profile Objects → The control points of the profile are shown and can be edited to give specific values.
-
Pipeline Objects → The control points of the pipeline are shown.
-
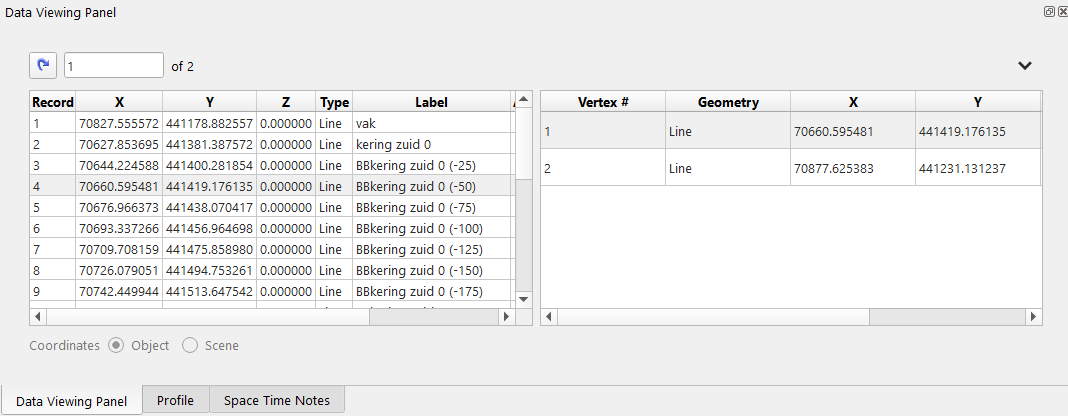
CAD Objects → A split view shows the list of CAD entities and types on the left, and the right portion displays the details of the selected entity - for example the vertices that make up a selected line entity.
-
Lines3D Objects → A split view shows the lines and properties, and the right side shows the individual 3D points that make up each polyline.
-
VesselTrackLine Objects → The trackline points are shown as a spreadsheet like view in the data viewing panel.
Different object types may have additional controls and options in the panels drop down menu at the top righthand corner.
The jump box just above the left of the main panel will jump to the entry specified on the right-most panel. That is, if there is a subtable, the jump box will jump to the specified entry in the subtable. If no subtable is present, then the jump box will jump to the specified entry in the main table.
Overview
Jump Box
Jump Box
The jump box will jump to the numbered entry on the right-most table in the Data Viewing Panel. That is, if a subtable is present, the jump box will reference the subtable. Otherwise, the main table if there is no subtable present. The jump box has been simplified, requiring only that the entry number be entered and the Enter or Return key pressed to jump to the record. The Jump to Record button can also be clicked to jump to a record, useful if using the mouse.
More Actions
The More Actions drop down menu on the far top right provides options to interact with the tables.
Save Table as CSV...
Save the contents of the right-most table to a CSV table. When a subtable is open, the subtable will be saved, otherwise the main table. Present for all types of data.
Add Selection as Line
For line objects, if a user has a selection in the main3D scene this will add the selection values as a new line to the current object. Valid for line objects only.
Add Color Column
A column to specify the color for each line in a lines object can be added to the main table by selecting this option. The default color of white will be used for each line initially. Double click on the color swatch to pick a color from the palette. The specified line will be rendered in the chosen color. Valid for line objects only.
Example of lines with orange and blue colors:
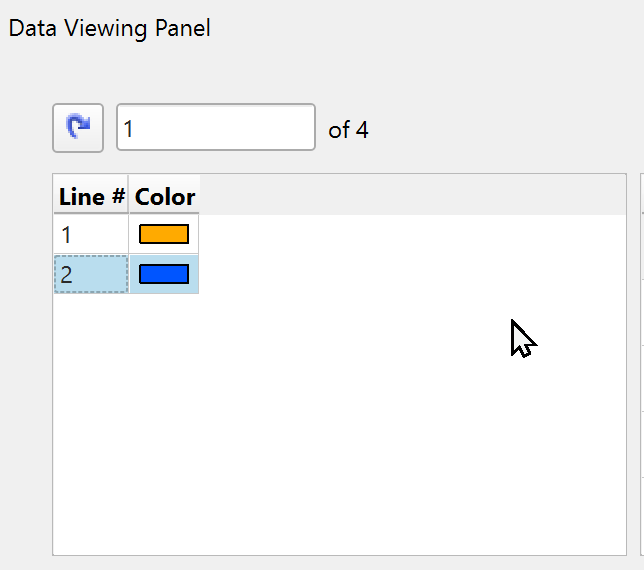
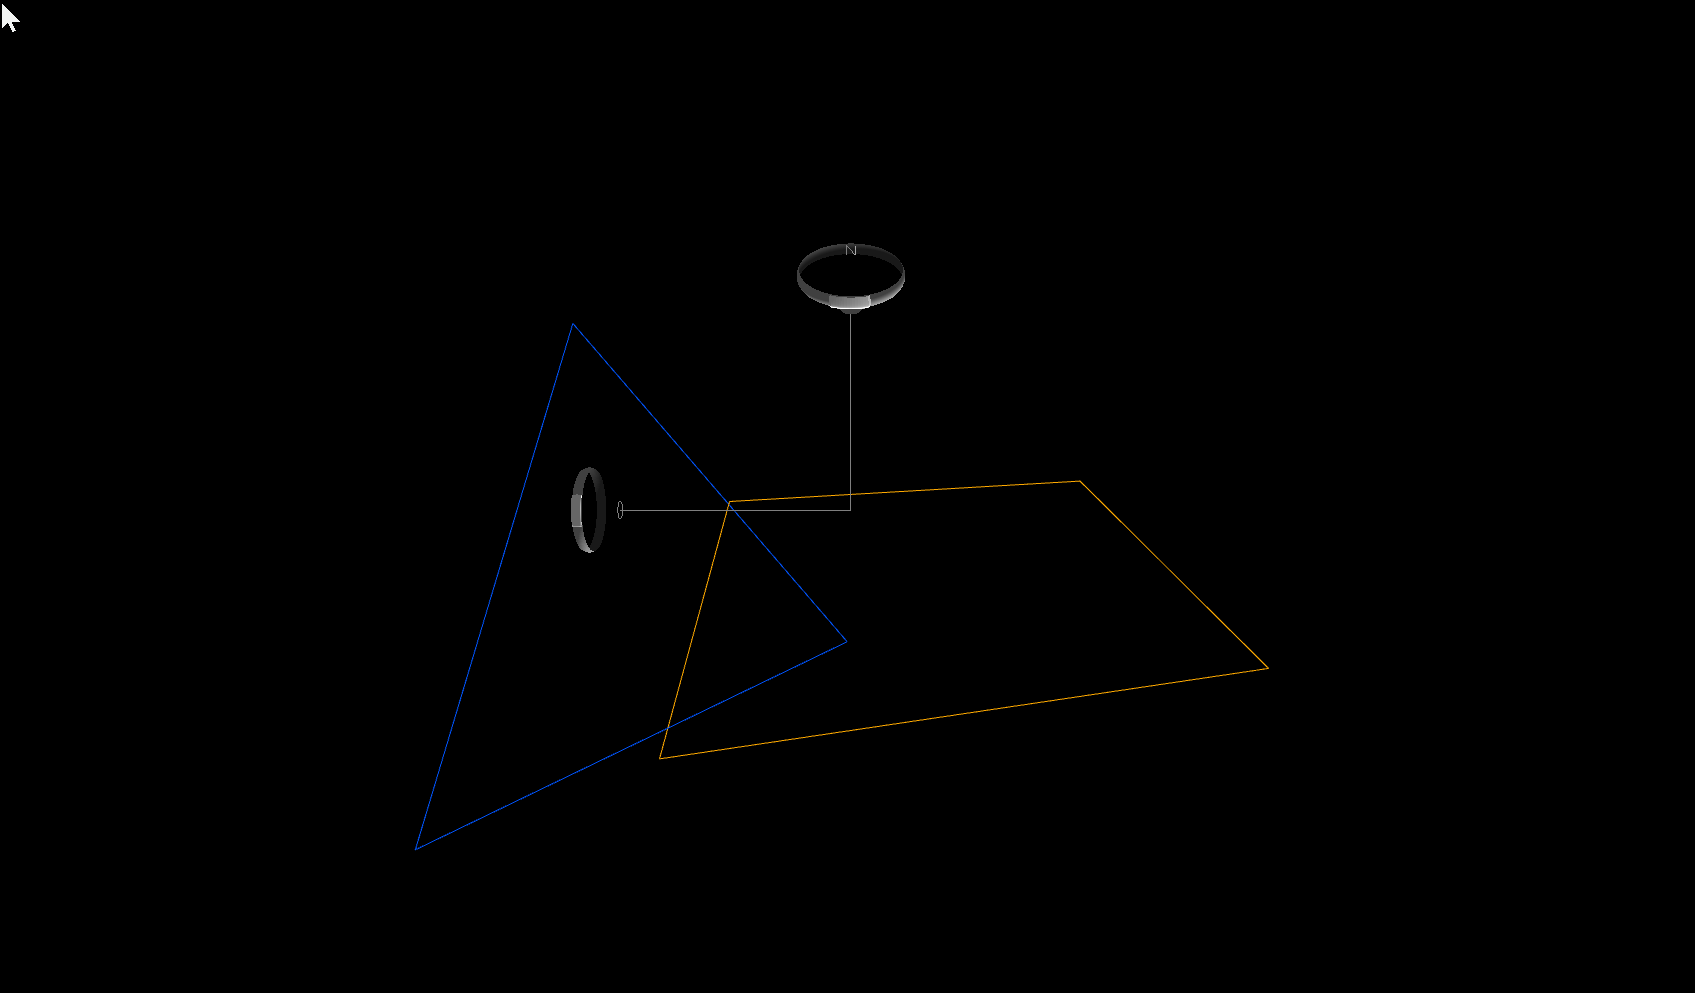
Lines with Color Column
Other Actions
Double clicking on an entry in the data viewing panel will zoom to the location or KP (if present) of the entry.