Simrad EA-series Sub Bottom Profiling - 44
Description
Driver for decoding various telegrams from the Kongsberg-Simrad EA400/440/500/600 Echosounder family via a network connection.
The following telegrams are supported:
D | Simrad Ping Based Binary Depth |
SSG | Sidescan target (use event driver) |
VGR | Vertical target (use event driver) |
RAW0 | Raw Telegram for Sidescan sonar, Sub Bottom Profiler and Watercolumn |
Echogram | Sidescan sonar |
The RAW0 and Q datagram are described in the Sidescan System chapter.
Note that the RAW0 message can also be used for the bottom classification algorithm.
Refer to Sidescan Systems chapter for more details.
As mentioned above, EAXXX series Echosounders can also be extended with a sidescan sonar setup. Usually a configuration of multiple side looking 120 kHz Transducers is used for this.
The classification 'RAW0' raw telegram is also used for the bottom classification algorithm. To use this algorithm an extra Sub Bottom Profiler add-on on the dongle is needed.
Not on the same port
Do not output Echogram messages, RAW0 and SSG/VGR datagrams on the same port. SSG and VGR datagrams, however, may arrive on the same port!
Driver Information
Driver | Network - Simrad EA-series (Ping based Binary datagram - D#) | Interface Type | UDP + TCP-IP | Driver Class Type | Counted/Terminated |
|---|---|---|---|---|---|
Yes and No | Input / Output | Input | Executable | DrvSimradEAxxxSocket.exe | |
Related Systems |
| ||||
Related Pages | |||||
Coding Notes
Decoding Notes
The quality indicator of the depth observation will be the reflectivity value (in case of D#-message) which can be monitored with an Observation Physics Display or the Generic Display.
For time-tagging purposes the time from the message will be used if the driver "(With UTC)" has been chosen. If the other drivers (without the UTC) have been chosen, local computer time (or Time Synchronization/PPS if it is connected to Qinsy) will be used for time-tagging.
The Channel number (Qx) is used to identify the transducer. Make sure that the correct slot numbers are used in Database Setup (see section Database Setup).
Notice that for the depth message all other fields (like transducer number, athwart ship's angle) are not used by Qinsy.
The position from an SSG message is assumed to be the transducer position on WGS-84 datum. The Driver will calculate the target sample position with a range-bearing calculation from the decoded position and the decode heading (+/-90 degrees) and ground range.
The target sample position is stored as part of the event information in the database. The comment of the event is filled with some information of the message type and the fields.
The position from a VGR message is assumed to be on WGS-84 datum and is stored directly as part of the event information. Comment of the event is filled with some information of the message type and the fields. The Channel Id is not used.
Echogram
The echogram will contain (extra) amplified and compressed sidescan samples.
Only the Pelagic Data is used.
If Selected pelagic (surface) range is larger than there is actual data then zeros are decoded.
Sound Velocity is not available in message.
Samples are compressed by the EA400.
RAW0 (EA440)
This message contains all the samples that are acquired during the sweep, no additional amplification is applied.
Sound Velocity is decoded from this message.
All the samples are decoded. If operation is in deep water, there will be many samples (many thousands).
Angle data is never decoded.
System Config
System Configuration EA440 for Qinsy
Under system configuration we will show an example of multiple channels and outputs from the Kongsberg EA440 software to Qinsy.
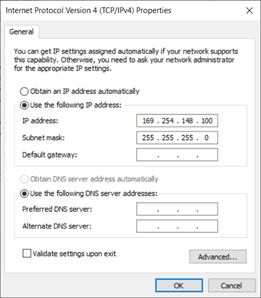
Example for the computer IP-address.
Setup Transceivers and I/O ports
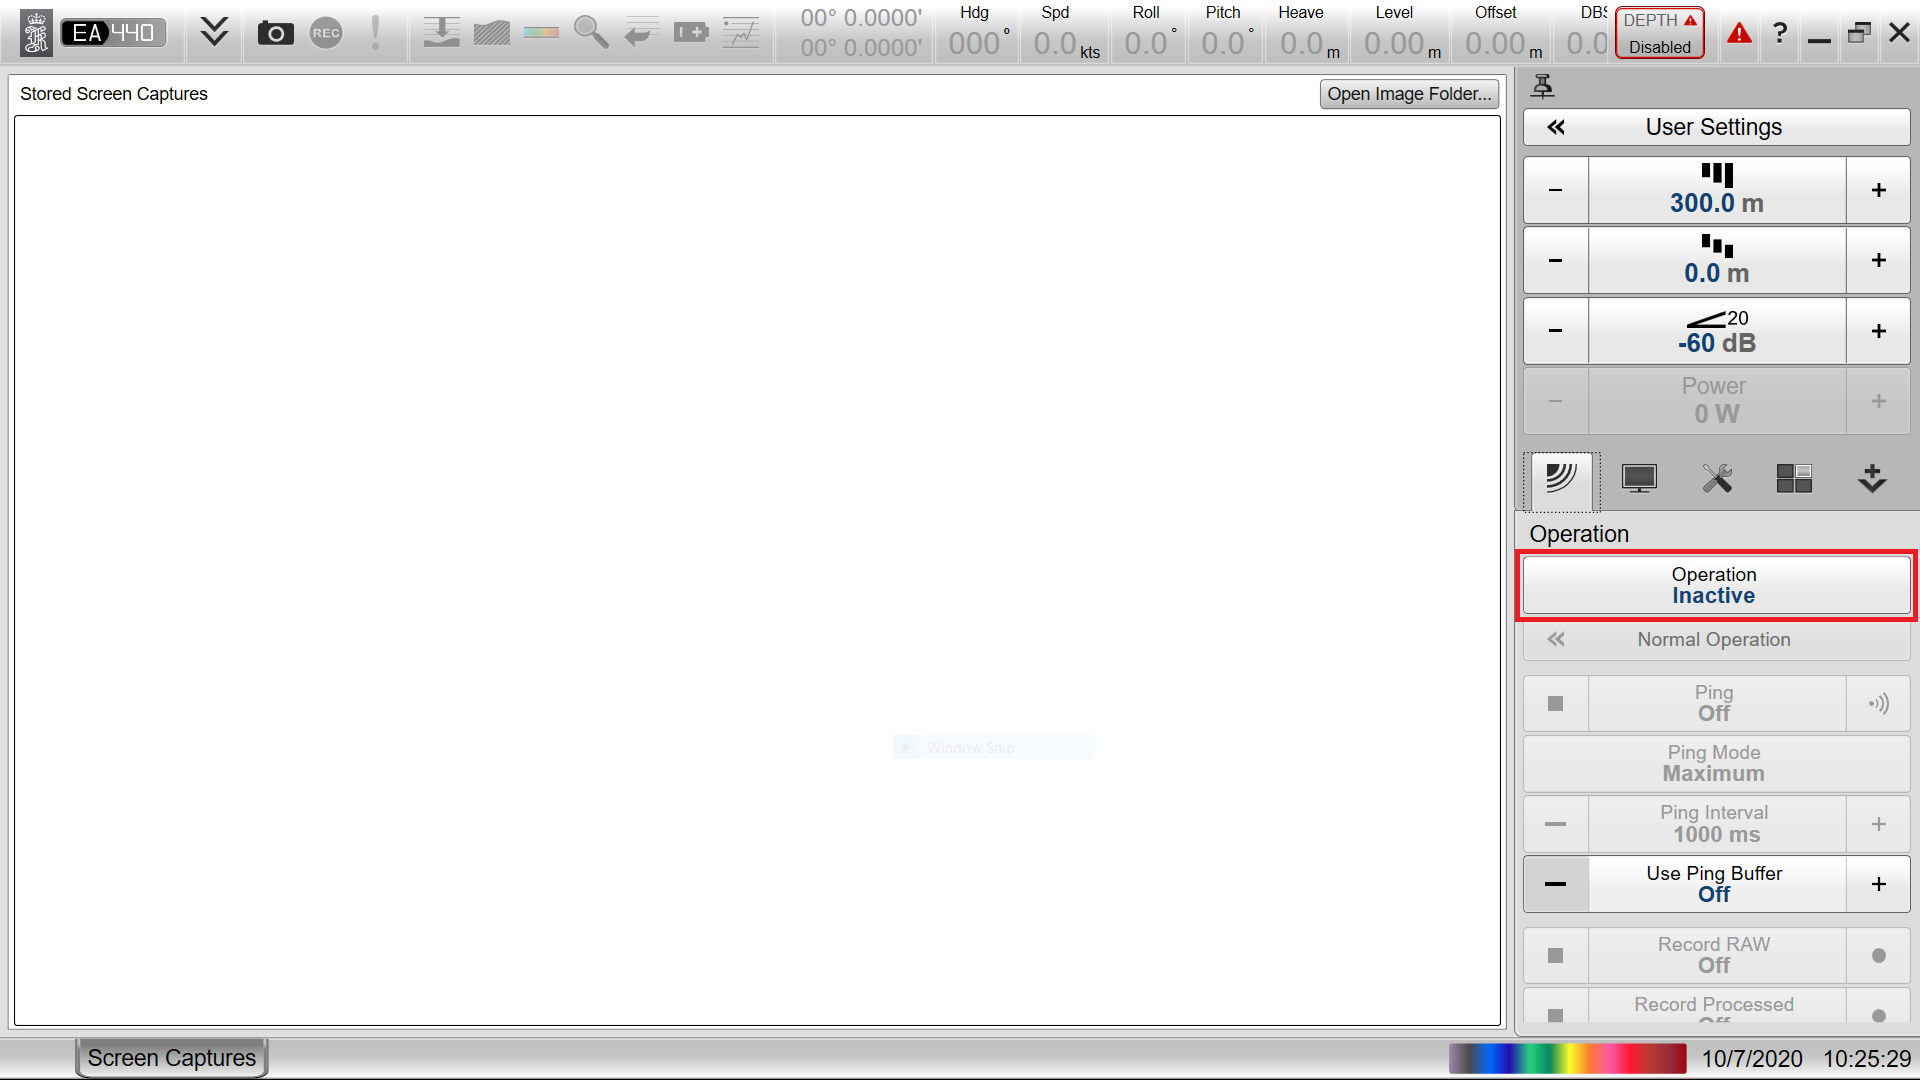
Open the Kongsberg EA440 software and make sure that the status is 'Inactive'. Once set up accordingly go to Setup and open 'Installation'.
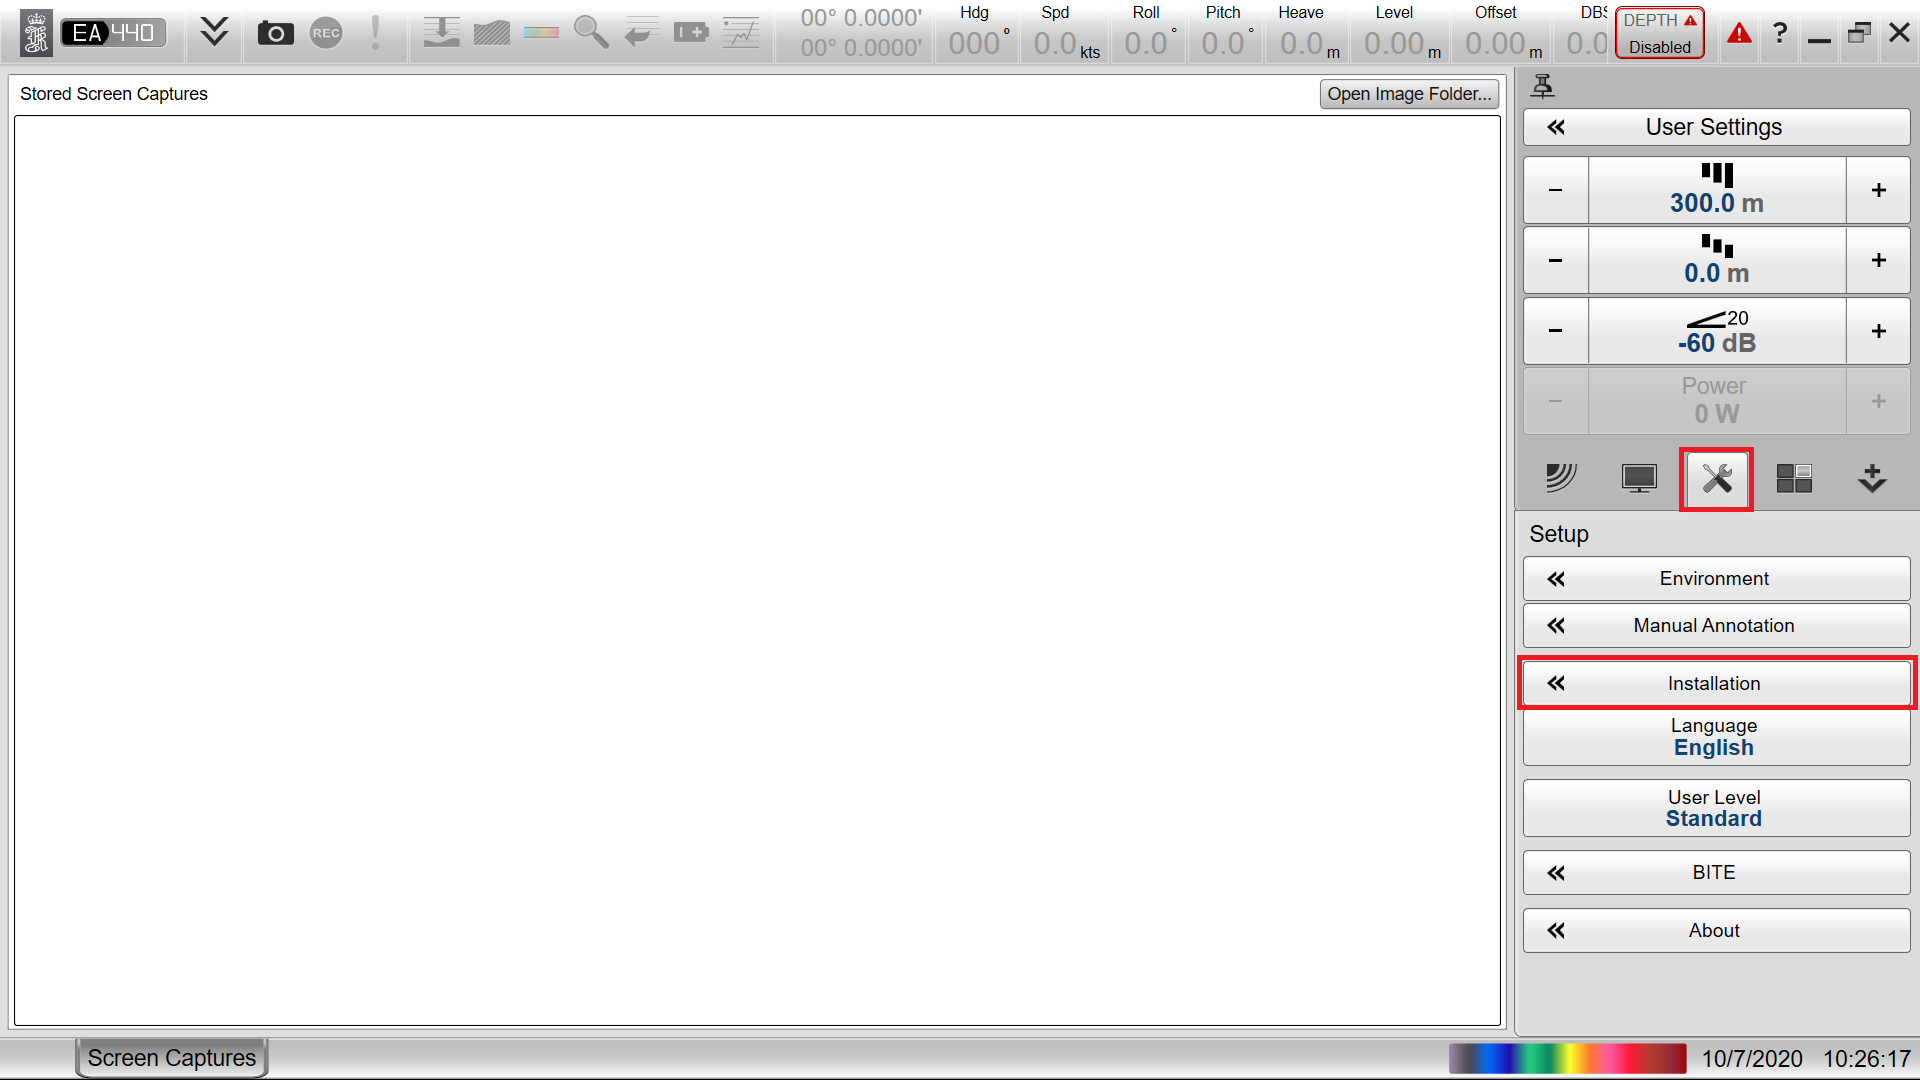
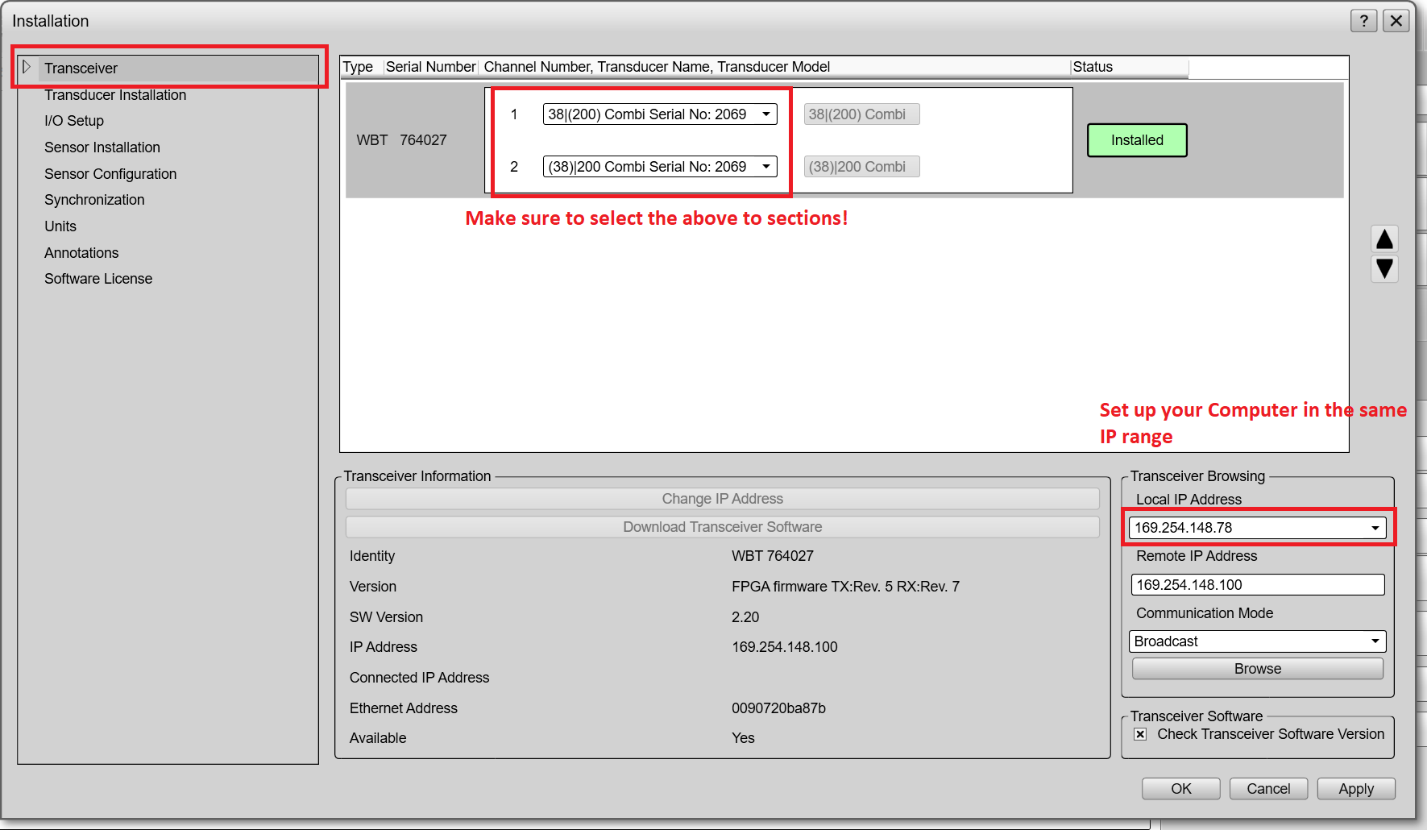
In the Installation settings you will want to set up the available Channels under Transceiver.
Don't forget to check the IP Address of the EA440 Unit and change it to comply with your computer IP address (same range)
Once correctly installed it is necessary to set up the LAN or Serial ports under I/O Setup.
In the following example, the network ports 2002, 2003 and 2004 are set up to output locally.
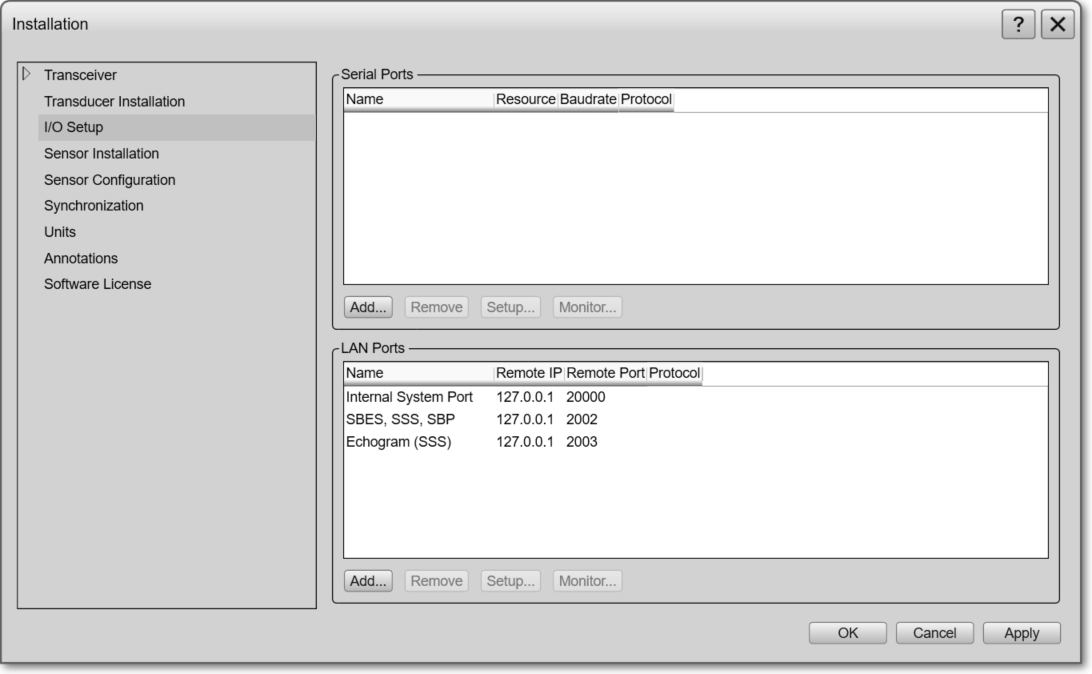
This should be enough to get the EA440 software up and running.
Important information
Make sure to go back to Operation and set this to Normal.
This will allow you to start Pinging (Ping on).
Output Singlebeam
Make sure to define the correct Output format from the EA440 software. To get to this stage you need to go to Output in the Operation window:
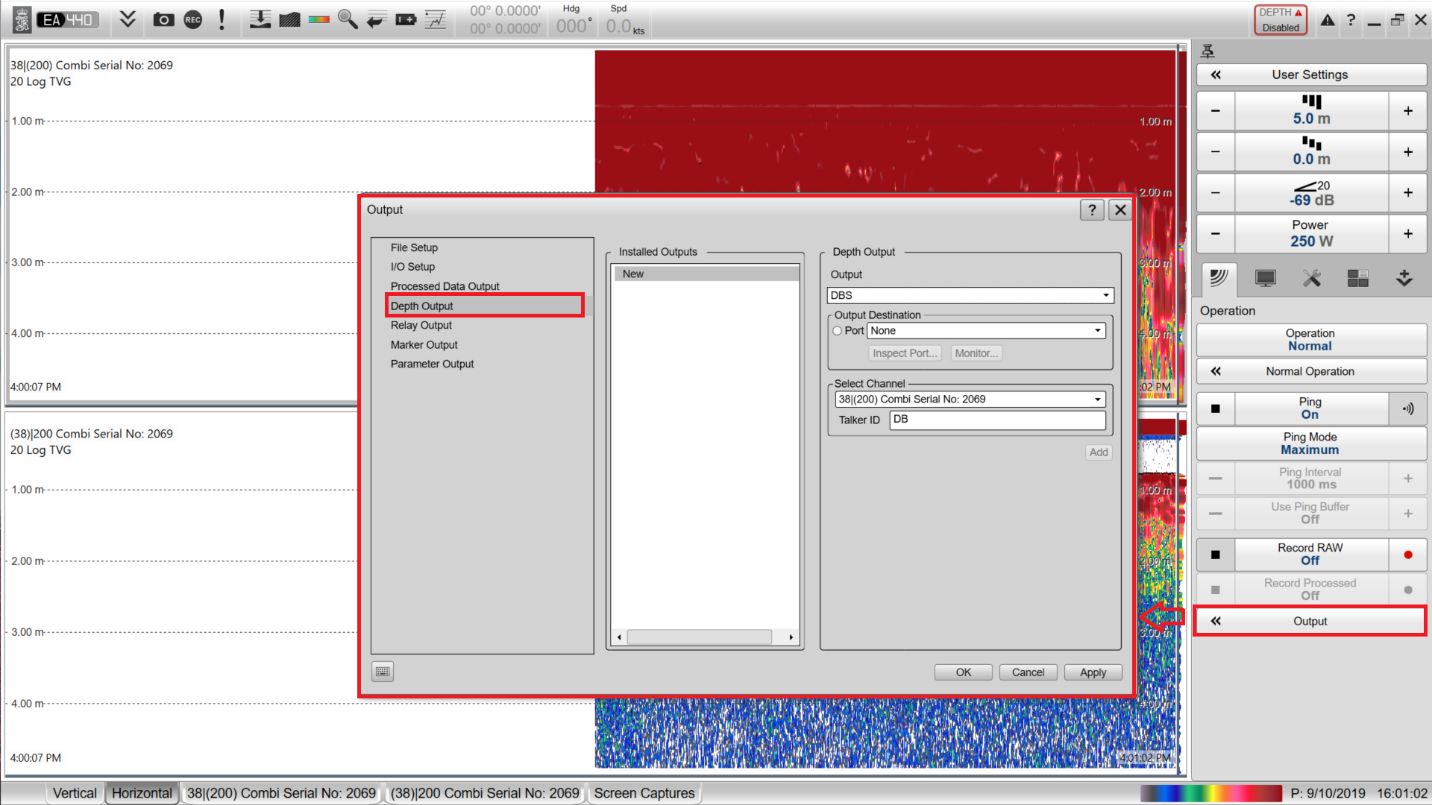
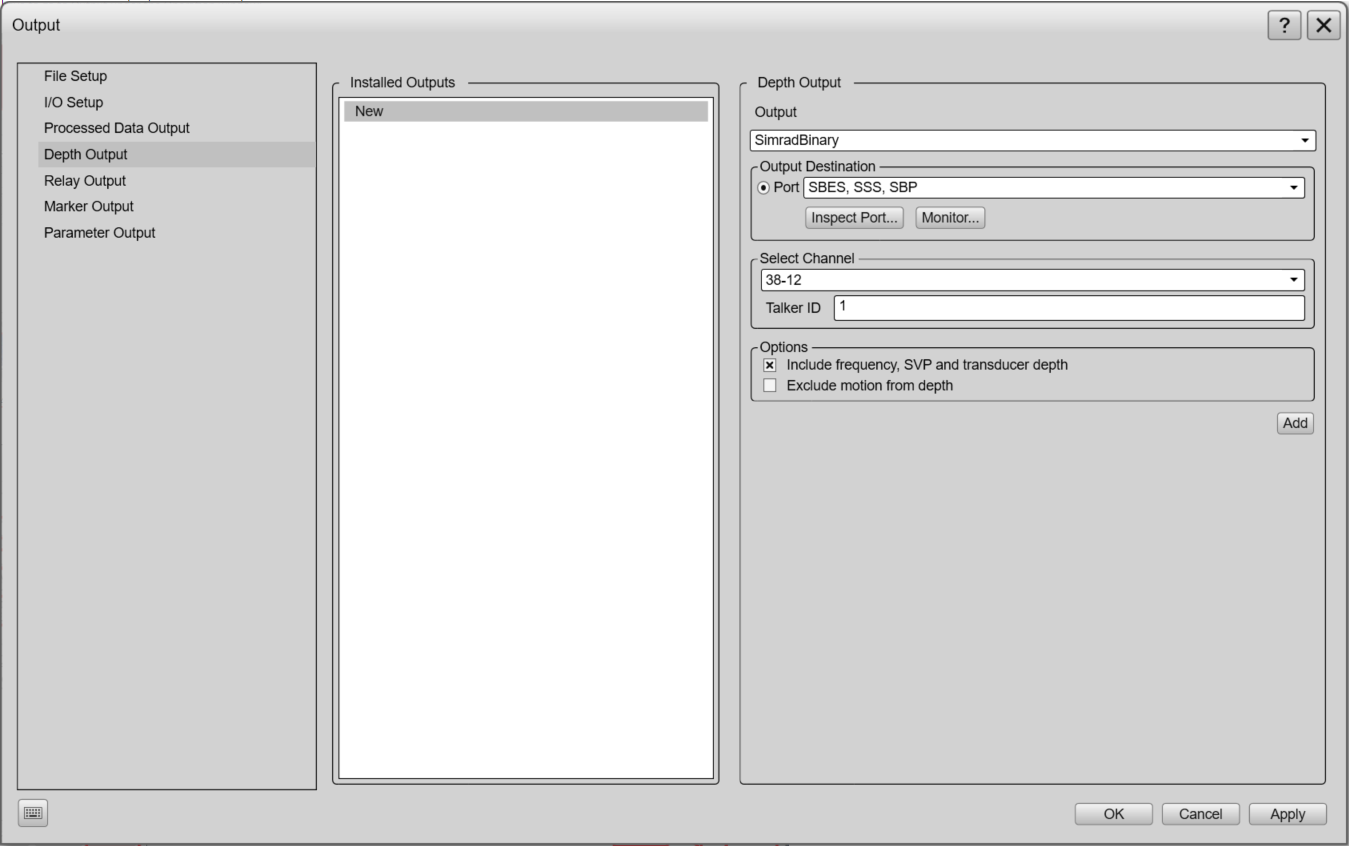
To decode the Simrad EA Series in Qinsy, you need to set up Simrad Binary in the Kongsberg EA440 Software. Verify the port to check the output format.
Important: Make sure to Include frequency, SVP and transducer depth.
Don't forget to click on 'Add' and 'Apply' to save the settings.
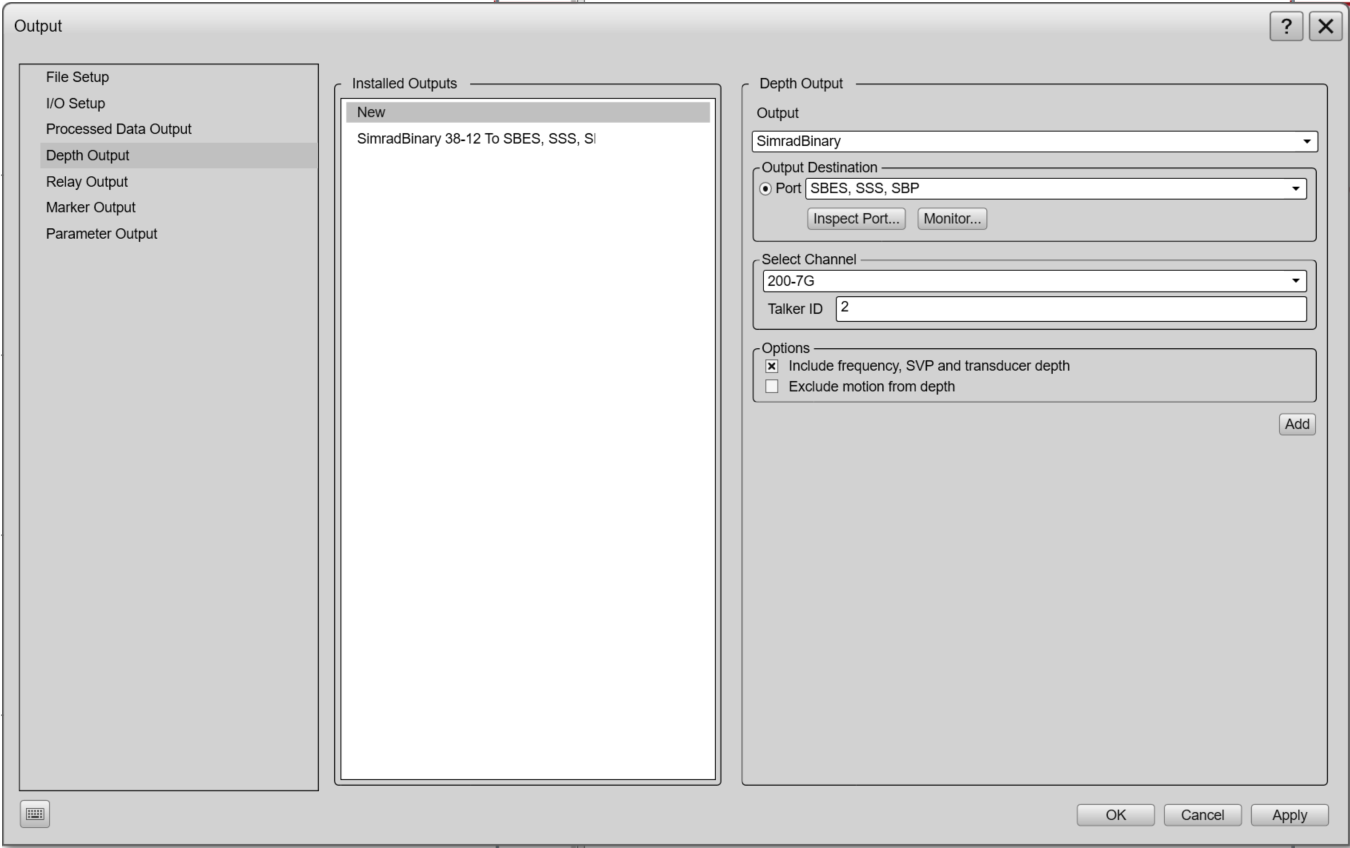
Older user-interface may look like this:
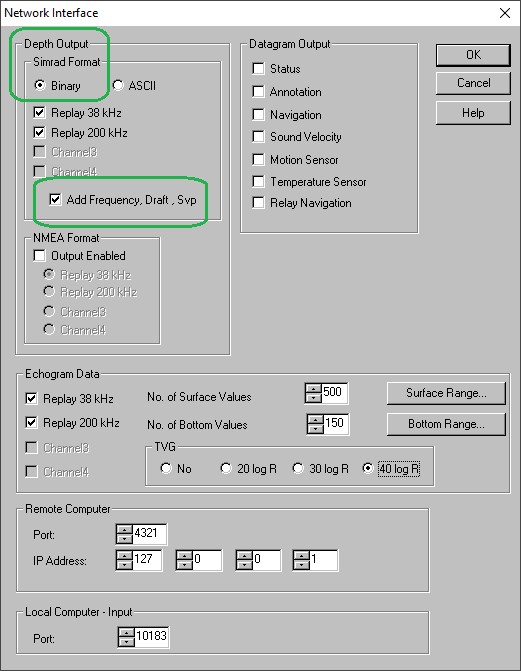
Make sure to Add Frequency, Draft, Svp.
Output Information
If there are multiple channels available, make sure to select the correct one and define a Talker ID (number 1 to 9)
Talker ID will be used in Qinsy as slot ID to define which channel to decode
If there is only a single channel the talker ID will automatically be 1.
Output Side Scan Sonar, Watercolumn and Sub Bottom Profiler data (RAW0)
To output datagrams which Qinsy can decode as Raw data samples (RAW0 format).
This message contains all the samples that are acquired during the sweep, no additional amplification is applied:
Side Scan Sonar
Watercolumn
Sub Bottom Profiler
Processed Data Output needs to be set up, the same as outputting Simrad Binary data: select 'EA440' as output and select the same port as done above.
If you have multiple channels, the Processed Data output will output both channels on one output.
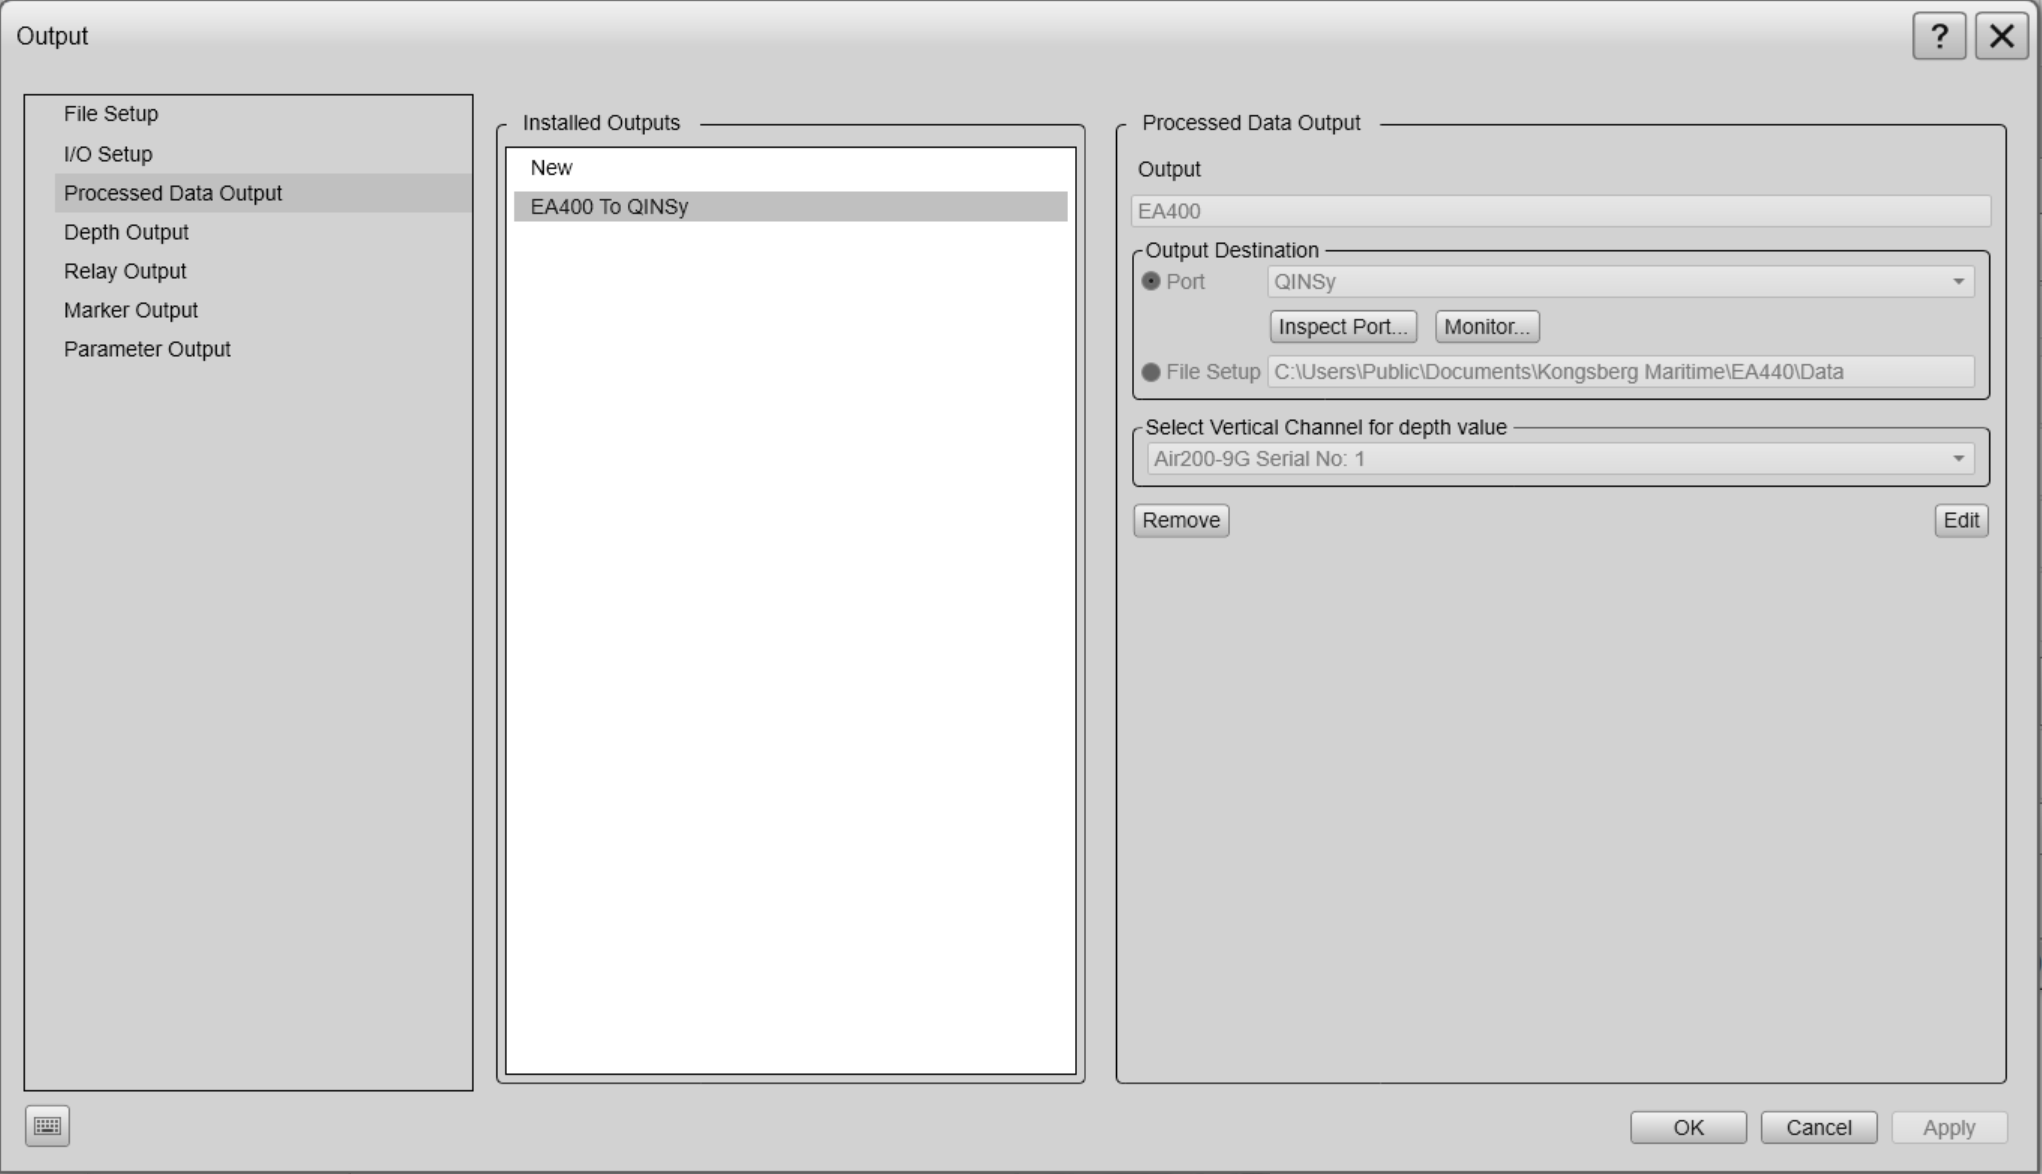
Output Side Scan Sonar (Echogram)
Not on the same port
Do not output Echogram messages and RAW0 on the same port!
To output Echogram data to be decoded as Side Scan Sonar in Qinsy, you will have to add a different output (as Raw0 and Echogram should not be output on the same port).
The echogram will contain (extra) amplified and compressed sidescan samples.
The number of samples that are to be transferred is user selectable and hence independent of the operating range of the EA400.
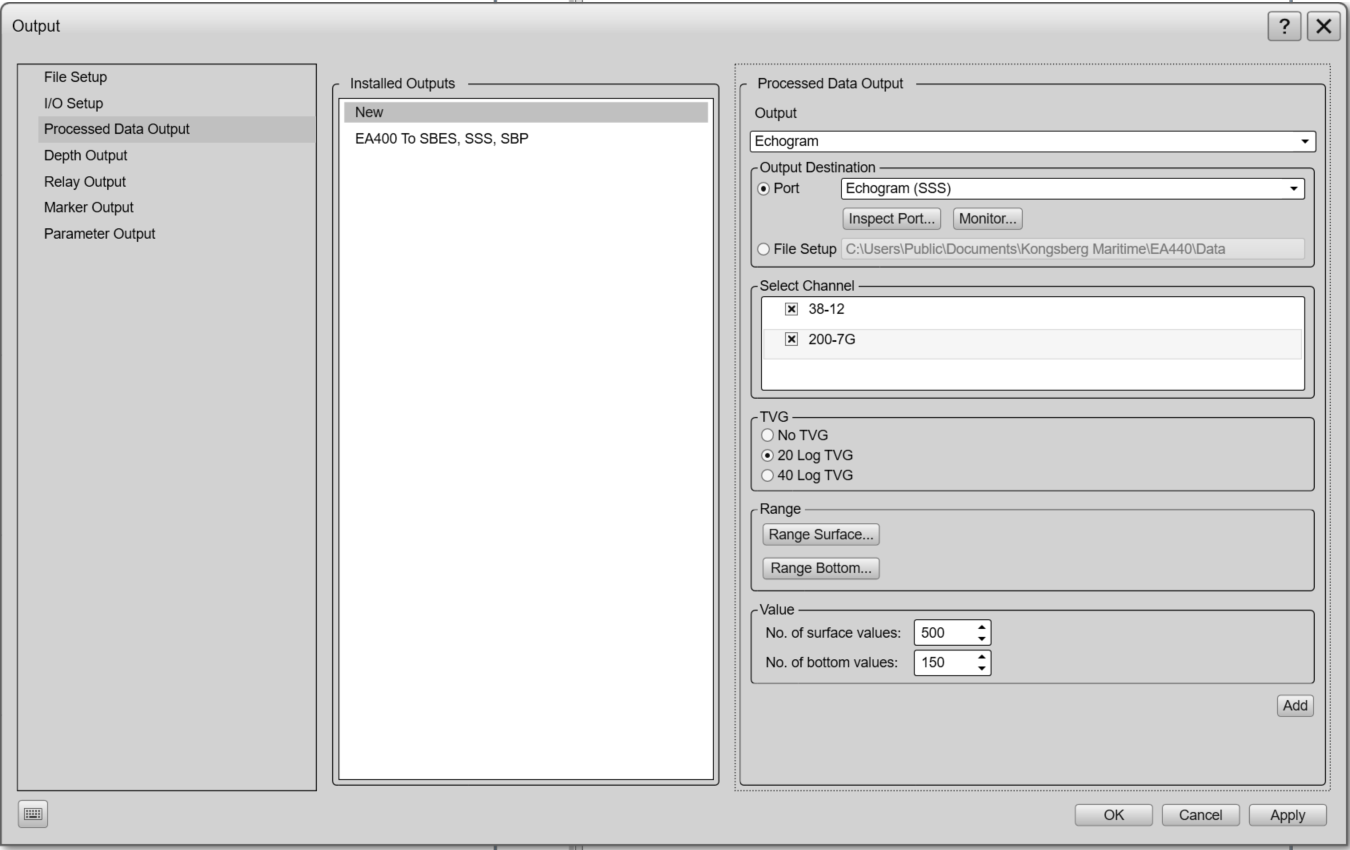
Qinsy Config
Database Setup
Singlebeam
In Qinsy we need to add a Type: 'Singlebeam Echosounder' with the Driver: 'Network - Simrad EA-series (With UTC)'
UTC Driver
Select the UTC driver if you would like to decode the time message from the Simrad datastring.
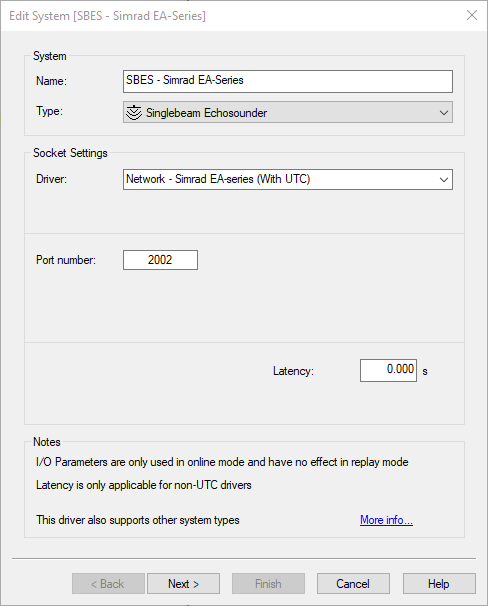
Under the Singlebeam Echosounder Transducer, make sure to select the correct transducer location:
Add the channels as set up in the EA440 software as well by selecting the correct Slot IDs (TalkerID in EA440 software)
Label the Transducers accordingly, this way you will know which frequency is which during your online session.
Talker ID
The Talker ID as set up in the EA440 Software is identical to the Slot ID as set up in Qinsy
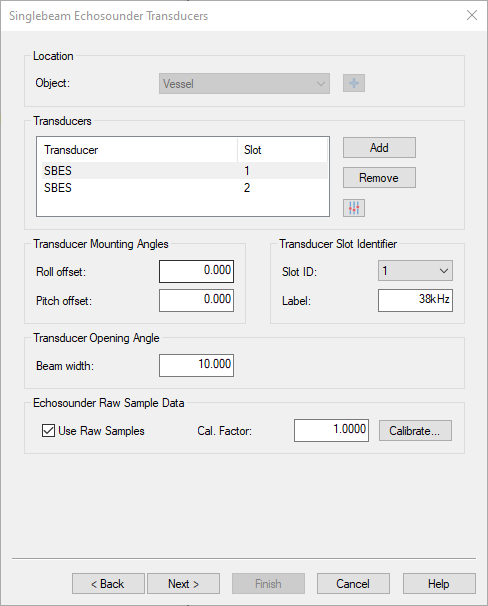
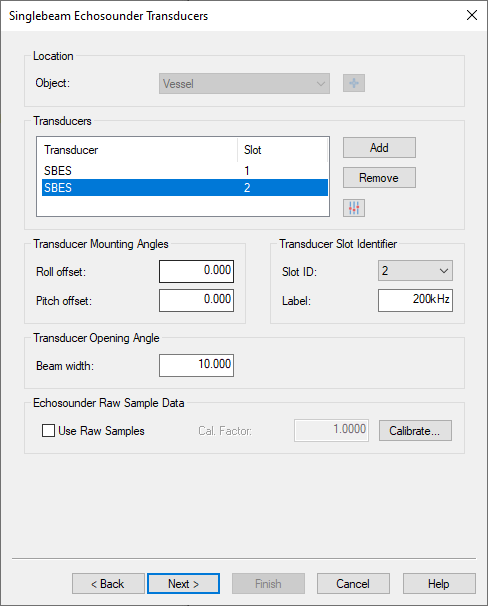
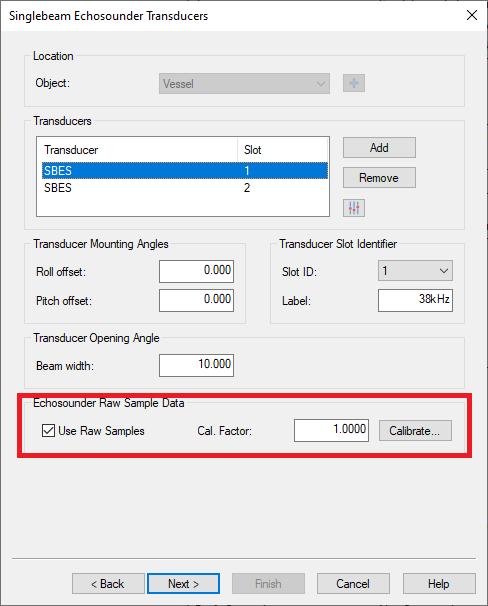
To decode watercolumn samples, tick the box 'Use Raw Samples' for each channel.
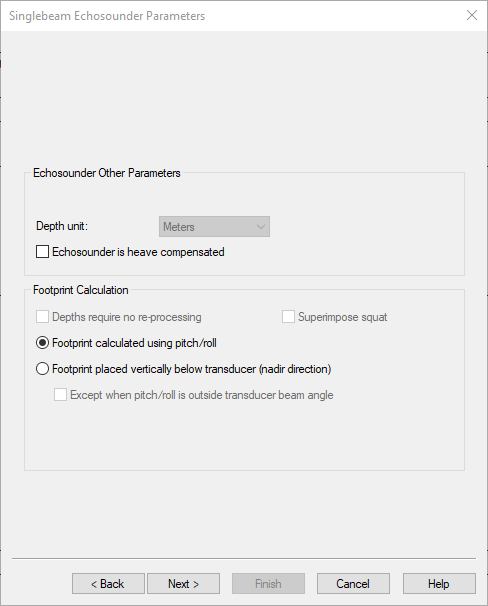
The settings for the draft and used sound velocity can now be found Online in the Echosounder Settings of the Controller.
Side Scan Sonar
Depending on which output is set up (Raw0 or Echogram) you will need to select the correct port as set in Kongsberg EA440 software.
For Raw0 format
RAW0 info
Note that the Raw0 allows to decode both channels from the same datastring.
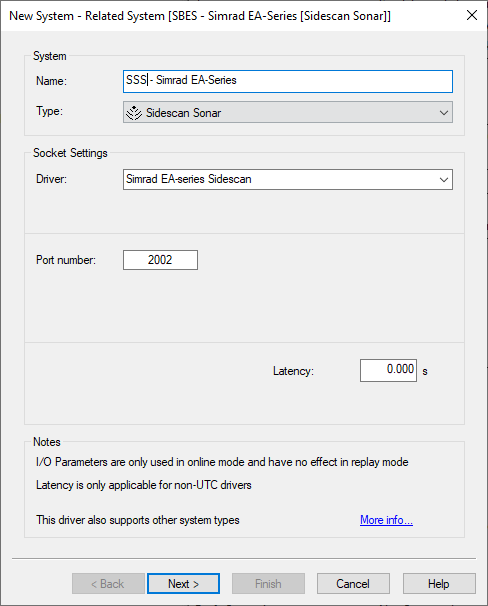
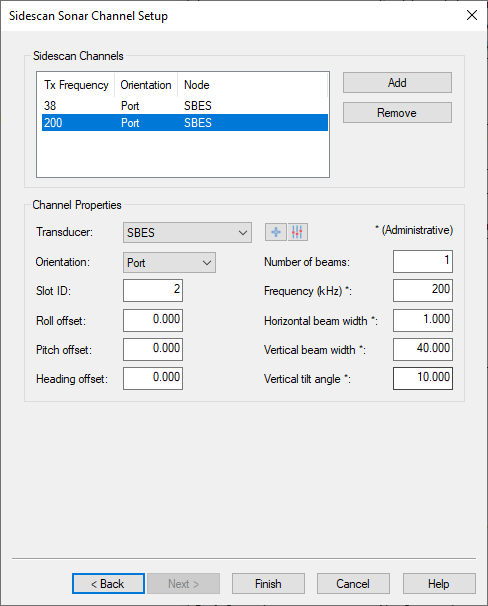
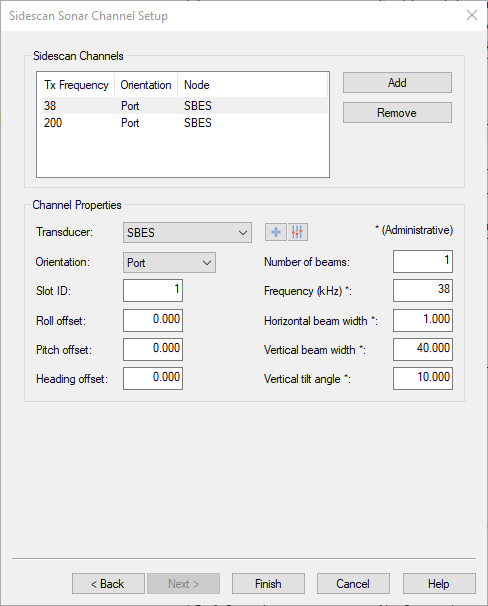
For Echogram
Echogram Info
Note: Only one channel on one port can be decoded.
This means:
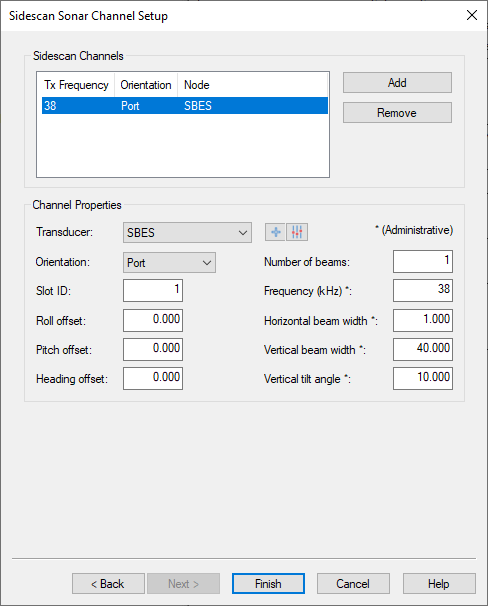
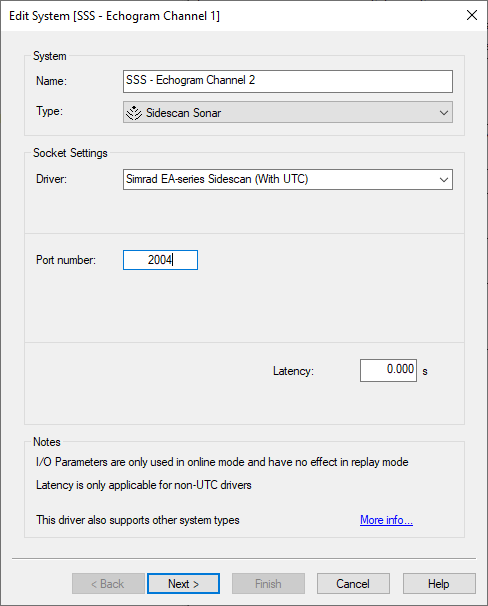
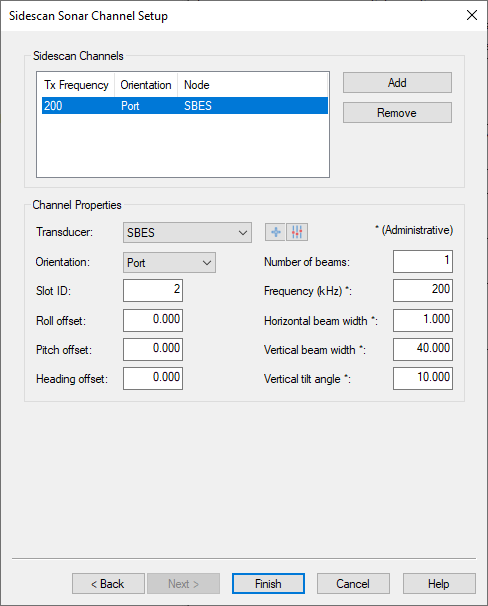
For every channel in the Kongsberg EA440 a separate port and output needs to be defined
In Qinsy each channel will have its own system
Side Scan sonar system for channel 1:
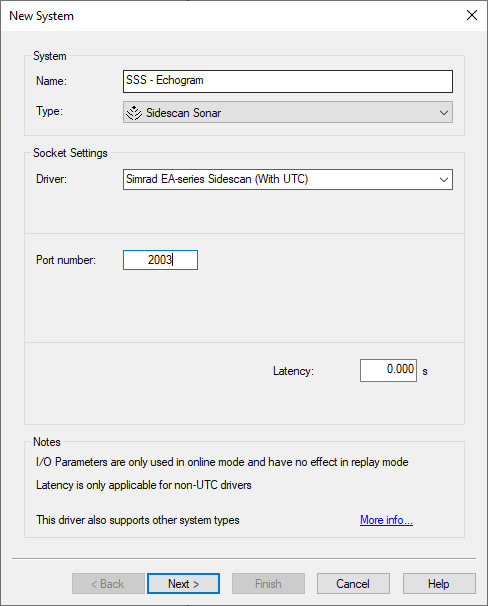
Side Scan Sonar System for channel 2:
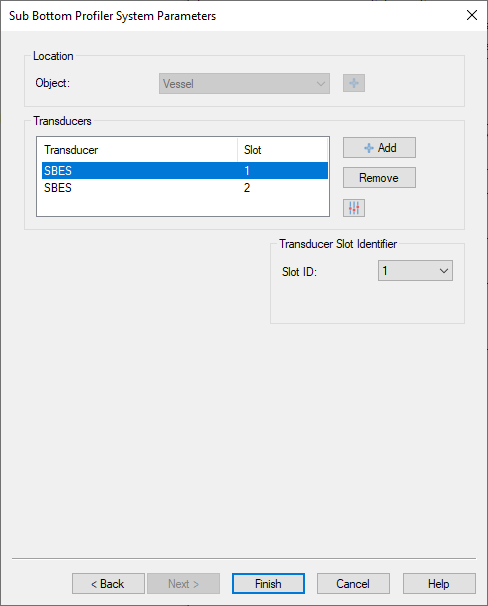
Sub Bottom Profiler
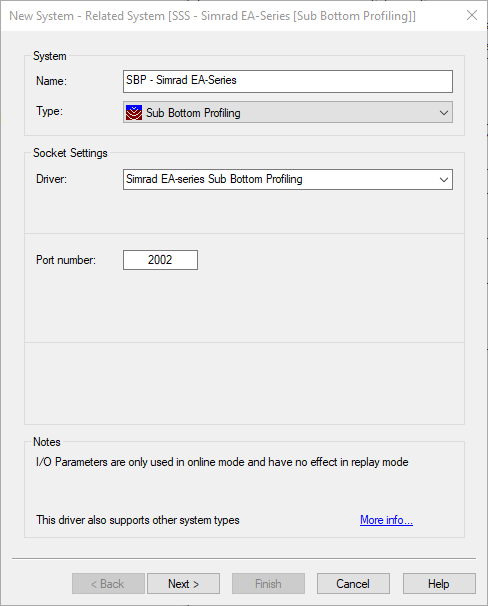
Sub Bottom Profiler data is decoded from the same EA440 messages.
Set the correct type and driver
Add the same number of Channels as in the Kongsberg EA440 software
Define the correct Slot IDs as set in Kongsberg EA440 Software
Qinsy Online
Online
The driver has no user-interface so you should use the various displays to see if data is received and decoded.
Use the Controller's Refraction settings if you wish to improve the reported depth with a better sound velocity.
Controller
The Sound velocity mode can be found in the Controller's Echosounder Settings:

Here you may overrule the default sound velocity as used by the echosounder unit in order to improve the measured depth with a better sound velocity.
As used by the unit (default)
Qinsy will use the decoded depth value as reported by the unit.
Use this mode when you're confident that the used sound velocity is accurate enough for your survey specifications.From calibrated sound velocity
Use this mode when the echosounder unit is using a default/wrong/out-dated sound velocity and from your own measurement/calibration you have determined a better sound velocity value.From velocity profile (recommended)
Use this mode when your setup has an up-to-date sound velocity profile for your survey area.
This mode is recommended because ray-tracing will be used for the entire water-column instead of one fixed sound velocity value.From velocity observation
Use this mode when the echosounder unit is using a default/wrong/out-dated sound velocity and you have a sensor defined in your setup that measures in real-time an accurate sound velocity value.
Display watercolumn
Open an Echosounder display and select View Properties
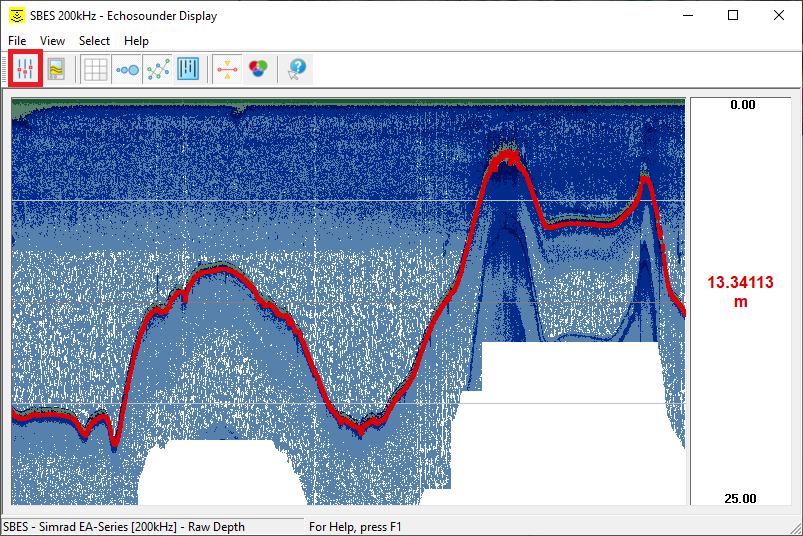
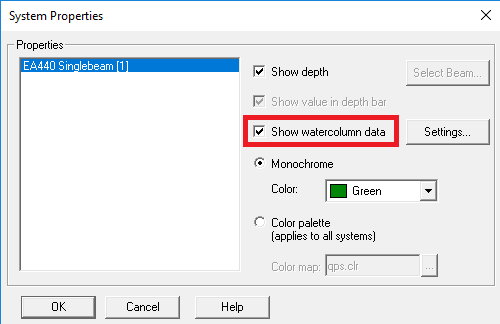
For displaying the watercolumn, you will have to select for which channel you would like to see the Watercolumn data:
Watercolumn info
If you would like to display the watercolumn for more channels, it is possible to create additional Echosounder Displays.
Additional information
Additional Information
For exporting Sub Bottom Profiler data please find:
For more information on working with Singlebeam Echosounder Raw Data:
