Description
Driver to decode water depth and water temperature data from an AIRMAR EchoRange™ Dual Frequency Smart Transducer, outputting the so-called XDR(X) sentence.
-
There are two versions of this driver, a serial one and a network (UDP) version. Decoding is the same for both.
-
Depth values from two frequencies will be decoded: Low (30 KHZ) and/or High (200 KHz).
-
No time information is part of the message, therefore time stamping of the data is done when it arrives at the I/O port.
-
No quality indicators are part of the message, therefore all observation quality indicators will be zero.
Driver Information
|
Driver |
AIRMAR EchoRange ($SDXDR) Depth High/Low Frequency
|
Interface Type |
Serial / UDP |
Driver Class Type |
Terminated |
|---|---|---|---|---|---|
|
No |
Input / Output |
Input |
Executable |
DrvQpsTerminated.exe
|
|
|
Related Systems |
|
||||
|
Related Pages |
|
||||
Interfacing Notes
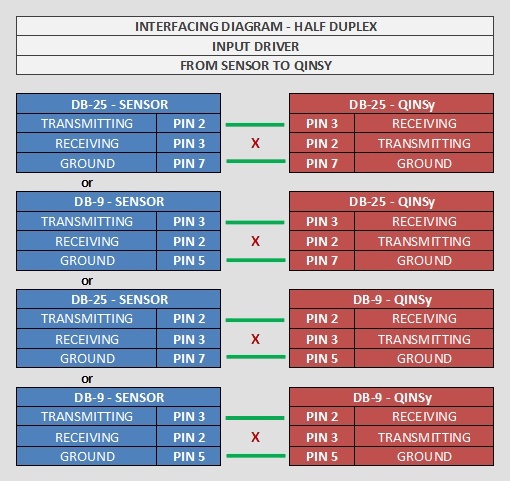
The driver does not send any data or commands to the AIRMAR system, so (for the serial version of the driver) only half-duplex wiring is needed:
Database Setup
-
In order to decode the water depth, add to your template setup a Singlebeam Echosounder system and select driver AIRMAR EchoRange ($SDXDR) Depth High/Low Frequency" or "Network - AIRMAR EchoRange ($SDXDR) Depth High/Low Frequency" for the UDP variant.
Fill in the correct serial I/O parameters or UDP port and press Next to go to the next wizard page.
Add two Transducers, each one with its unique Slot Id.
The selected node for each transducer should be the actual transducer location, and therefore the same for both: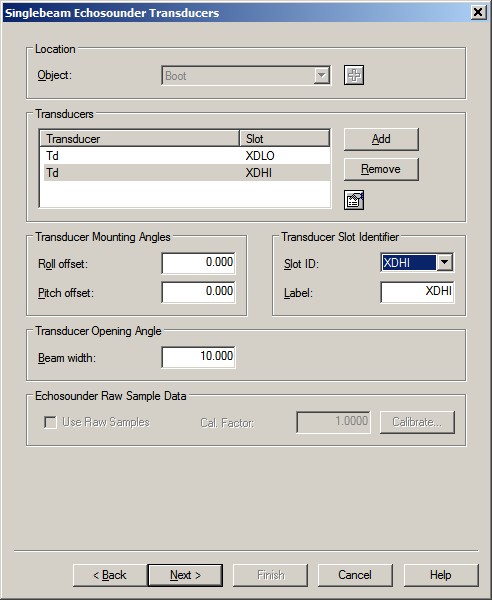
-- Slot Id for the High frequency depth must be XDHI.
-- Slot Id for the Low frequency depth must be XDLO.
-- The label can be any free text, with a maximum of 10 characters.
On the next wizard page leave the default settings. Data from the echosounder will always be in meters.
If you need to improve the reported depth with a better sound velocity then this should be changed in the online setup.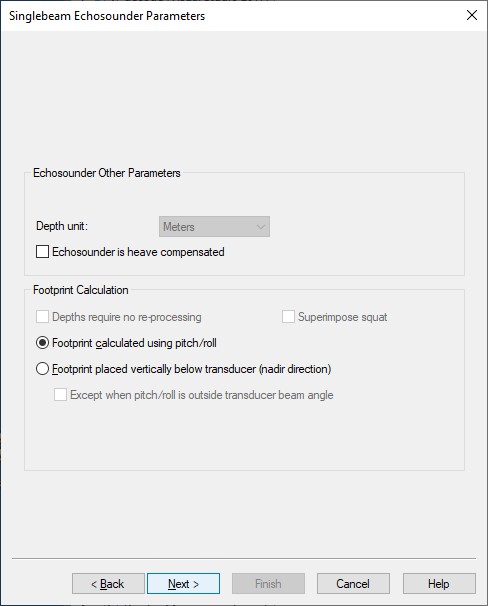
-
In order to decode the water temperature from the sensor, add a Miscellaneous system to your template setup and select driver "AIRMAR EchoRange ($SDXDR) Water Temperature" or "Network - AIRMAR EchoRange ($SDXDR) Water Temperature" for the UDP variant.
Fill in the same I/O parameters, and press Next to go to the next wizard page.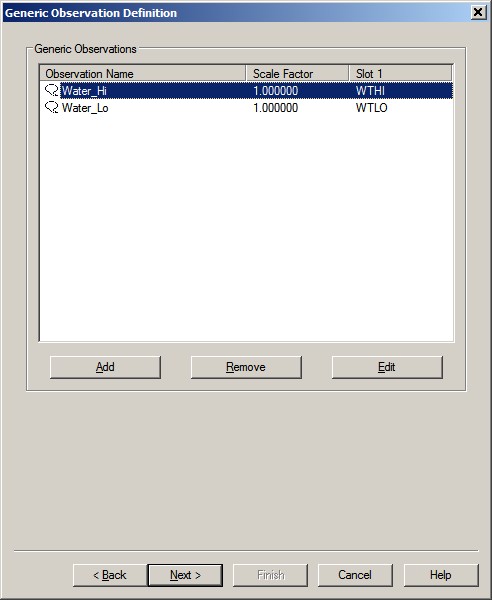
-- Slot Id for the temperature from the high frequency sensor must be WTHI.
-- Slot Id for the temperature from the low frequency sensor must be WTLO.
-- The name can be any free text, with a maximum of 16 characters.
Online
The driver has no user-interface so you should use the various displays to see if data is received and decoded.
Use the Controller's Refraction settings if you wish to improve the reported depth with a better sound velocity.
Controller
The Sound velocity mode can be found in the Controller's Echosounder Settings:
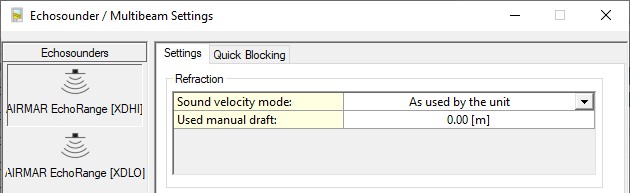
Here you may overrule the default sound velocity as used by the echosounder unit in order to improve the measured depth with a better sound velocity.
-
As used by the unit (default)
Qinsy will use the decoded depth value as reported by the unit.
Use this mode when you're confident that the used sound velocity is accurate enough for your survey specifications. -
From calibrated sound velocity
Use this mode when the echosounder unit is using a default/wrong/out-dated sound velocity and from your own measurement/calibration you have determined a better sound velocity value. -
From velocity profile (recommended)
Use this mode when your setup has an up-to-date sound velocity profile for your survey area.
This mode is recommended because ray-tracing will be used for the entire water-column instead of one fixed sound velocity value. -
From velocity observation
Use this mode when the echosounder unit is using a default/wrong/out-dated sound velocity and you have a sensor defined in your setup that measures in real-time an accurate sound velocity value.
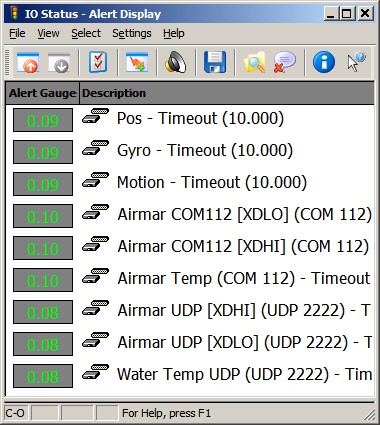
Alert Display
Use an Alert Display to see if data is coming in at the I/O port:
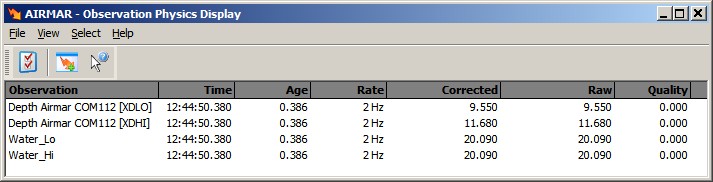
Observation Physics Display
The decoded data can be displayed using an Observation Physics Display:
Use View Properties to enable three additional columns to monitor extra information from this system:
-
Extra Column 1 will show you the used sound velocity as defined by the Sound velocity mode in the Controller online setup.
-
Extra Column 2 will either show you the calibrated sound velocity, or the selected velocity observation, or the mean sound velocity from the velocity profile.
So this value depends on the Sound velocity mode as defined in the Controller's Echosounder Settings.
-
Extra Column 3 will show the used draft value as defined by the Sound velocity mode in the Controller online setup.
The difference between the depth value in the Raw and Corrected Column is as follows:
-
Raw Column: the measured depth (i.e. depth below transducer) as reported by the unit.
-
Corrected Column: the reported depth corrected for draft and sound velocity, which depends on the Sound velocity mode as defined in the Controller's Echosounder Settings.
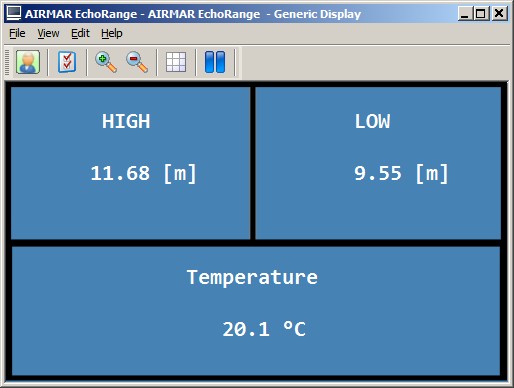
Generic Display
You may also use a Generic Display to show the same values as can be seen using an Observation Physics Display, however with this display you are more flexible to use your own layout, font size and color.