
Description
The Weather Report Generator generates a SYNOP report. This is a weather report sent from ships (manned platforms).
The weather report is created using sensor data and human observations. A SYNOP report is to be generated on the synoptic hours (00:00Z, 06:00Z, 12:00Z and 18:00Z).
Driver Information
|
Driver |
Meteo Report Generator (WMO-SYNOP) |
Interface Type |
|
Driver Class Type |
|
|---|---|---|---|---|---|
|
No |
Input / Output |
Output |
Executable |
DrvMeteoReport.exe |
|
|
Related Systems |
|||||
|
Related Pages |
|
||||
Database Setup
To create a database, which uses this driver, choose the following options.
Create a new system. Choose Output System and find the driver named Meteo Report Generator (WMO-SYNOP).
No other options have to be chosen.
Online
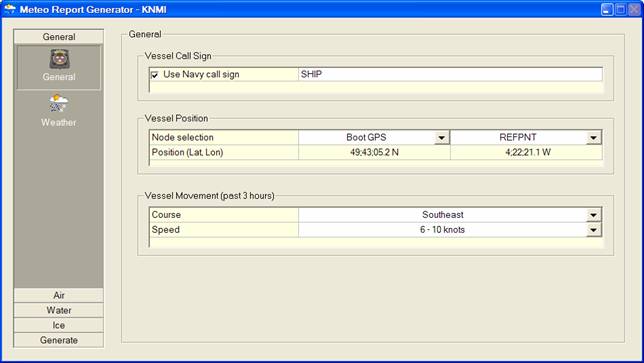
First time online, select a computation and node for this output driver on the General page.
On the last page a preview can be seen of the report that will be generated. By default the filename is set to the WMO standard (WMOyyyymmddhhmm: date and time) and will update every minute.
The default path is the Export folder, which is chosen in the Console.
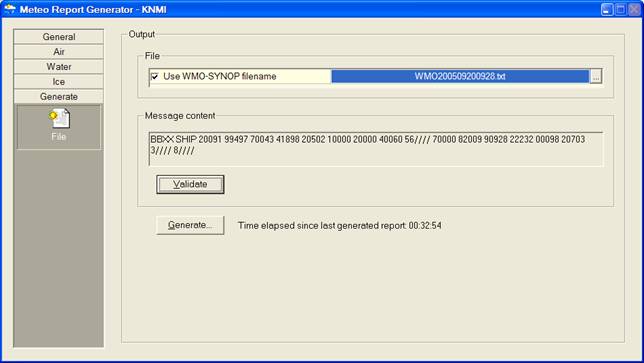
On the synoptic hours the user may walk through all the pages and check if all the settings are still valid or use the Validate button to check automatically all current values, prior generating a new report.
Criteria used by this validation check are defined by the KNMI (Royal Dutch Weather Institute).
When the file is generated successfully a message box will appear and the time since the last generated report will be tracked in the display.
Notice the following about the Air Pressure Group:
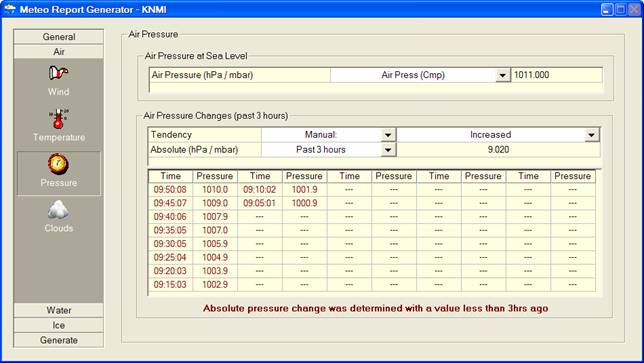
The Absolute Pressure Change, i.e. the difference of the current pressure with the one of 3 hours ago, can be entered manually, or automatically.
To determine this value automatically, select the "Past 3 hours" option.
You have to be on-line for at least 3 hours, before a valid value can be calculated that may be used in the report. In the table below this option you will see a history of the mean pressure value for every 5 minutes. Therefore you also have to be on-line for at least 5 minutes before the first mean value is calculated.
When more than 3 hours of data is available, all value are displayed in green color (instead of red), and the 5A Group will be formatted correctly in the report. If not enough data is available, the group item will be formatted using dashes, e.g. "52////".