
Description
Driver to decode multibeam data from an Imagenex Model DT101 Xi or DT102 Xi Multibeam Sonar Profiling system.
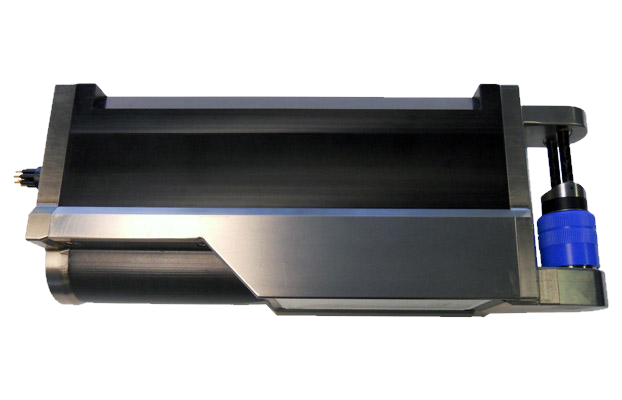
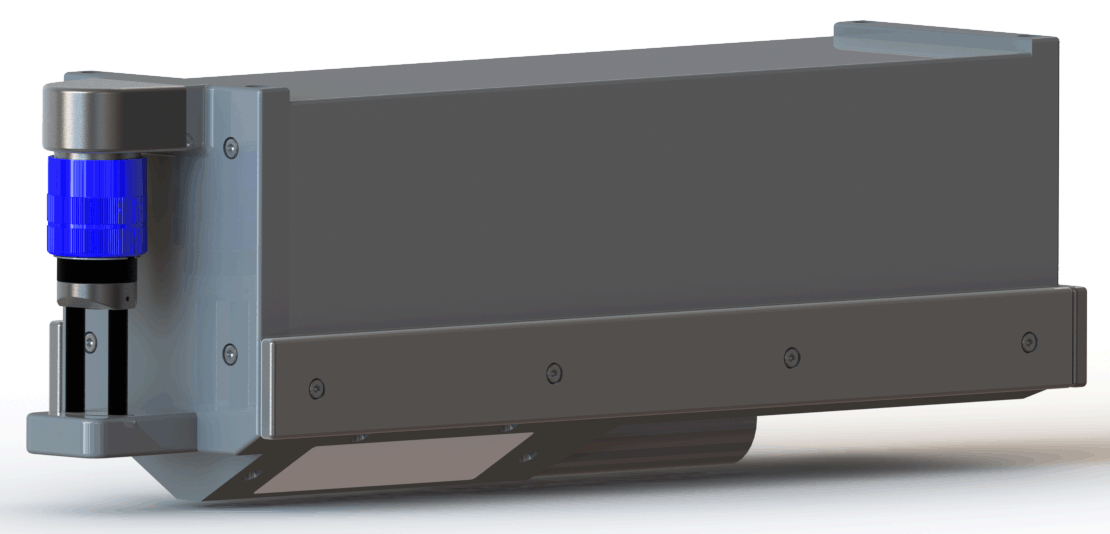
These models are single instruments integrating the sonar, motion reference unit and sound velocity sensor into one sleek and compact unit.
The main differences between the two models are the operating frequency and the maximum number of beams per ping:
|
DT101 Xi |
DT102 Xi |
|---|---|
|
|
|
240 kHz, 480 beams / ping |
675 kHz, 720 beams / ping |
Driver Information
|
Driver |
Imagenex DT101Xi/DT102Xi Multibeam Profiling Sonar (with UTC) |
Interface Type |
UDP |
Driver Class Type |
Freebase |
|---|---|---|---|---|---|
|
Yes and No |
Input / Output |
Input |
Executable |
DrvQPSFreebaseUDP.exe |
|
|
Related Systems |
|
||||
|
Related Pages |
|
||||
The driver expects UDP data packets using the D1P file format protocol which can be output by DT100, DT101, DT101Xi and DT102Xi sonars.
Each message consists of a fixed ping header followed by variable data packets containing the individual beam range/intensity values:
|
Message Sections |
|
Decoded |
|
|---|---|---|---|
|
Contains overhead information such as total number of bytes in this ping, byte offsets and lengths for each section, ping timestamp, frequency, range, gain, etc. |
|
|
|
Contains information on all connected devices (i.e. sonar head, GPS, MRU, Gyro/Heading, Sound Velocity sensor, etc.). Includes the device name, transfer speed, rep-rate, mounting offsets, mounting angles and data latency |
— |
|
|
Contains detected slant range, intensity value and status flags for each beam |
|
|
|
Contains values from optional sensors installed inside the sonar head (i.e. MRU, SV) |
— |
|
|
Contains values from external sensors connected to the DT100 SIR timing box (i.e. GPS, MRU, Gyro/Heading, SV) |
⚠️
|
|
|
Contains a list of sound velocity vs. depth measurements for the survey area |
— |
|
|
Contains a list of tide measurements for the survey area |
— |
|
D1P is Imagenex' own proprietary format and is not explained in detail in this document.
Database Setup
-
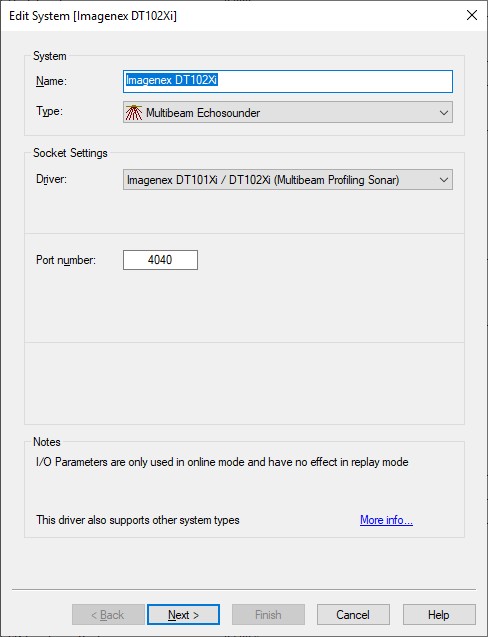
In order to decode the multibeam profiling sonar data, add to your template setup a Multibeam Echosounder system and select driver "Imagenex DT101Xi/DT102Xi Multibeam Profiling Sonar (with UTC)".
-
Fill in the correct UDP port and press Next to go to the next wizard page.
-
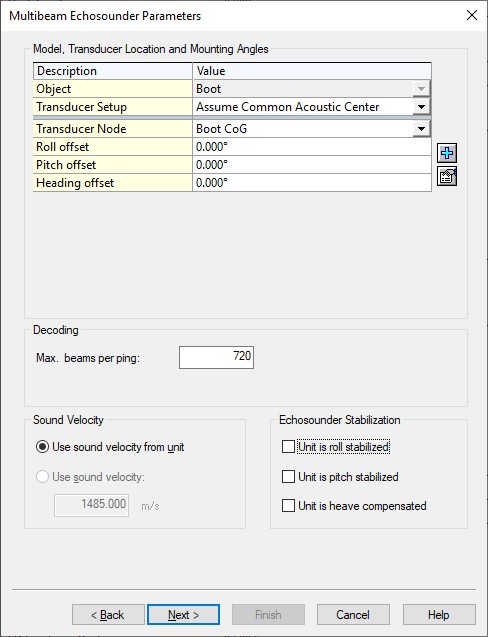
Select the correct node location for the sonar head.
-
Important are the roll, pitch and heading offset correction which should be established using a patch test (multibeam calibration) procedure.
Note that the roll offset shouldn't be corrected here for the so-called profile tilt angle which can be entered in the setup of the sonar. The driver corrects automatically for this possible profile tilt angle.
(The Profile Tilt Angle is a fixed roll angle representing the tilt angle of the bracket holding the sonar head and a typical value for this angle would be +/-30 degrees, so the sonar can “see” out towards the shoreline) -
Although the actual number of beams per ping depends on the sonar and its current settings (max. 480 for the DT101Xi and max. 720 for the DT102Xi), you should leave the Max. beams per ping value at 720.
-
It is expected that sonar data is not corrected for motion.
-
On the 3rd and last wizard page leave all settings at their defaults.
-
-
In order to decode the altitude and the sound velocity, add to your template setup an Underwater Sensor system and select driver "Imagenex DT101Xi/DT102Xi (Altitude & Sound Velocity)".
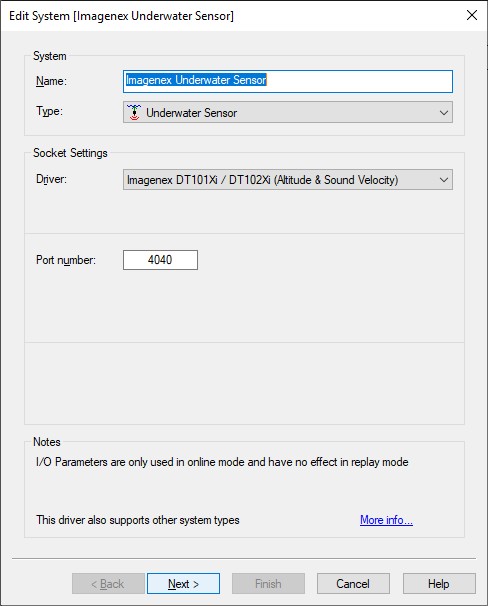
-
Fill in the same UDP port number and press Next.
-
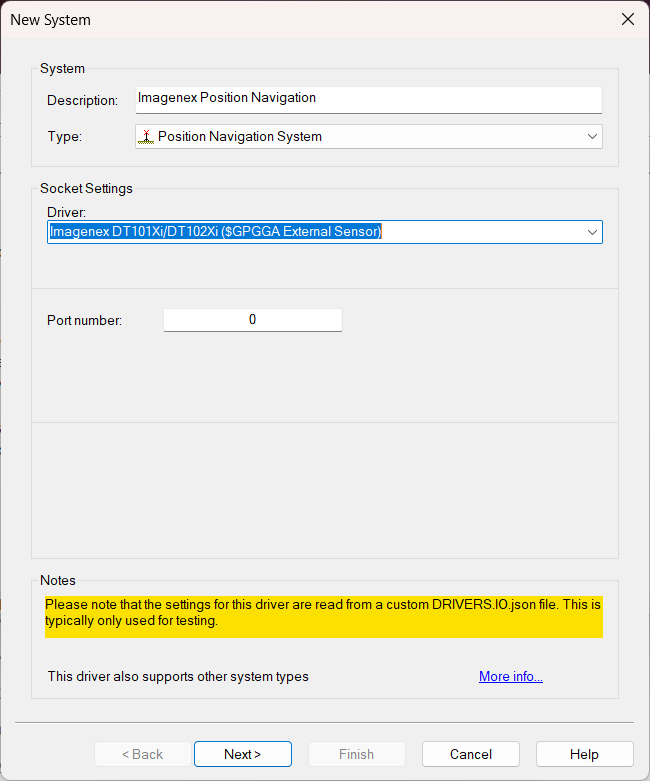
In order to decode position navigation data, add a Position Navigation system to your template setup and select driver "Imagenex DT101Xi/DT102Xi ($GPGGA External Sensor)".
-
Fill in the same UPD port number and press next
-
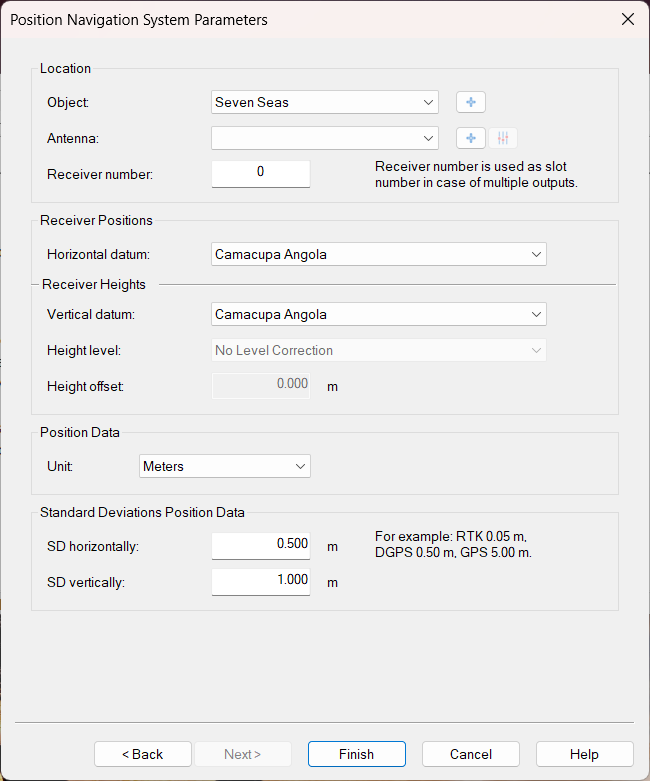
Set the antenna;
-
In case of multiple outputs, set the correct receiver number;
-
Select the horizontal datum;
-
Select the vertical datum;
-
Adjust the Unit and standard deviations if needed.
-
In order to decode time synchronization data, add a Time Synchronization system to your template setup and select driver "Imagenex DT101Xi/DT102Xi ($GPZDA External Sensor)".
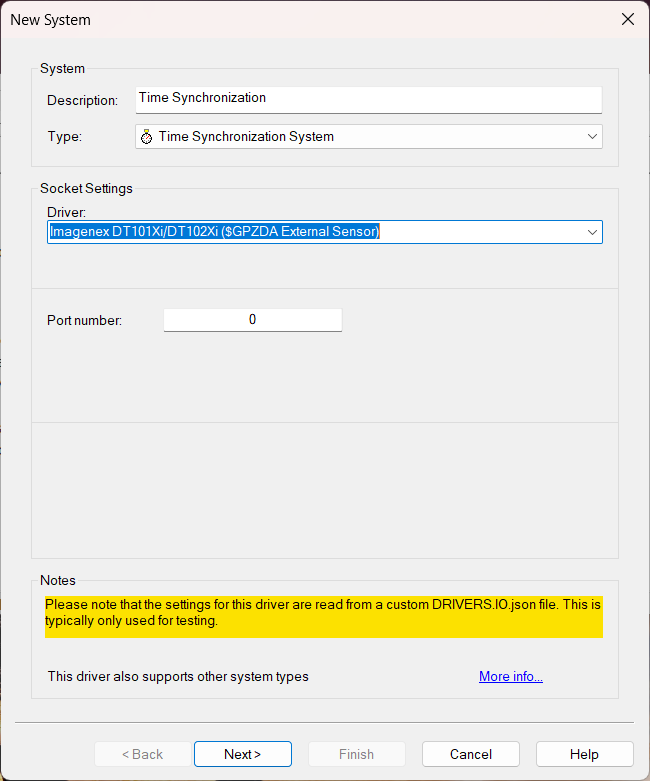
-
Fill in the same UPD port number and press next
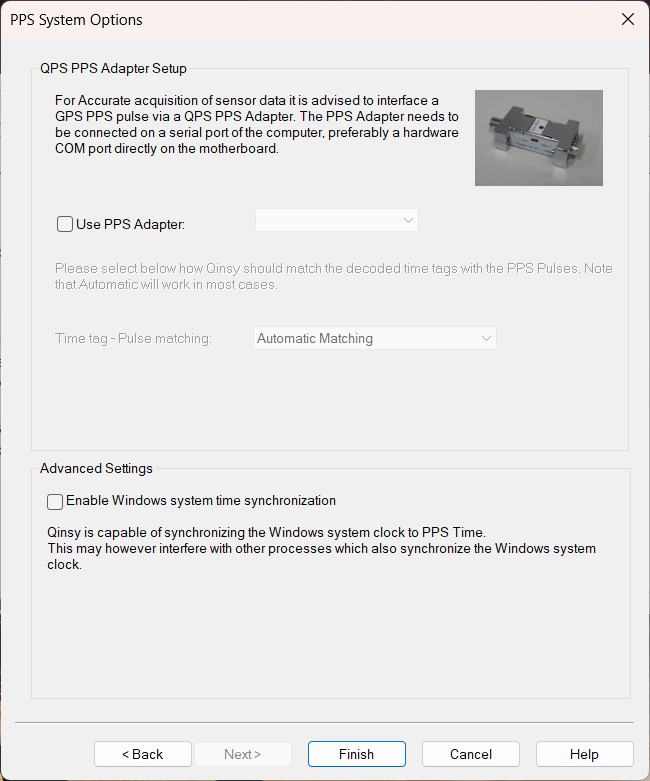
-
Check the Use PPS Adapter and select one if possible
-
In order to decode gyro compass data, add a Gyro Compass system to your template setup and select driver "Imagenex DT101Xi/DT102Xi ($HEHDT External Sensor)".
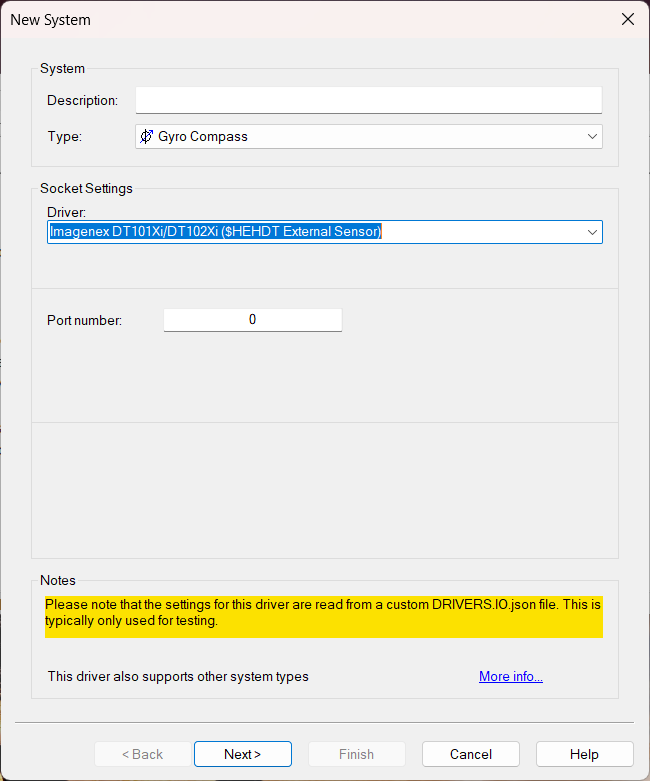
-
Fill in the same UPD port number and press next
-
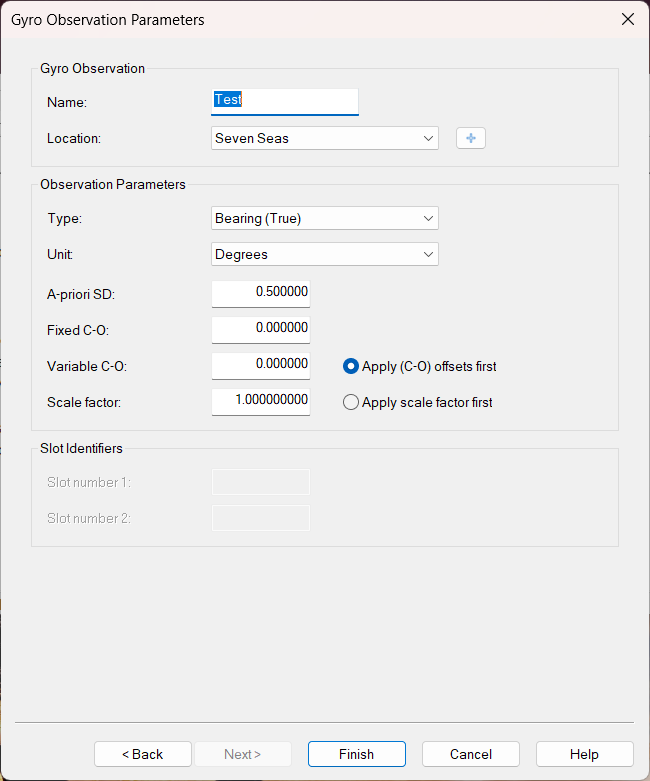
Select correct object;
-
Edit SD and C-O values where needed.
-
Preferably enter the C-O values in the system itself.
-
-
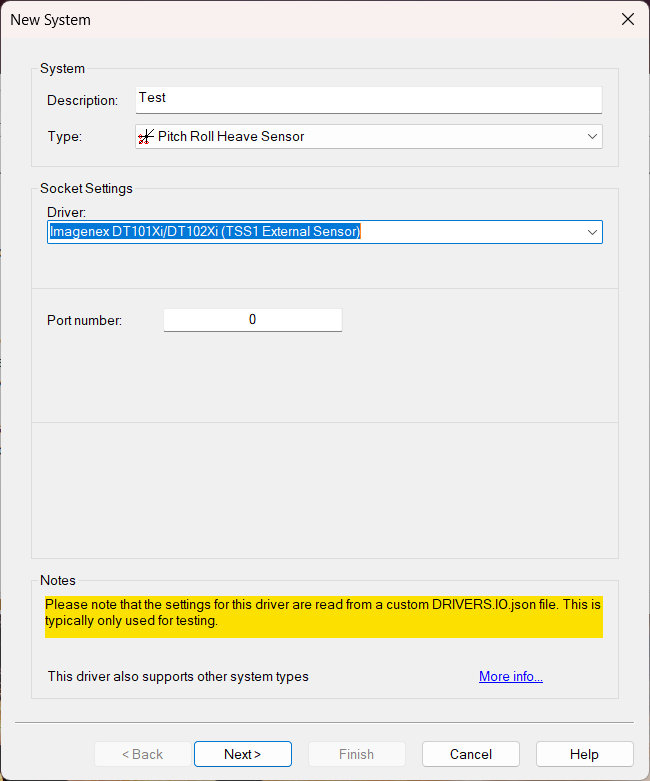
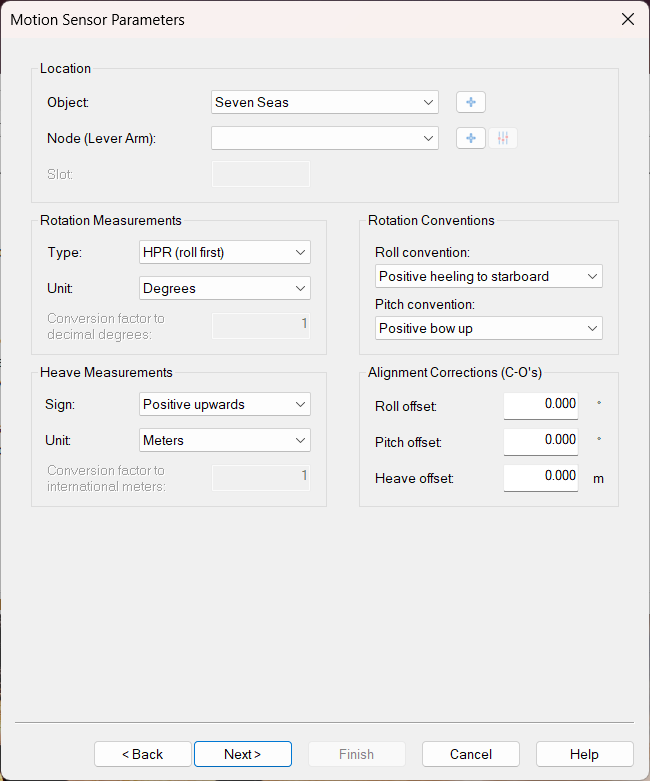
In order to decode pitch, roll, heave data, add a Pitch Roll Heave system to your template setup and select driver "Imagenex DT101Xi/DT102Xi (TSS1 External Sensor)".
-
Fill in the same UPD port number and press next
-
Select the correct lever arm for which the Heave that is decoded is valid;
-
Enter C-Os where needed.
-
Preferably enter the C-O values in the system itself.
-
-
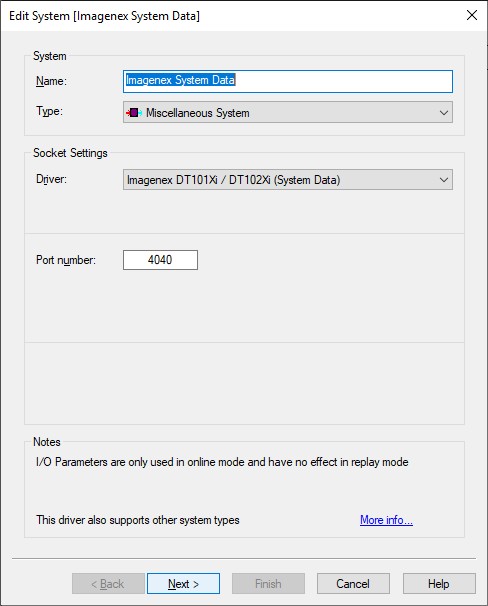
In order to decode additional information from the D1P header as generic observations, add a Miscellaneous system to your template setup and select driver "Imagenex DT101Xi/DT102Xi (System Data)".
-
Fill in the same UDP port number and press Next.
-
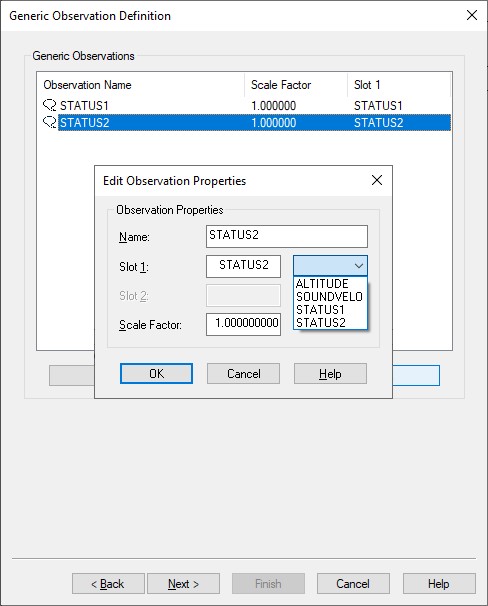
Several values from the ping header can be decoded as generic observations:
|
Name 1) |
Slot ID 2) |
Type |
|
|---|---|---|---|
|
Status Byte 1 |
STATUS1 |
integer 3) |
Is sensor available (1) or not (0):
|
|
Status Byte 2 |
STATUS2 |
integer 3) |
Is the beam data corrected (1) or not corrected (0) for:
|
|
Mode |
MODE |
integer 3) |
Combined Display Mode and Transducer Up/Down Mode: |
|
Altitude |
ALT |
float |
Same value as the range of the nadir beam |
|
Sound Velocity |
SV |
float |
Sv at the head, used for the range calculation for each beam |
-
The name can be any free text, with a maximum of 16 characters.
-
Use the exact case-sensitive Slot ID as listed in the table.
-
Decimal representation of bit-wise flags. For example when the STATUS1 decimal value is 12 then the binary representation is 00001100.
This means that bit 0 and bit 1 are zero and bit 2 and bit 3 are one which means external sensors and svp are available.
Online
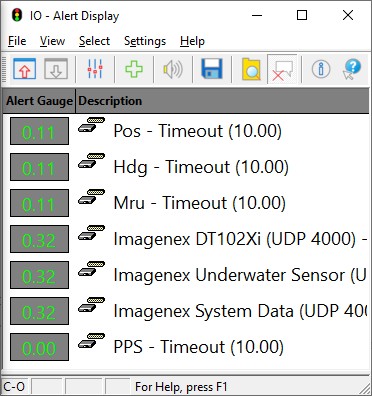
The driver has no user-interface, so you will need to use the I/O Alert Display and the Raw Multibeam Display to see if data is received and decoded.
Alert Display
Use this display to see if data is coming in at the I/O port.
Raw Multibeam Display
Use this display to visualize the raw incoming multibeam data.
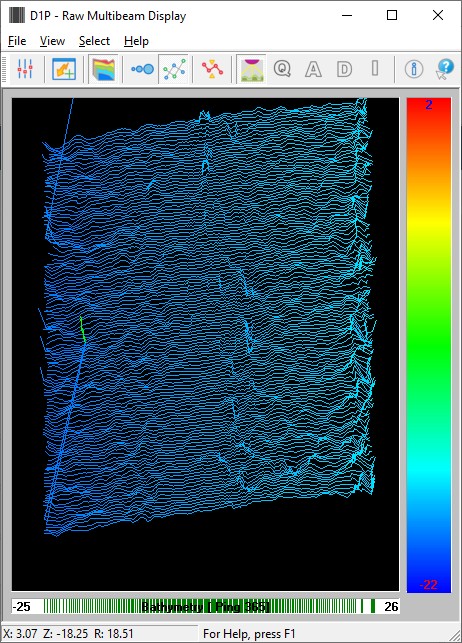
Data is uncorrected for motion so any movement of the vessel will be quite clear. The display is a good indication of:
-
whether data is coming in
-
what the approximately swath width is
-
the approximate depth below transducer
Swath System Display
Use this display to visualize the calculated DTM results.
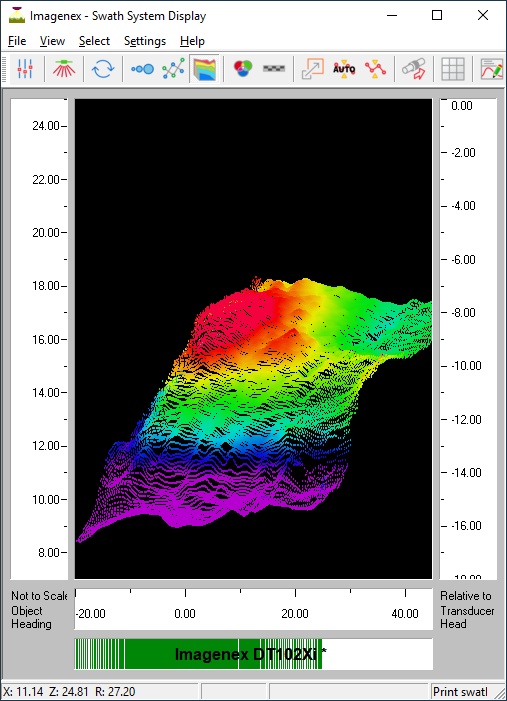
Data is fully corrected for motion and sound velocity.
3D Point Cloud Display
Use this display to visualize the calculated DTM results in a 3D environment.
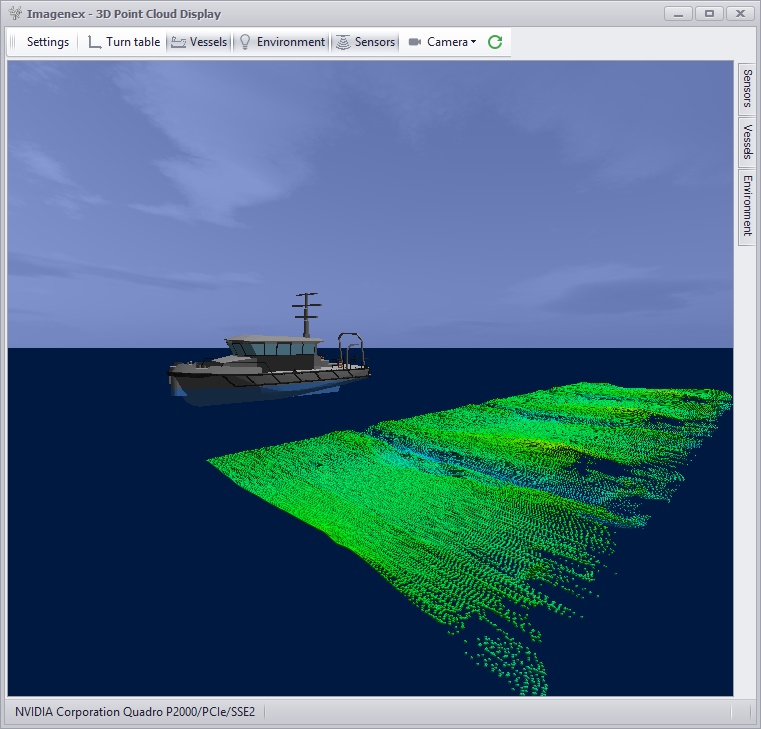
Data is fully corrected for motion and sound velocity.
Generic Display
Use a generic display to show additional values decoded from each ping header:
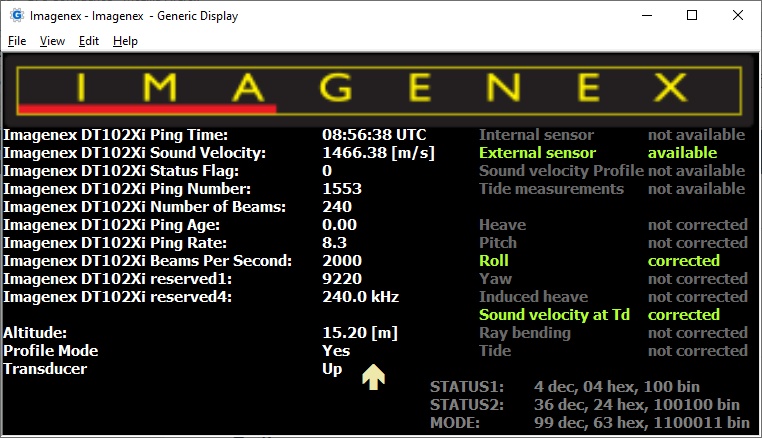
Note that the reported altitude value is the same as the nadir beam range.
You may use the attached Imagenex.xml file as example: copy the layout (Use 'Save Link As...') to your current Project's Settings\Display folder and open it using a new Generic Display.
You only need to select the correct multibeam echosounder system and observation systems as defined in your template setup.
Additional info
Decoding position, motion and/or heading from the external sensor data which is part of the data stream (message section 5) might be useful for a one-cable-setup situation although it also has some limitations and disadvantages. The current Qinsy version does not allow you to decode it as it has not been tested yet.
Please contact QPS Support about the possibility we can offer in order to decode the external sensor data.