
Description
Driver to decode the Acoustic Data packet stream from CEESCOPE™ Hydrographic survey systems from manufacturer CEE HydroSystems.
The following data can be decoded and stored from the Acoustic Data packet stream:
-
Depth (from both high and low frequency channels)
-
Full water column (up to 3200 raw acoustic samples per channel per ping)
Note that full water column data is only available via the network interface. -
Motion data (pitch, roll and heave, if available)
-
Tide (if available)
-
Optionally Position Data
This additional data stream contains the NMEA messages from the internal or external GNSS receiver.
See the Database Setup for more information.
Driver Information
|
Driver |
CEESCOPE (Depth H/L Frequency)
|
Interface Type |
Serial / UDP |
Driver Class Type |
Counted |
|---|---|---|---|---|---|
|
Yes |
Input / Output |
Input |
Executable |
DrvQpsCounted.exe
|
|
|
Related Systems |
|
||||
|
Related Pages |
|||||
Decoding Notes
-
There are two versions of this driver, a serial one and a network UDP version. Decoding is the same for both, except for the full water column data: this is not part of the serial data output.
Interfacing using UDP network is therefore preferred. It is advisable to use a fast network card (at least 100 Mbit), especially when including the raw acoustic samples in the data stream. -
The serial interfacing is only recommended when using one of the emulated data output formats (Deso25, NMEA DBS, Odom DBT, etc.). These emulated formats are not described in this document.
-
Port 1235 is used to output the Acoustic Data packets.
-
Port 1234 is used to output Position Data.
-
The depth value from the Acoustic Data packet is corrected for a possible draft and/or index offset value by the CEESCOPE unit.
Note that the driver will undo the draft correction.
So the water depth in Qinsy will be between transducer and seabed (i.e. measured depth).
Further, the draft, heave and index offset values are part of the message and can be decoded individually. -
The CEESCOPE Acoustic Data packet contains a timestamp. Its source should be based on the internal or external GNSS/PPS connected to the CEESCOPE unit.
This time stamp will be used when you select the so-called 'UTC' drivers, i.c.w. with a valid Time Synchronization System being present in your template setup. -
The CEESCOPE Acoustic Data packet format is based on the legacy Odom CV3/MK3 Acoustic Data packet but differs a little bit. This driver will automatically detect/decode the correct format.
-
The driver does not send any data or commands to the CEESCOPE system.
-
On the CEESCOPE unit you can set certain settings that may affect the reported depth value: the sound velocity, a possible draft, a possible index offset and the unit (meters or feet).
All this information is included in the message and will be decoded and used by the Qinsy driver.
Database Setup
-
In order to decode the measured depth: add a Singlebeam Echosounder system to your template setup and select the correct driver.
When using a network interface: "Network - CEESCOPE Depth (High/Low Frequency) (UTC)" or "Network - CEESCOPE Depth (High/Low Frequency)".
When using the serial I/O interface: "CEESCOPE Depth (High/Low Frequency) (UTC)" or "CEESCOPE Depth (High/Low Frequency)"The "...(UTC)" variant indicates the 'UTC' driver which means that the time from the decoded message will be used for time stamping. When using the non-UTC driver the time of arrival (at the I/O port) will be used.
The 'UTC' driver has only effect when your Qinsy setup also contains a valid and working Time Synchronization (PPS) system.
Fill in the correct serial I/O parameters or UDP port 1235 and press Next to go to the next wizard page.
For both frequency channels, add a Transducer: each one with its unique Slot Id.
The selected node for each transducer should be the actual transducer location, and therefore the same for both:
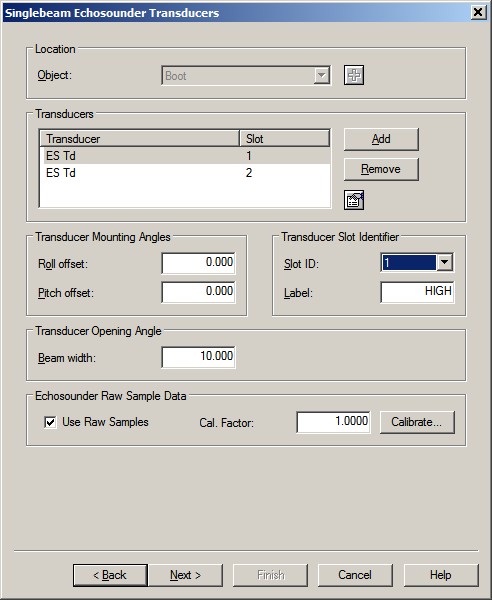
-- Slot Id for the High frequency depth must be 1.
-- Slot Id for the Low frequency depth must be 2.
-- The label can be any free text, with a maximum of 10 characters.
Info
As already mentioned under the Decoding Notes:
The depth value from the Acoustic Data packet is corrected for a possible draft and/or index offset value by the CEESCOPE unit.
The driver will undo the draft correction.
So the water depth in Qinsy will be between transducer and seabed (measured depth).
The draft, heave and index offset values are part of the message and can be decoded individually.
-
The driver will automatically recognize if data has been reported in meters or in feet. Note that CEESCOPE always reports data in meters.
-
In order to decode the raw acoustic samples (water column data) from each channel, select (or highlight) the relevant Transducer and enable the 'Use Raw Samples' checkbox. Leave the Cal.Factor on 1.0, it is not used.
Note that the raw acoustic samples are not part of the serial data output, only when using the network driver.
If you are not interested in the water column data (or e.g. only for one channel), you may leave the 'Use Raw Samples' checkbox unchecked because the recorded databases will grow in size.
Note that the raw acoustics samples are always stored during recording, when this checkbox is checked. -
In order to decode the tide value, add to your template setup a Tide Gauge system and select driver "Network - CEESCOPE Tide", or "CEESCOPE Tide" for the serial variant.
Fill in the correct serial I/O parameters or UDP port 1235 and press Next to go to the next wizard page.
The decoded tide observation needs to be connected to a tide station, so you have to add a fixed node, representing the location where the tide value has been measured. -
In order to decode the draft value, add to your template setup an Underwater Sensor system and select driver "Network - CEESCOPE Draft", or "CEESCOPE Draft" for the serial variant.
Fill in the correct serial I/O parameters or UDP port 1235 and press Next to go to the next wizard page:
Add only one observation type: 'Draft' and make sure to set the location 'At' Node to the reference node of the object. -
In order to decode the motion, add to your template setup a Pitch Roll Heave Sensor system and select driver "Network - CEESCOPE R-P-H", or "CEESCOPE R-P-H" for the serial variant.
Fill in the correct serial I/O parameters or UDP port 1235 and press Next to go to the next wizard page. -
In order to decode miscellaneous settings (these values are part of the Acoustic Data packet), add a Miscellaneous system to your template setup and select driver "Network - CEESCOPE Settings", or "CEESCOPE Settings" for the serial variant.
Fill in the correct serial I/O parameters or UDP port 1235 and press Next to go to the next wizard page.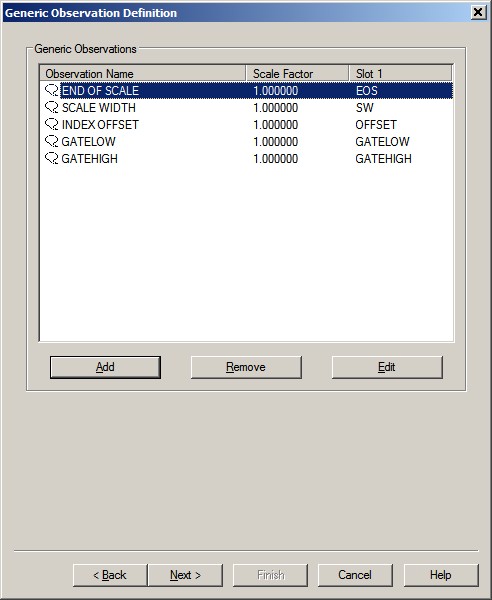
-- Slot Id for the used scale width value must be SW
-- Slot Id for the used end of scale value must be EOS
-- Slot Id for the used index offset value must be OFFSET
-- Slot Id for the used gate low value must be GATELOW
-- Slot Id for the used gate high value must be GATEHIGH
-- The Observation name can be any free text, with a maximum of 16 characters. -
In order to decode the Position Data coming from the internal or external GNSS receiver connected to the CEESCOPE unit, add a Position Navigation system to your template setup and select driver "Network - NMEA Position and Heading (Checksum)", or "NMEA Position and Heading (Checksum)" for the serial variant.
Note that setting 'Acquired by' appears when selecting this particular driver.
Select from the available list: "CEE HydroSystems CEESCOPE POS (Time Tagged)".
Setting 'Observation time from' also appears, but is disabled.
The default selected value should be: "Decoded from data (PPS)".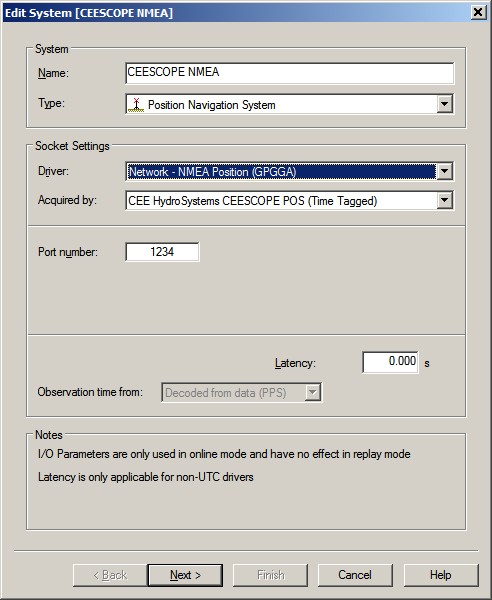
What happens is that all original NMEA messages (e.g. GGA, GST, VTG) from the GNSS receiver are automatically redirected to UDP port 1234, but encapsulated with an ASCII header and local timestamp.
The driver will strip off this header, so it can decode the NMEA messages. The local timestamp from the encapsulated header is not used.
The time field from the GGA message will be used in case your template setup has a valid Time Synchronization system.
Fill in the correct serial I/O parameters or UDP port 1234 and press Next to go to the next wizard page to make the right antenna location selection.
Online
The driver has no user-interface so you should use the various displays to see if data is received and decoded.
Use the Controller's Refraction settings if you wish to improve the reported depth with a better sound velocity.
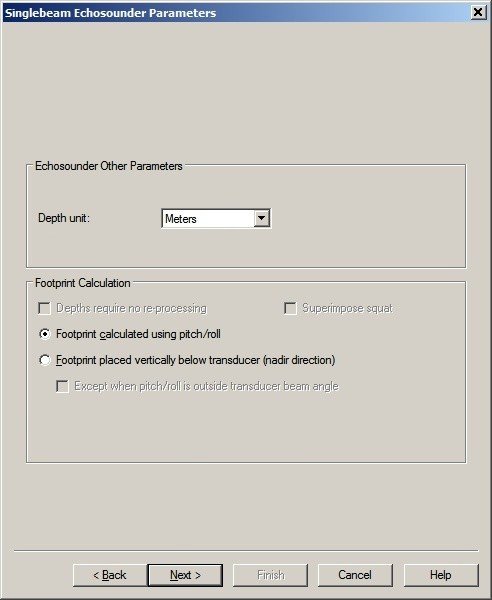
The Sound velocity mode can be found in the Controller's Echosounder Settings:
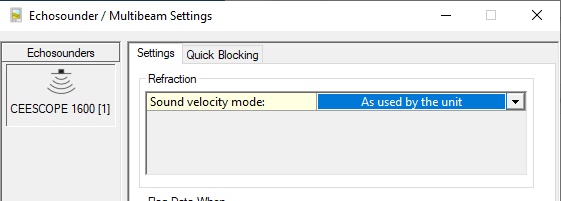
Here you may overrule the default sound velocity as used by the echosounder unit in order to improve the measured depth with a better sound velocity.
-
As used by the unit (default)
Qinsy will use the decoded depth value as reported by the unit.
Use this mode when you're confident that the used sound velocity is accurate enough for your survey specifications. -
From calibrated sound velocity
Use this mode when the echosounder unit is using a default/wrong/out-dated sound velocity and from your own measurement/calibration you have determined a better sound velocity value. -
From velocity profile (recommended)
Use this mode when your setup has an up-to-date sound velocity profile for your survey area.
This mode is recommended because ray-tracing will be used for the entire water-column instead of one fixed sound velocity value. -
From velocity observation
Use this mode when the echosounder unit is using a default/wrong/out-dated sound velocity and you have a sensor defined in your setup that measures in real-time an accurate sound velocity value.
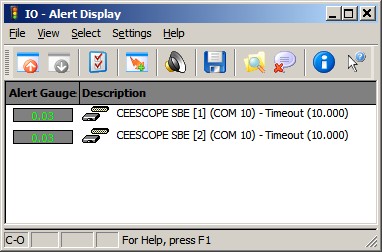
Alert Display
Use an Alert Display to see if data is coming in at the I/O port:
Observation Physics Display
The decoded data can be displayed using an Observation Physics Display:
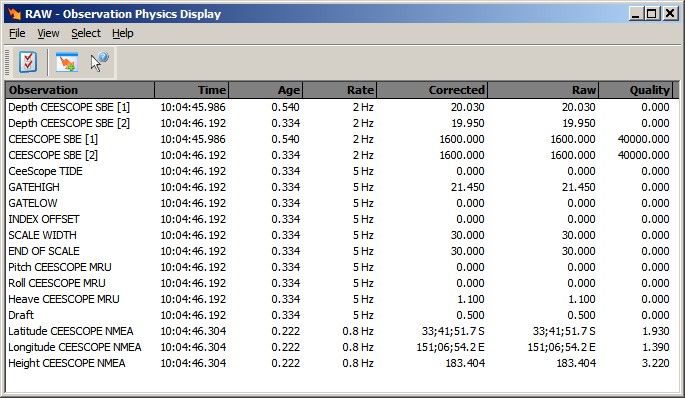
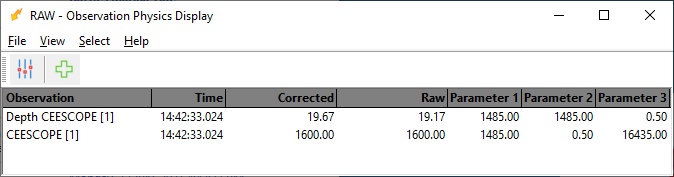
Use View Properties to enable three additional columns to monitor extra information from this system:
-
Extra Column 1 will show you the used sound velocity as reported by the unit and decoded by the driver.
-
Extra Column 2 will either show you the calibrated sound velocity, or the selected velocity observation, or the mean sound velocity from the velocity profile. So this value depends on the Sound velocity mode as defined in the Controller's Echosounder Settings.
-
Extra Column 3 will show the used draft value as reported by the unit.
The difference between the depth value in the Raw and Corrected Column is as follows:
-
Raw Column: the measured depth (i.e. depth below transducer) as reported by the unit and uncorrected for a possible draft.
-
Corrected Column: the reported depth corrected for draft and sound velocity, which depends on the Sound velocity mode as defined in the Controller's Echosounder Settings.
Generic Display
You may also use a Generic Display to show the same values as can be seen using an Observation Physics Display, however, with this display you are more flexible to use your own layout, font size and color:
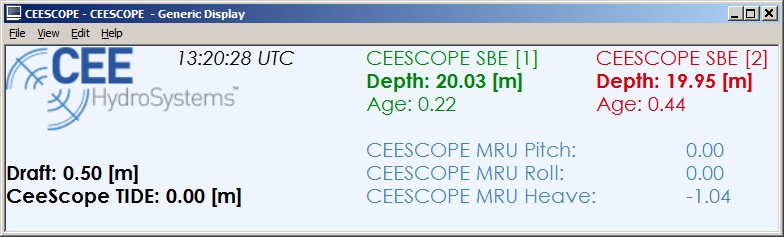
The depth value depends on the Apply C-O property:
-
No
The measured depth (i.e. depth below transducer) as reported by the unit and uncorrected for a possible draft.
Same value as seen in an Observation Physics Display Raw column. -
Yes
The reported depth corrected for draft and sound velocity as defined in the Controller's Echosounder Refraction settings.
So the value depends on the selected Sound velocity mode.
Same value as seen in an Observation Physics Display Corrected column.
You can also use a Generic Display to show the decoded index offset value. Note that the Index (or index offset, or also known as constant k, initial delay or electronic delay) is a fixed offset which depends on the transducer hardware being used and should be determined by a calibration procedure.
You can not correct or un-correct for such an offset in Qinsy. Qinsy assumes that the 'measured' depth will always include the index offset.
Echosounder Display
The decoded depth and raw acoustic samples (a.k.a. water-column) can be visualized using an Echosounder Display:
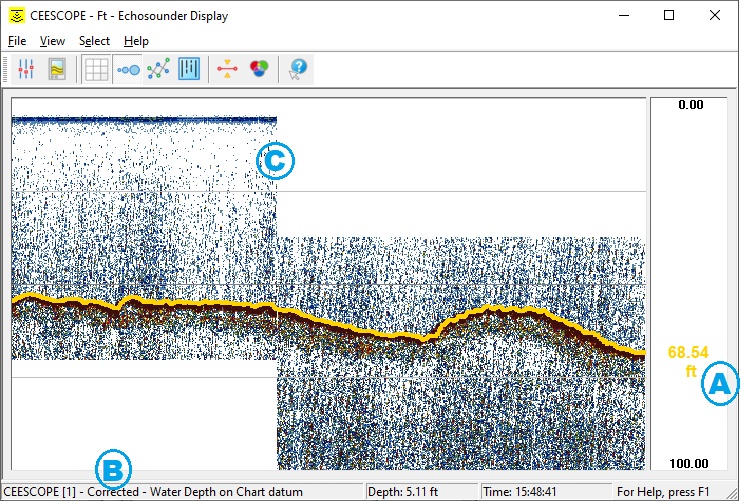
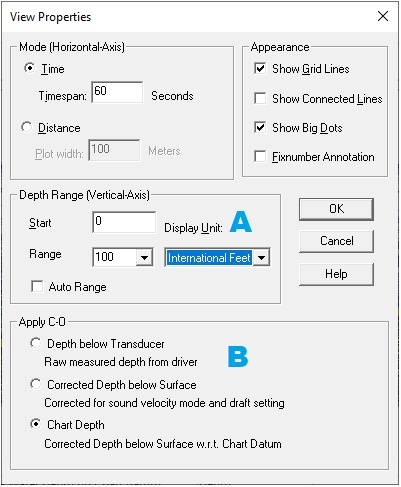
Use the View Properties to change important view settings like A) the unit (meter or feet) or B) the depth value corrected for draft or not.
The displayed depth observation will depend on the refraction settings as defined in the Controller.
B)
Apply C-O
-
Depth below Transducer
The measured depth (i.e. depth below transducer) as reported by the unit and possibly uncorrected for the transducer draft. -
Corrected Depth below Surface
The reported depth corrected for transducer draft and sound velocity as defined in the Controller's Refraction settings. -
Chart Depth
The Corrected Depth below Surface compared to Chart Datum.
C)
Use the System Properties dialog to show the raw sample data.
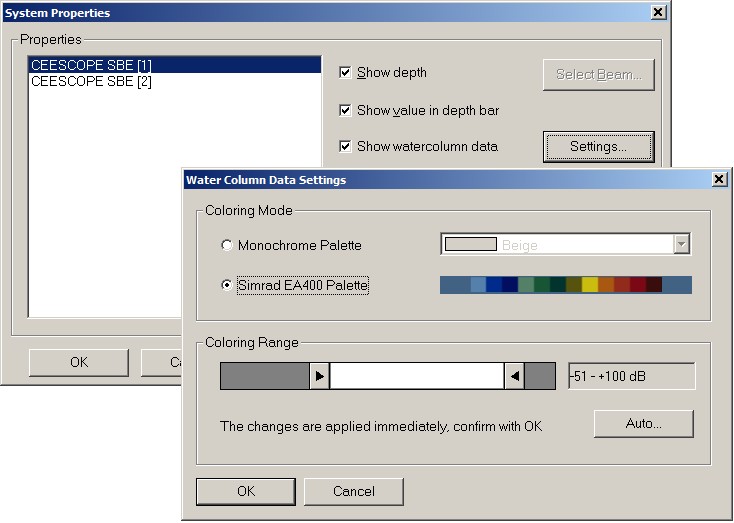
Note that the 'jump' in the raw sample data in the example above is caused by changing the 'End of Scale' setting on the echosounder unit due to approaching a deeper area.