
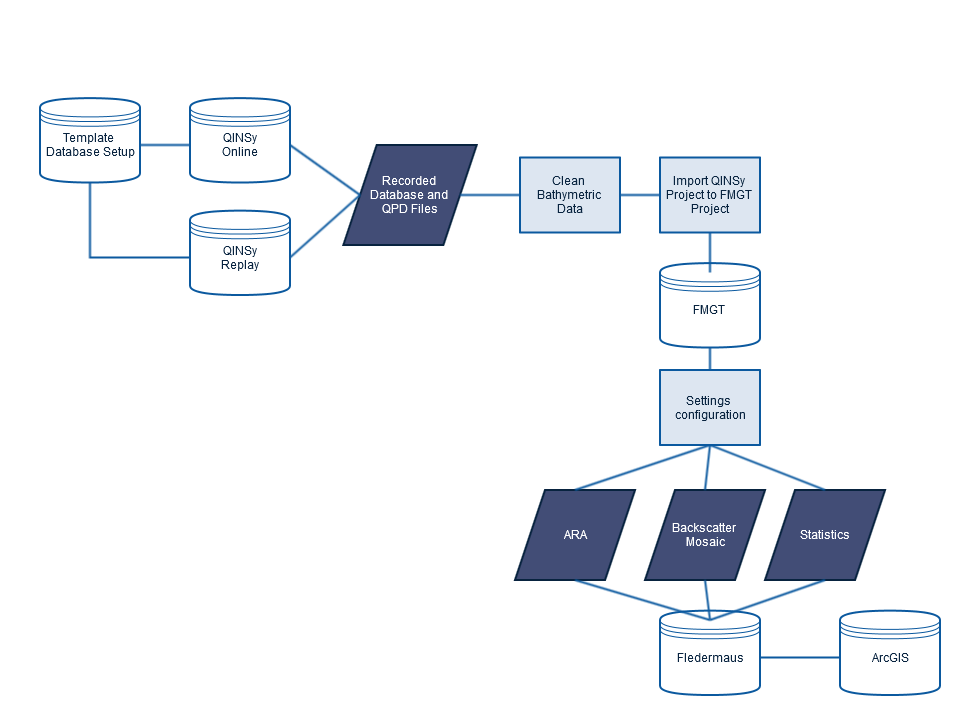
This document describes the intended workflow for processing Backscatter data using Qinsy Survey Manager and Fledermaus FMGT.
To be able to use the seamless Qinsy-Fledermaus workflow, you need the following:
-
Qinsy version 8.10.2014.03.26.1 or newer
-
Fledermaus 7.4.0 or newer, Windows 32-bit or Windows 64-bit version
-
A valid license for both Qinsy and Fledermaus. They can be on separate dongles, or a Fledermaus license can be added to the (purple) Qinsy dongle
Table of contents:
Workflow Diagram
Step-by-step guide
Before Surveying
When creating your Qinsy Database you need to ensure that for whichever multibeam sonar you are using the Raw Bathymetry and the Raw Seabed Image Storage data is being collected.
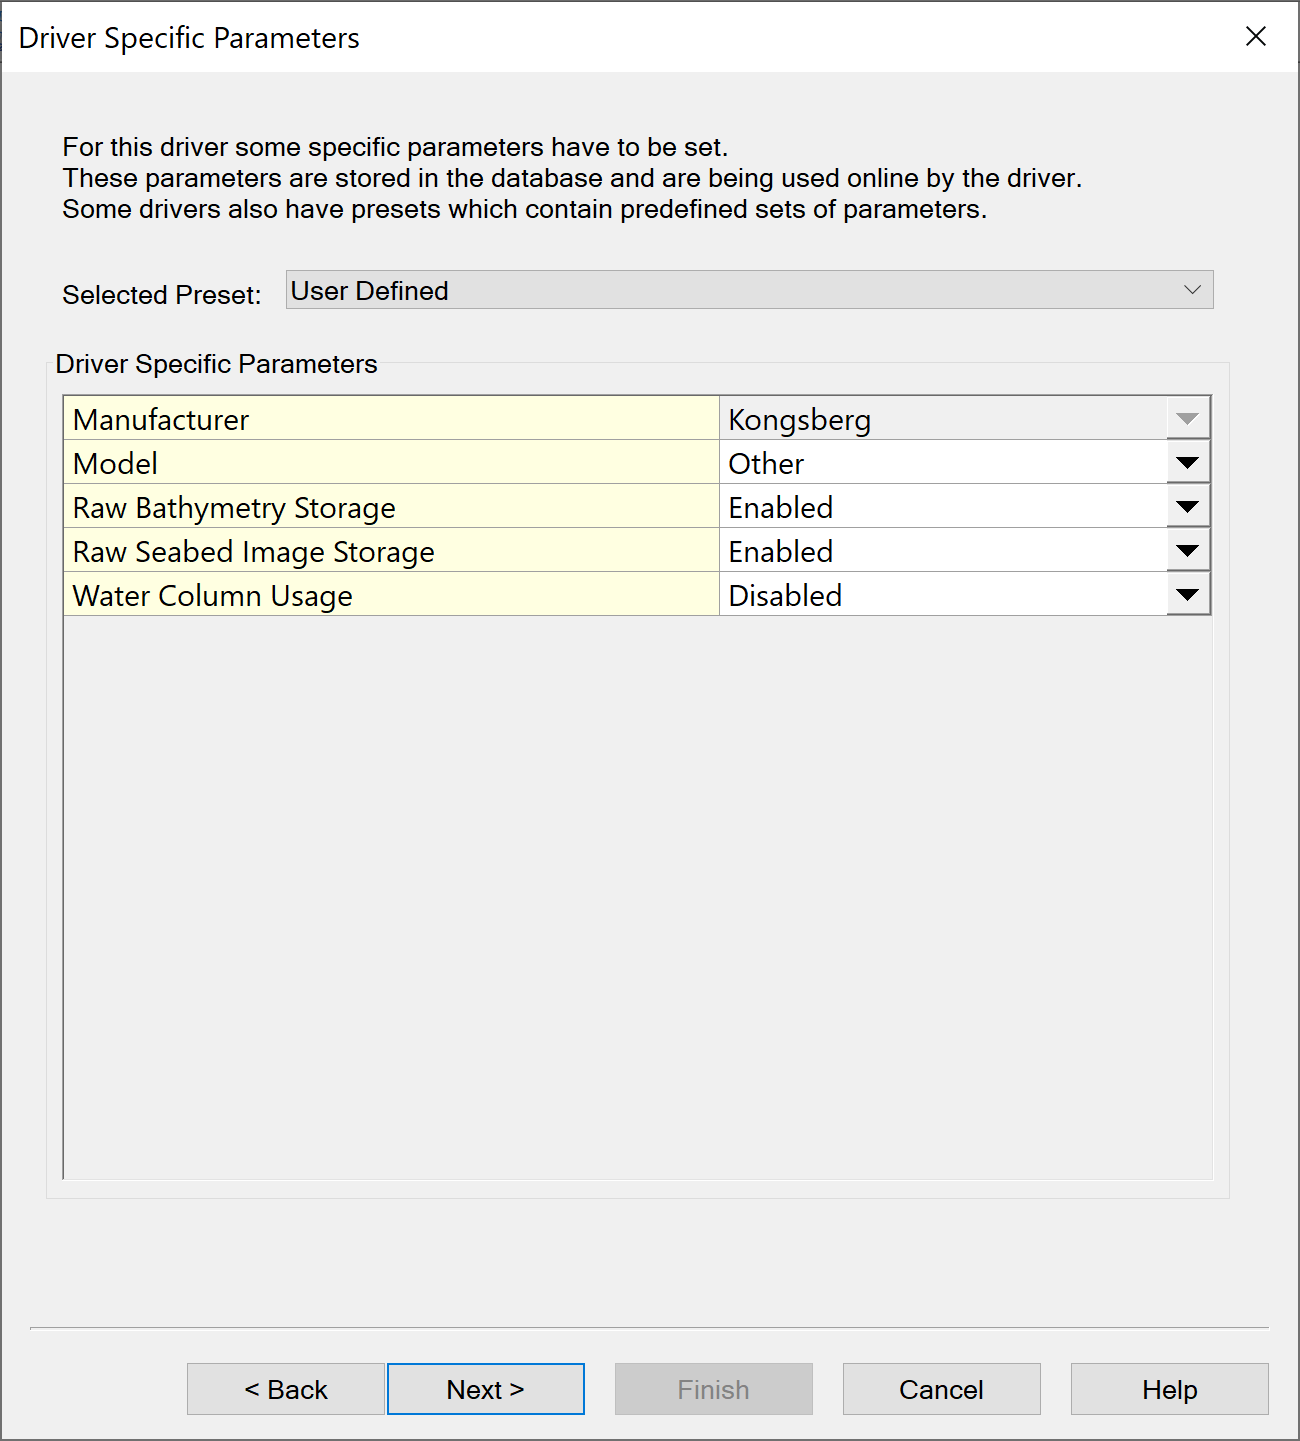
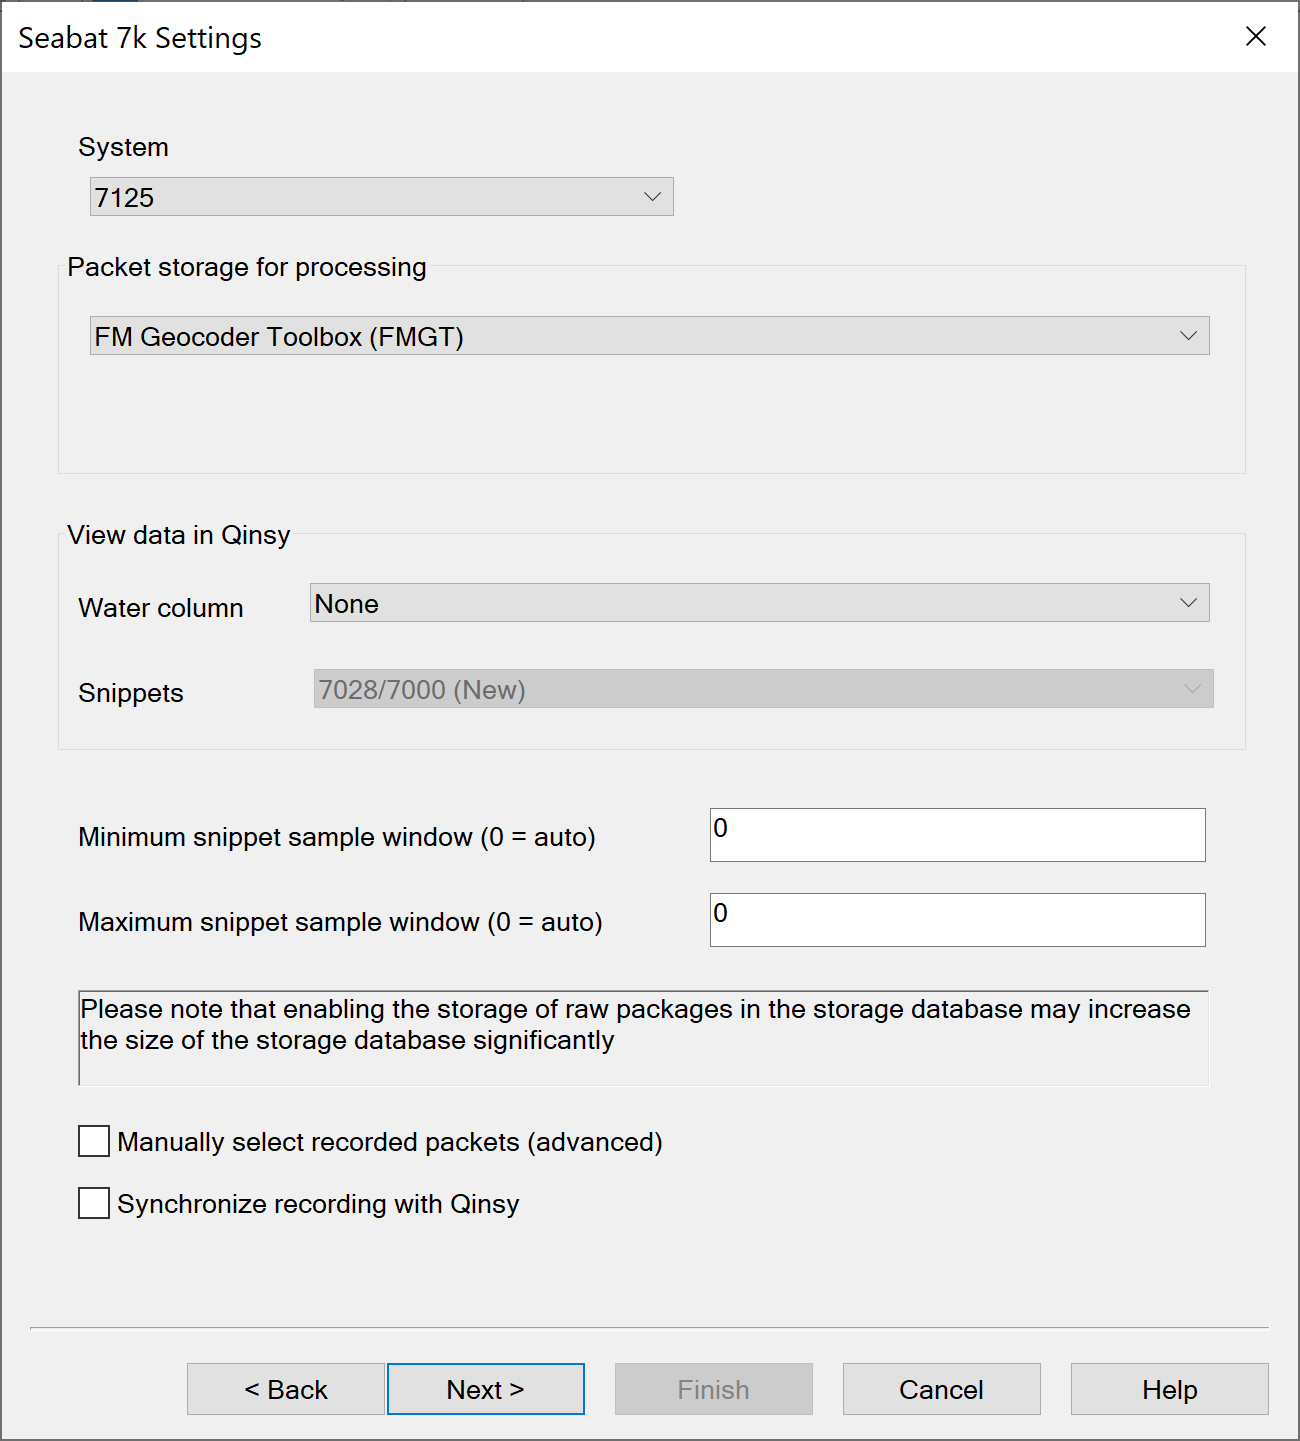
The above image is the representation for the Kongsberg EM Series of drivers. Below is the setup for the Reson 7K setup.
-
To progress you need both the recorded DB files and the QPD files. To make sure you have the correct set-up for your Multibeam Echosounder and the rest of your system please see the QPS Drivers Manual
-
When Online ensure that everything is being collected correctly. For more information about online recording see here... Qinsy Online and here.... 2022-06-02_11-50-21_How-to Raw Bathymetry and Imagery Data (Summary) Not open to clients
-
If using Replay to create QPD files after finishing online operations see here for more information... Qinsy Replay
Processing Data
Once you have collected your data ideally it will be cleaned before progressing to FMGT. For the procedure for this operation please see Qinsy - Fledermaus Workflow Bathymetry Processing
-
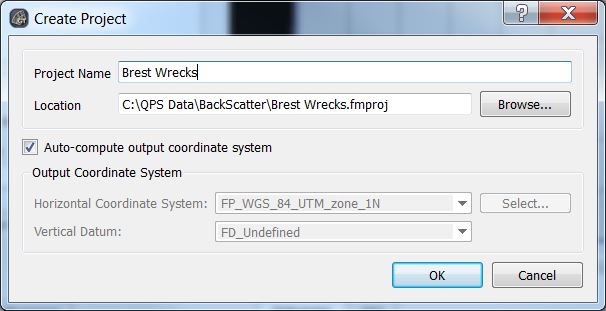
Launch FMGT using the icon

. Create a New Project setting the output co-ordinate system (needs to be a Projected system and only needs to be set if required system is not WGS_84_UTM_zone)
-
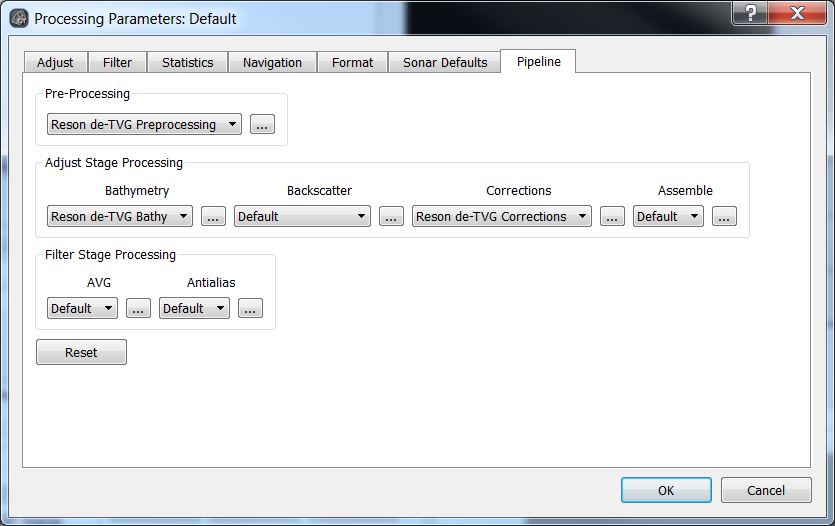
Depending on the Sonar you are using (RESON 7125 and 7111) set up the plugins that need to be used Settings>Processing Parameters>Edit default in the Pipeline tab.
The following two steps can be skipped if using a Kongsberg sonar
The reason for this step when using a RESON system is because the RESON TVG curve is not correctly implemented in Geocoder.
If you forget to set the Configuration Parameters to the TVG Plugin for a RESON system, the backscatter may be outside of the calibrated sonar filter range.
FMGT will give you a warning when trying to create a mosaic if this is the case.
-
If known the Reson de-TVG Correction stage should also be set to ensure that the correct absorption value is used. Click
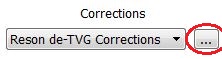
to launch the absorption window.
The following link is to the National Physical laboratory's Calculation of Absorption in Seawater which should help with obtaining the correct value... National Physical Laboratory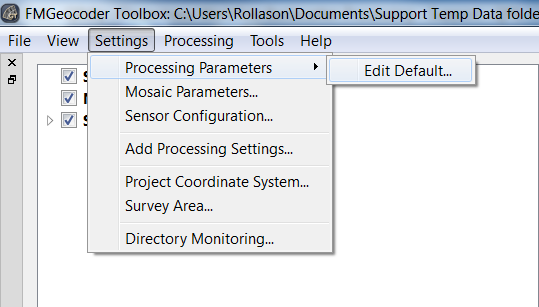
-
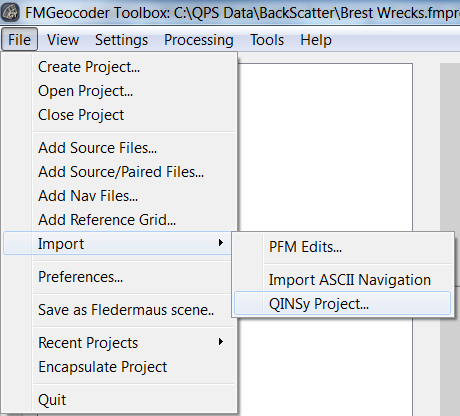
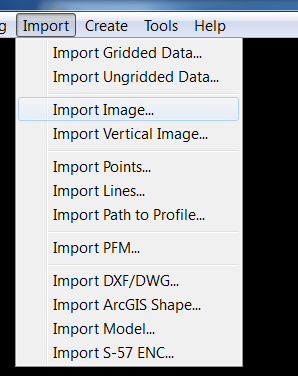
Using the File Menu Select Import and choose Qinsy Project. FMGT will select all the data in the project.
-
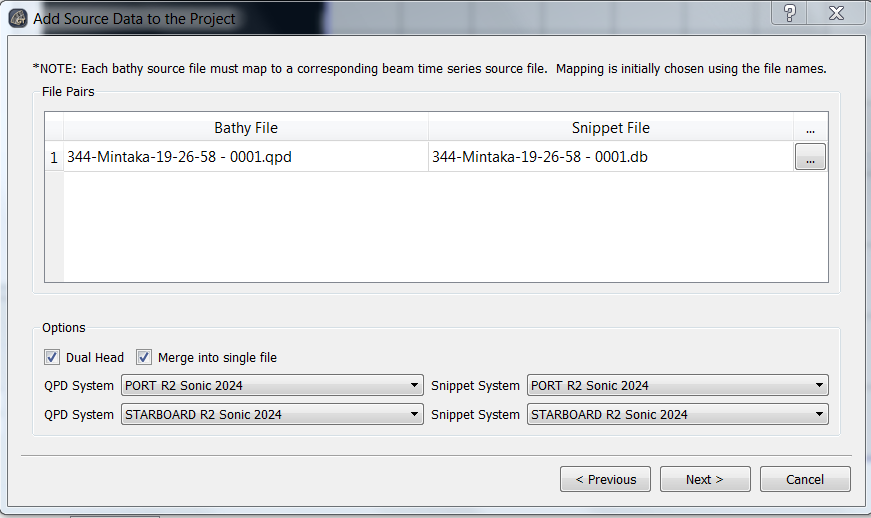
Ensure the pairs are correct and select if your system is dual headed or not. I
f working with dual head sonars you have the option to combine both heads into a single GSF file which is the default, this is the preferred method for systems that ping synchronously.
If alternatively you import data into separate GSF files (i.e. port into GSF file #1 and stbd into GSF file #2), you will need to set two configurations; one for each sonar head.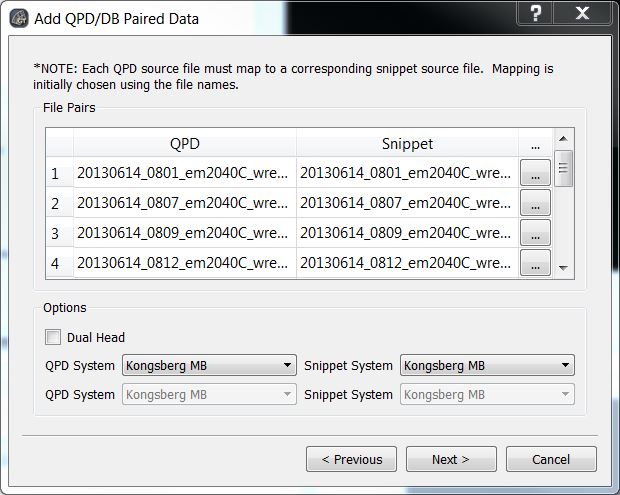
-
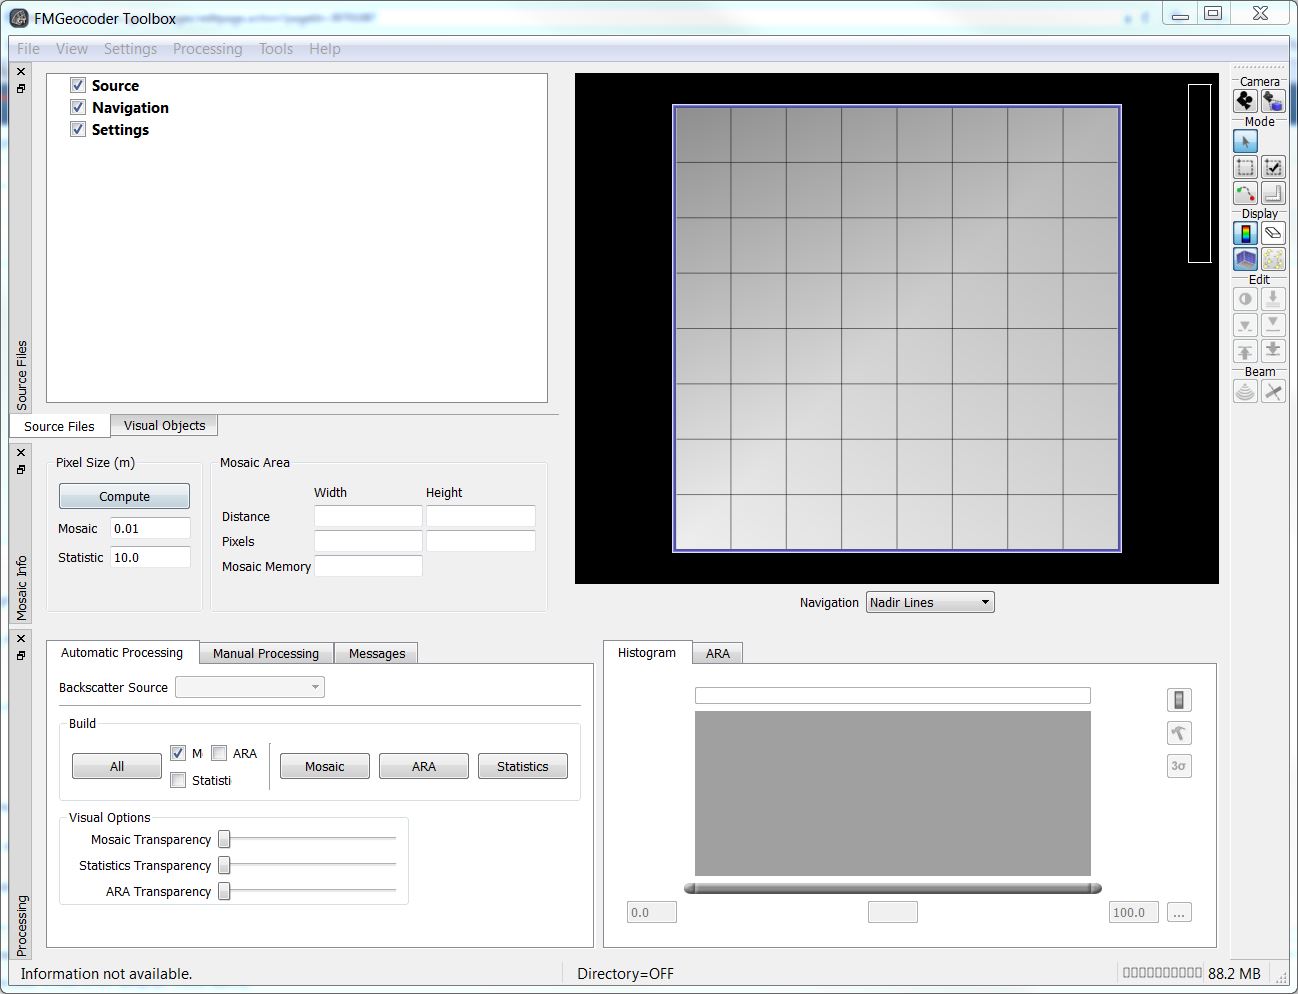
Check that the cell size and statistics cell size are appropriate for the computer and the resolution you require.
If the Mosaic memory turns red the mosaic is too large for your computer's memory and the Mosaic Pixel size will either need to be increased or the area will need to be Tiled (see manual processing)
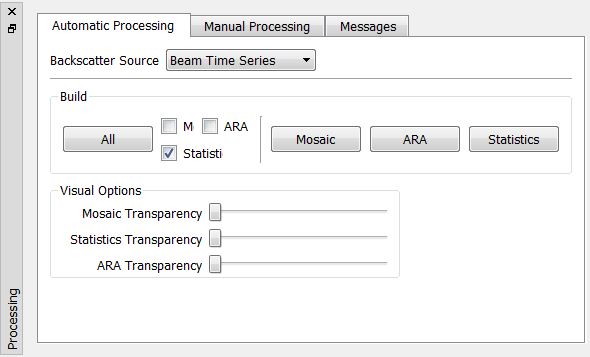
Automatic Processing
-
Use the Automatic Processing window to build the layers you require, either using the tick box to build all layers or building each layer separately.
-
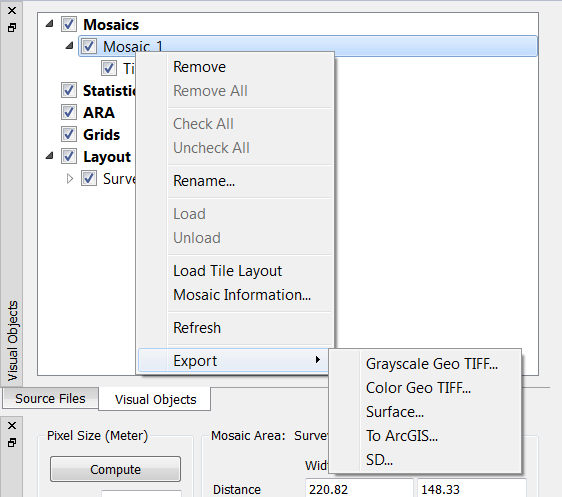
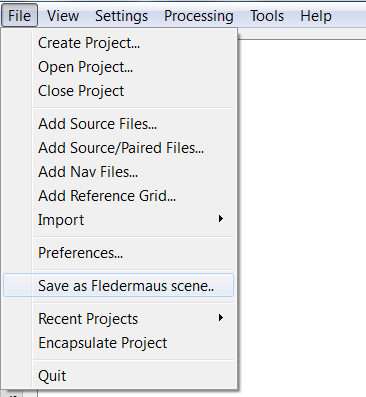
On the Visual Objects Tab Click the layers you want to export and Export>GeoTif etc OR use File>Save as Fledermaus Scene
-
To Export as an ArcGIS compatible product use the To ArcGIS Option
-
Load into Fledermaus. For Tiff Images use the Import>Image option and select the dataset. For SD Files use File>Open Data Object/Scene
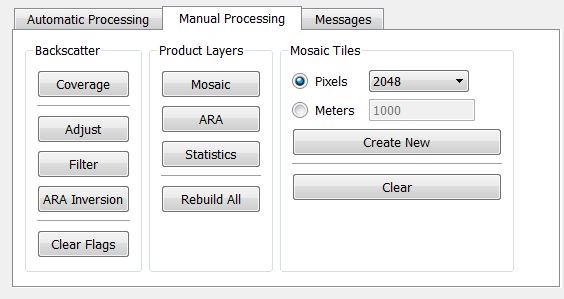
Manual Processing
The Manual Processing window allows you to step through the procedures that FMGT does automatically when importing files.
It also means if you make any changes during the processing that you can recalculate the steps you need.
-
If your data is too large to process at once you can create a series of tiles across your data. Set the mosaic type, the size and click Create New. You will then see that your display window has been split into a grid.
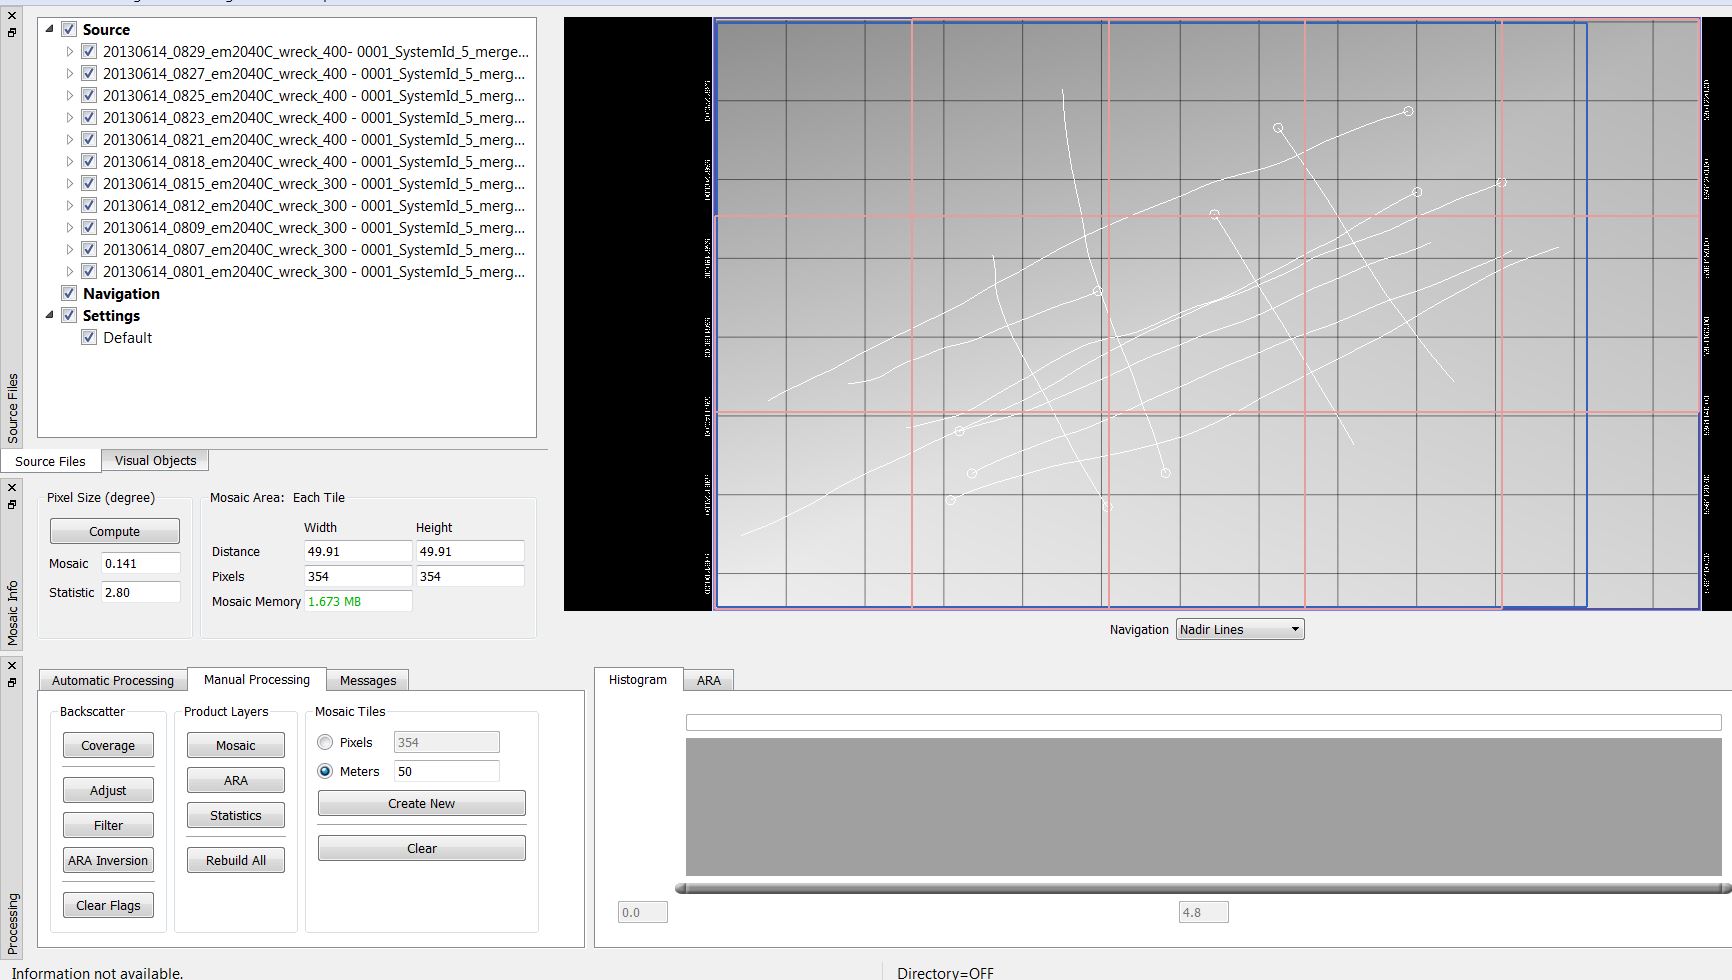
The Image above shows the grid split into 50m tiles.
-
You can then use Product Layer buttons to create your mosaic, statistics and ARA which will be split into the tiles.
You will notice when you tile your data that the mosaic memory will shrink.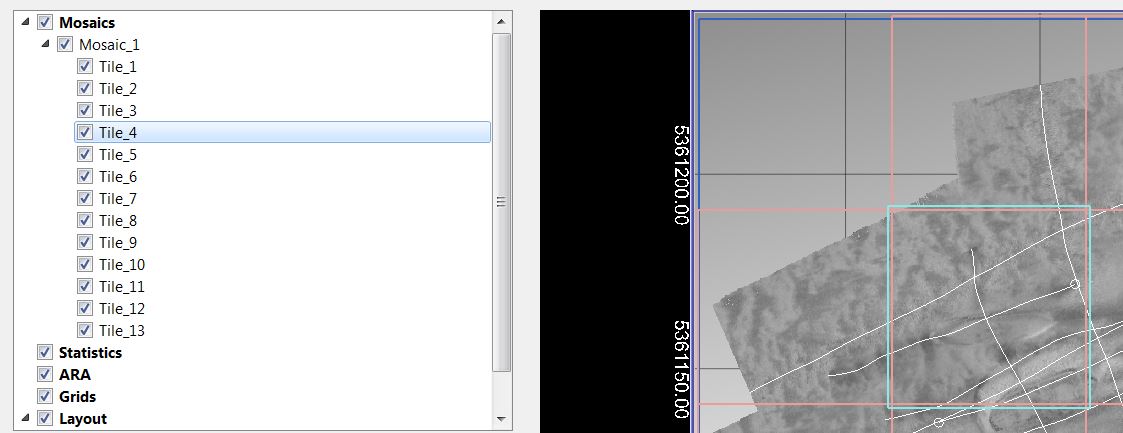
-
Once you have created the tiles, you can switch them on and off independently however, adjusting the mosaic colour map can only be done by selecting the Mosaic at the top of the file tree.
If you try to adjust the colour map for the individual tile you will find the histogram greyed out
Importing Data to Fledermaus
-
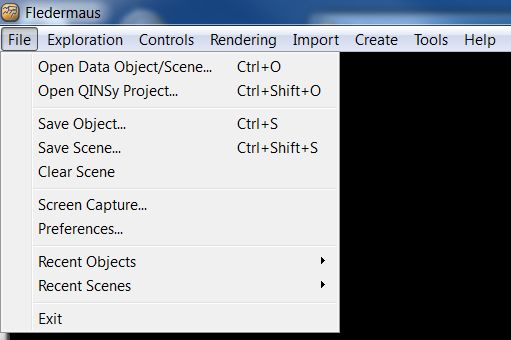
Open Fledermaus using the Icon on the desktop

or the Program Files menu.
-
You can then Import the Images using the Import>Images or open SD files through the File>Open Data Object\Scene.
-
You can then combine the Backscatter Images with the Bathymetry, create a sediment interpretation and export the final products to ArcGIS.
For more information please see the Fledermaus 7.4.0xx documentation page.
Related articles
(Only available when logged in to the QPS website)