Processing Towed Streamer Seismic Positioning Data
On this page:
Real time QA/QC
Proper use of real time quality assurance/quality control tools should result in acceptable navigation positioning data during data acquisition.
Some QA/QC methods include:
- Setting up applicable realistic statistical testing parameters including a priori standard deviations for all observations (DbSetup), and statistical testing parameters.
Please refer to:- Help pages - DbSetup~File~System.
- Help pages - Controller~Settings~ComputationSetup~ComputationParameters.
- Knowledge Base - Howto Total Propagated Uncertainty - TPU.
- Setting appropriate GNSS thresholds for Age, Solution Mode, 3D Position RMS, Position SD, Height SD, and/or Horizontal DOP.
Please refer to: Controller~Settings~ComputationSetup~SystemParameters. - Monitoring computed statistics and thresholds.
Please refer to:- Alert Display - Help pages DspAlert
- Computation Status Display - Help pages DspAdjStatus
- Generic Display - Help pages DspGeneric
- Node QC Display - Help pages DspNodeQC
- Observation QC Display - Help pages DspObsQc
- Positioning System Display - Help pages DspPositioningSystem
- Scatterplot Display - Help pages DspScatterplot
- Timeplot Display - Help pages DspTimeplot
- 3D Error Ellispe Display - Help pages Dsp3DEllipse
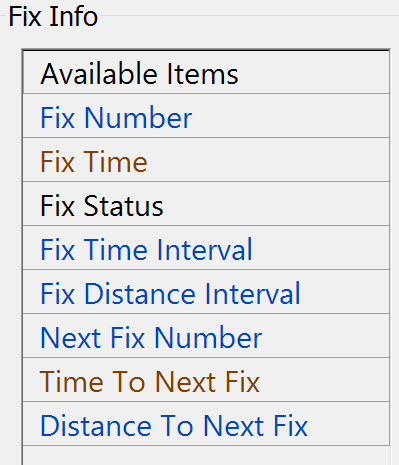
- Monitoring Fix information available in the Generic Display (Help pages DspGeneric) and in the Navigation Display (Help pages DspNavigation):

Offline QA/QC
Processing of navigation positioning data includes:
- Checking all shotpoints are present and in the right place.
- Checking for gaps in the coverage.
- Checking vessel positions are continuous and reliable.
- Checking tailbuoy positions are continuous and reliable.
- Checking and smoothing compass data.
- Checking and smoothing laser and acoustic range data.
Processing may be approached in two different ways:
Analyze program
Using the Analyze program accessed via the Raw Data Manager - Action - Analyze, which starts the Raw Observation Inspection Tool.
The purpose is twofold:
- Simple inspection of raw observations for value, update rates, latency, noise and spikes using either the time series plots or the alphanumeric listings.
- Filtering and despiking any or all of the raw observations using automated and manual methods.
This includes applying latency to certain observations if needed. In this process a new copy of the original database is created and differentiated by the addition of '.FILT' in the name.
All filtering and despiking is performed on this copy leaving the original database always untouched. After conditioning the data the next step is to Replay the *.FILT.DB files to generate new *.RES files.
Because filtered observation values are used during Replay, the new *.FILT.RES files should contain better positioning and the *.FILT.DB should contain smoothed observation values.The resulting *.FILT.DB and new *.RES files are then used to export UKOOA P2/94 and P1/90 formatted files.
Info
Replay is started from the Console and opens the Raw Data Manager.
Validator program
The Validator program is a later development, although quite old itself. It is accessed from the Survey Manager.
If 'dummy' echosounders are defined for each object (as advised in other parts of 'How-to Geophysical Surveys), and *.QPD files have been output during acquisition, the transducer locations of every dummy echosounder can be displayed.
Filters similar to those available in the Analyze program can be applied to one or more transducer tracks to smooth positions as necessary.
Advantages and Disadvantages
In early Qinsy versions, the Raw Observation Inspect Tool was the only tool for conditioning the data.
One disadvantage of this method is that each observation group (positioning systems, echosounders, MRUs, Gyros, etc.) nearly always has to be filtered separately, and sometimes manual editing is necessary when automated filters do not always work. This all takes time.
Another disadvantage is that Replay of the *.FILT.DB files is required, it being the only way to generate new *.RES results files which should contain better positioning results. The filtered *.FILT.DB and new *FILT.RES files are needed to export UKOOA formatted files.
Later the Validator was developed for filtering the data. It has the advantage that Replay is not mandatory.
One disadvantage of Validator is that it currently (2015) requires definition of 'dummy' echosounders in order to store computed object positions. Since these systems cannot be added to the *.DB file at a later date it is frustrating to realize this after acquisition is complete.
Another disadvantage of Validator is not being equipped to output positioning data in UKOOA P2/94 and P1/90 formats, which are often client specified. It does however provide a User-Defined ASCII Output option that is a very useful substitute if data can be delivered in a format alternative to UKOOA.
Info
Although all the automatic and manual filter options are still available in Analyze, we would advise that you only use this tool for a quick and easy check on the raw observations; do not use it to filter the data!
The one exception is when there is a fixed delay in one of the observations. Then the only solution is to apply a latency filter to the raw observation and replay the data.
Return to: 43508039
Return to: 2D and 3D Towed Streamer Seismic Surveys
