
How-to I/O Test Utility
This How-to briefly explains how to use the I/O Test Utility tool.
Introduction
The I/O Test Utility tool is used as a port viewer to check that data is streaming into the PC correctly and that the connection settings for each system you have are what you expect.
The data streaming into the I/O test utility can be recorded in log files and used by the QPS Support Team to replicate issues with the data drivers.
Step-by-Step
Step 1: Open the I/O Test Utility Tool
From the Console
Open the I/O Tester from the Qinsy Console by selecting the icon in the bottom half of the console (see Figure 1a).
This will open a blank I/O Test Utility dialog box, the ports will need to be added individually, see Step 2.
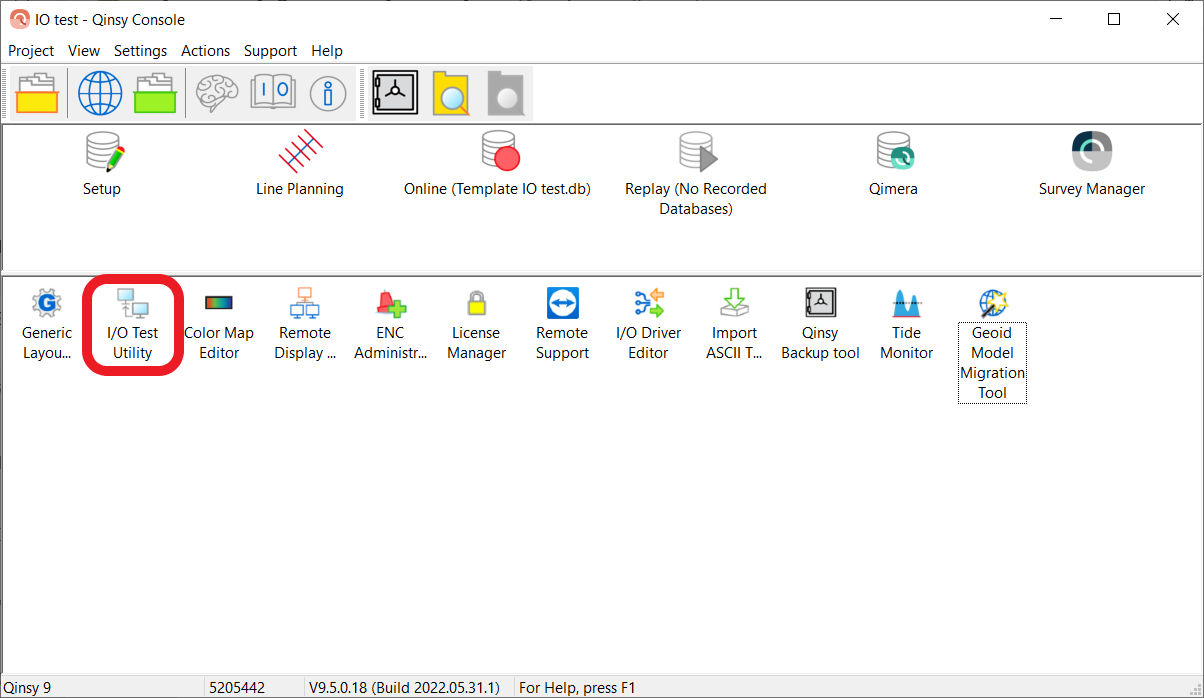
Figure 1a. Start the I/O Test Utility tool from the Console.
From the Template Manger
The I/O Tester can also be opened from the toolbar in the Template Manager dialog box by selecting the Template Database (vessel setup) and selecting the I/O Tester icon (see Figure 1b).
This opens the I/O Test Utility tool, with all the ports from that vessel setup.
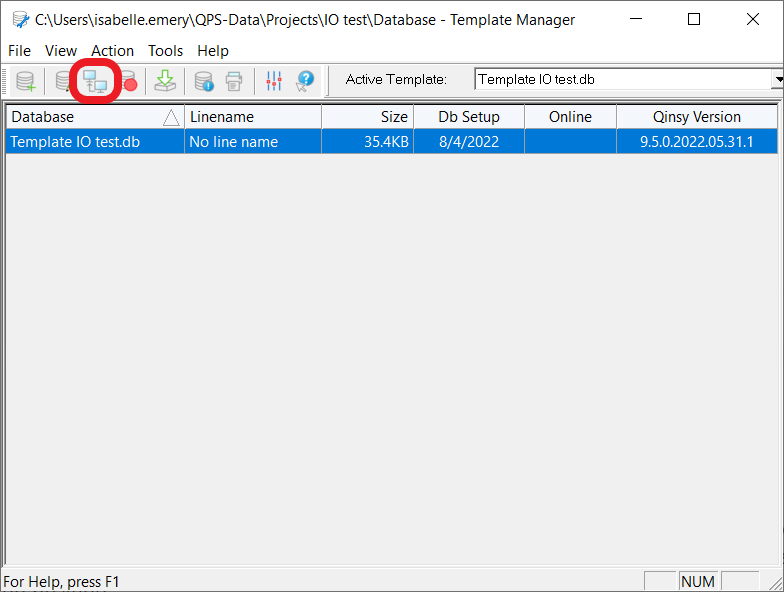
Figure 1b. Start the I/O Test Utility tool from the Template Manger.
Step 2: Adding Ports
Add port windows to the I/O Tester by selecting the plus sign in the toolbar (see Figure 2), this will open the Port Properties dialog box.
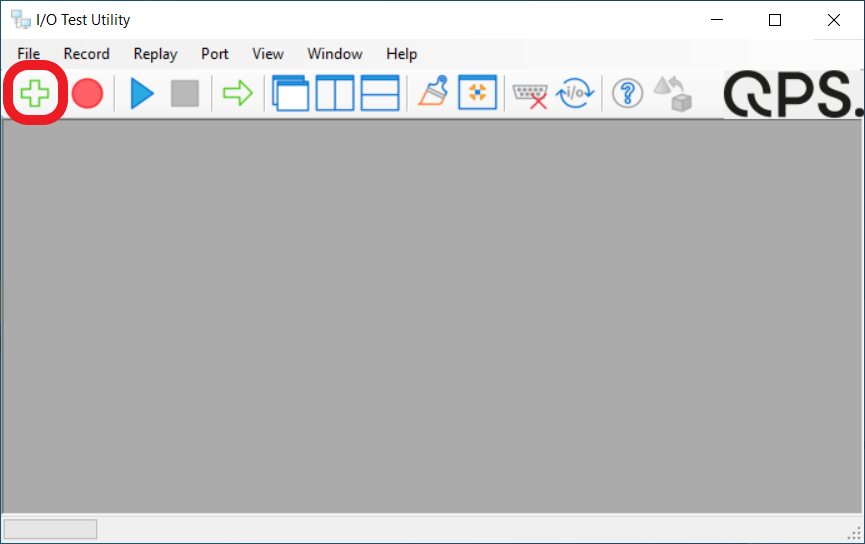
Figures 2. Add a new port to the I/O tester.
In the Port Properties dialog box, name the port and choose the type of connection that will be used:
- Serial Connection - Choose a COM port, Baud rate, Data bits, Parity and the Stop bits in the Port Properties dialog box (see Figure 3a).
Additionally, if needed, it is possible to set the Flow Control options. Note that this is not possible in the Template, so depending on the driver it may work the same or not.
The information on these specifics can be found in the template when selecting the System (see Figure 3b).
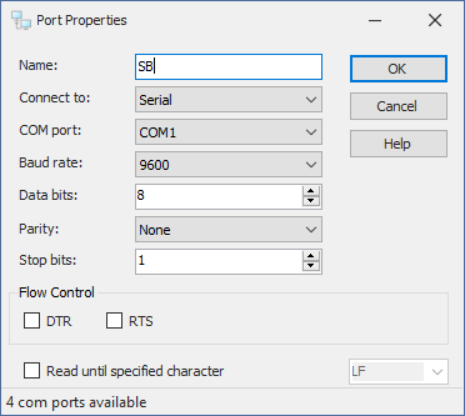
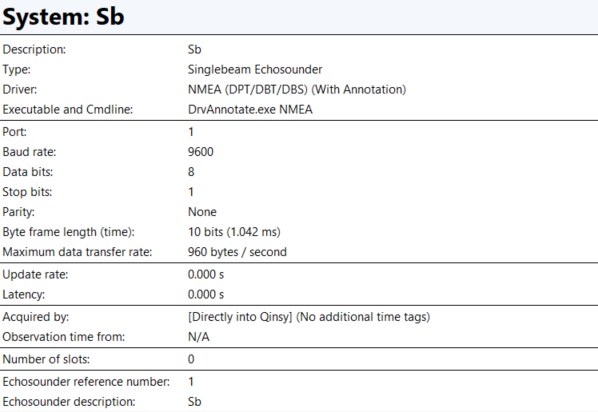
Figures 3a and b. Create a Serial port in the I/O tester.
- UDP Connection - Choose the IP address and enter a Port number (see Figure 3c).
It is also possible to set the Windows Internal IP address by selecting "Loopback".
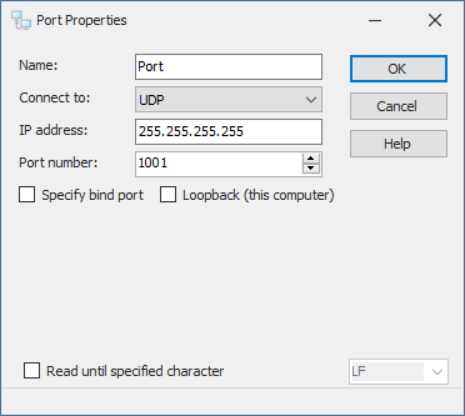
Figure 3c. Create a UDP port in the I/O tester.
- TCP Client, TCP Server, and UDP Multicast - Choose the IP address and the Port number for each of these port connections in the Port Properties dialog box (see Figure 3d).
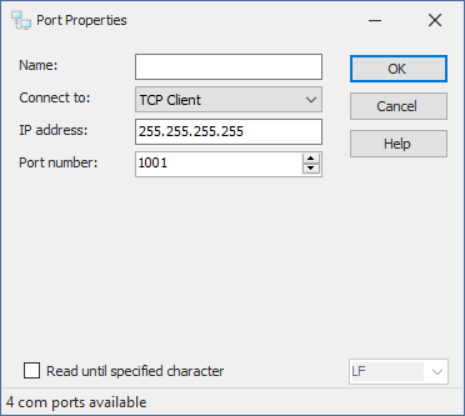
Figure 3d. Create a TCP port in the I/O tester.
Select "OK" to create the new port. Create as many ports as necessary.
To open all the ports made in the database use the I/O Tester icon in the Template Manager (see Figure 1b).
Once a port set up correctly the data will start to stream into the receive side of the port window.
Exceptions
If there is no data streaming in, the window will remain blank. If the in coming data stream is being displayed as gibberish then the data stream could be in binary or a port setting could be wrong.
- TCP connection
It might be that no data is shown because the Qinsy driver should actively ask for data.
Since the I/O Test Utility does not do this, it might be empty. - PPS
The same applies to the port on which the PPS is received.
Step 3: Record a Log File
Recording a log file can be used by Support to replicate issues in Qinsy that can't be otherwise replicated, to pinpoint bugs in the software or setup issues.
To record a log file you can either:
- Select the record button on the main toolbar (see Figure 4a), this records the data that is coming into every open port in the I/O Tester,

Figure 4a. Record from the main toolbar.
- Or select the record button on each port's toolbar (see Figure 4b), this records the data that is coming into that individual port.
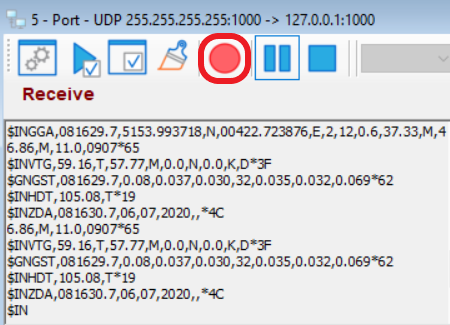
Figure 4b. Record from each Port's toolbar.
After selecting record the Record Options dialog box opens. Use the dialog box to specify the name and location of the file and select the type of file and the parameters for the file (see Figure 5a).
If you are recording from the main toolbar you can also select the Ports that you want to record (see Figure 5b). Select "OK" to record the data.
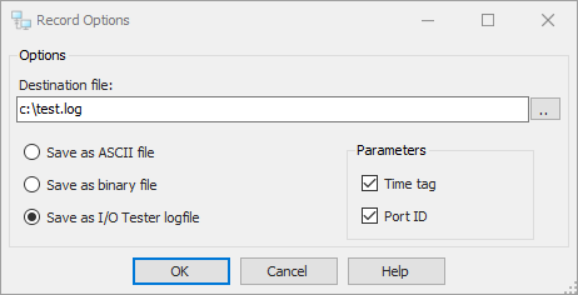
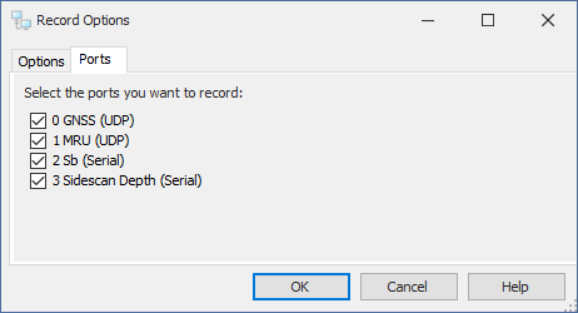
Figures 5a and b. Record Options dialog box opened from a) a port toolbar and b) the main toolbar.
Step 4: Replaying Data from a Log File
To replay the log file from each port select the Replay button (see Figure 6a), this opens the Replay Options dialog box.
In the dialog box select the file that you would like to play and the settings for the file (see Figure 6b), specify if this is an I/O Tester log file for the proper reading of the file. Select "OK" to load the file into the Port.
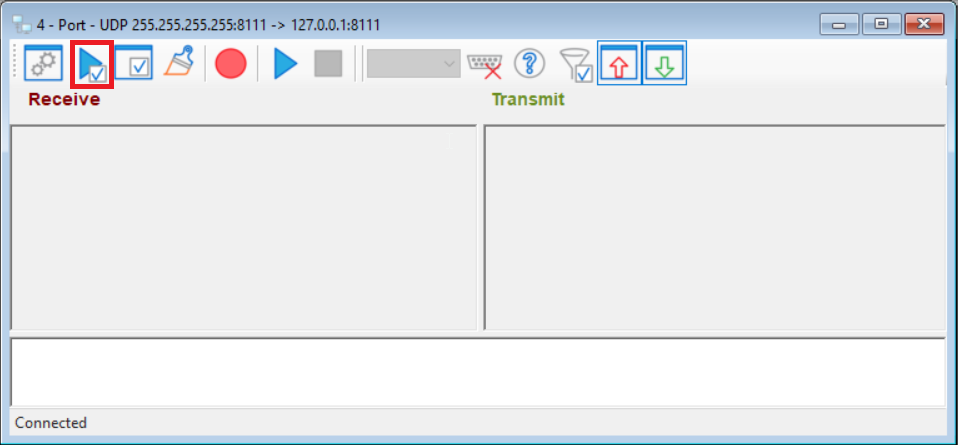
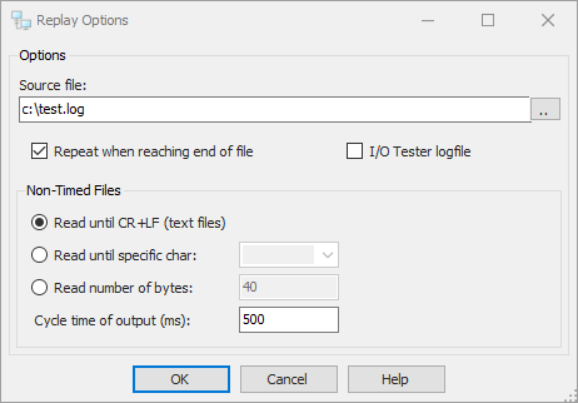
Figures 6a and b. Select the Replay button in a port window to open the Replay Options dialog box.
Replay an I/O log file for all the open ports by selecting the play button on the main toolbar (see Figure 7a) this opens the Replay Options dialog box.

Figure 7a. The Play button on the main toolbar.
Use this dialog box to choose whether to open one I/O Tester log file for every port or individual files for each port (see Figure 7b).
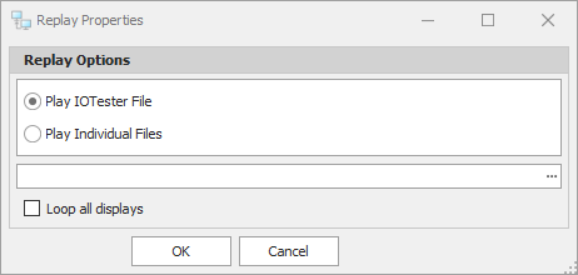
Figure 7b. The Replay Properties dialog box.
- Select "I/O Tester log file" in the Replay Properties dialog box, and choose the file and whether to loop all displays. Select "OK" to continue to open the Replay Options dialog box. In the dialog box choose which "Available Ports" the data from the "Recorded Ports" go into from the dropdown menu (see Figure 7d).
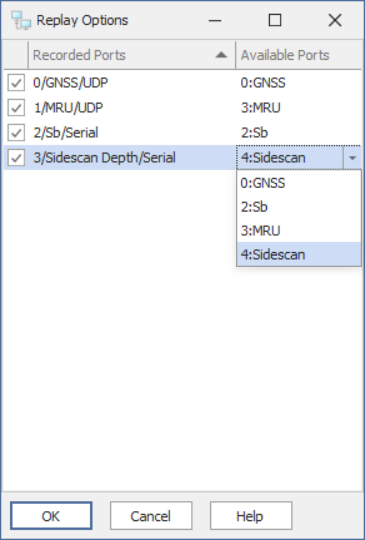
Figure 7c. The Replay Options dialog box.
- Select "Play Individual Files" in the Replay Properties dialog box, and select "OK" to continue. For each port of interest, select the associated file and settings. The order of the Replay Options dialog boxes follow the number of each port, the port window number can be found on the port windows (see Figure 7d), these numbers go from 0 to how many ports there are.
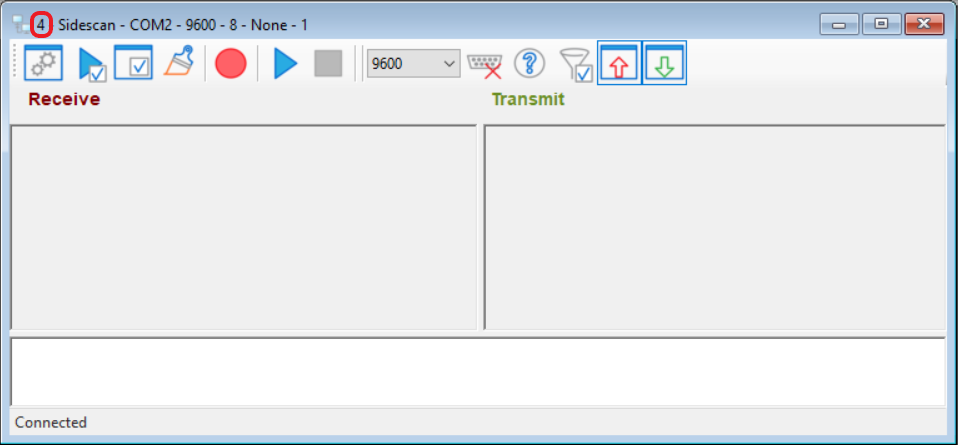
Figure 7d. The port window number.
Redirect Data
The I/O Test Utility tool can function as a portal as well.
For example, redirect data coming into a UDP port and send it back out through a serial port.
To do this select the Redirect Ports icon in the main toolbar (see 1 in Figure 8) to open the Redirect options dialog box.
In this dialog box select the input port in the "Source Ports" column and choose the output port in the "Destination Port" (see 2 in Figure 8).
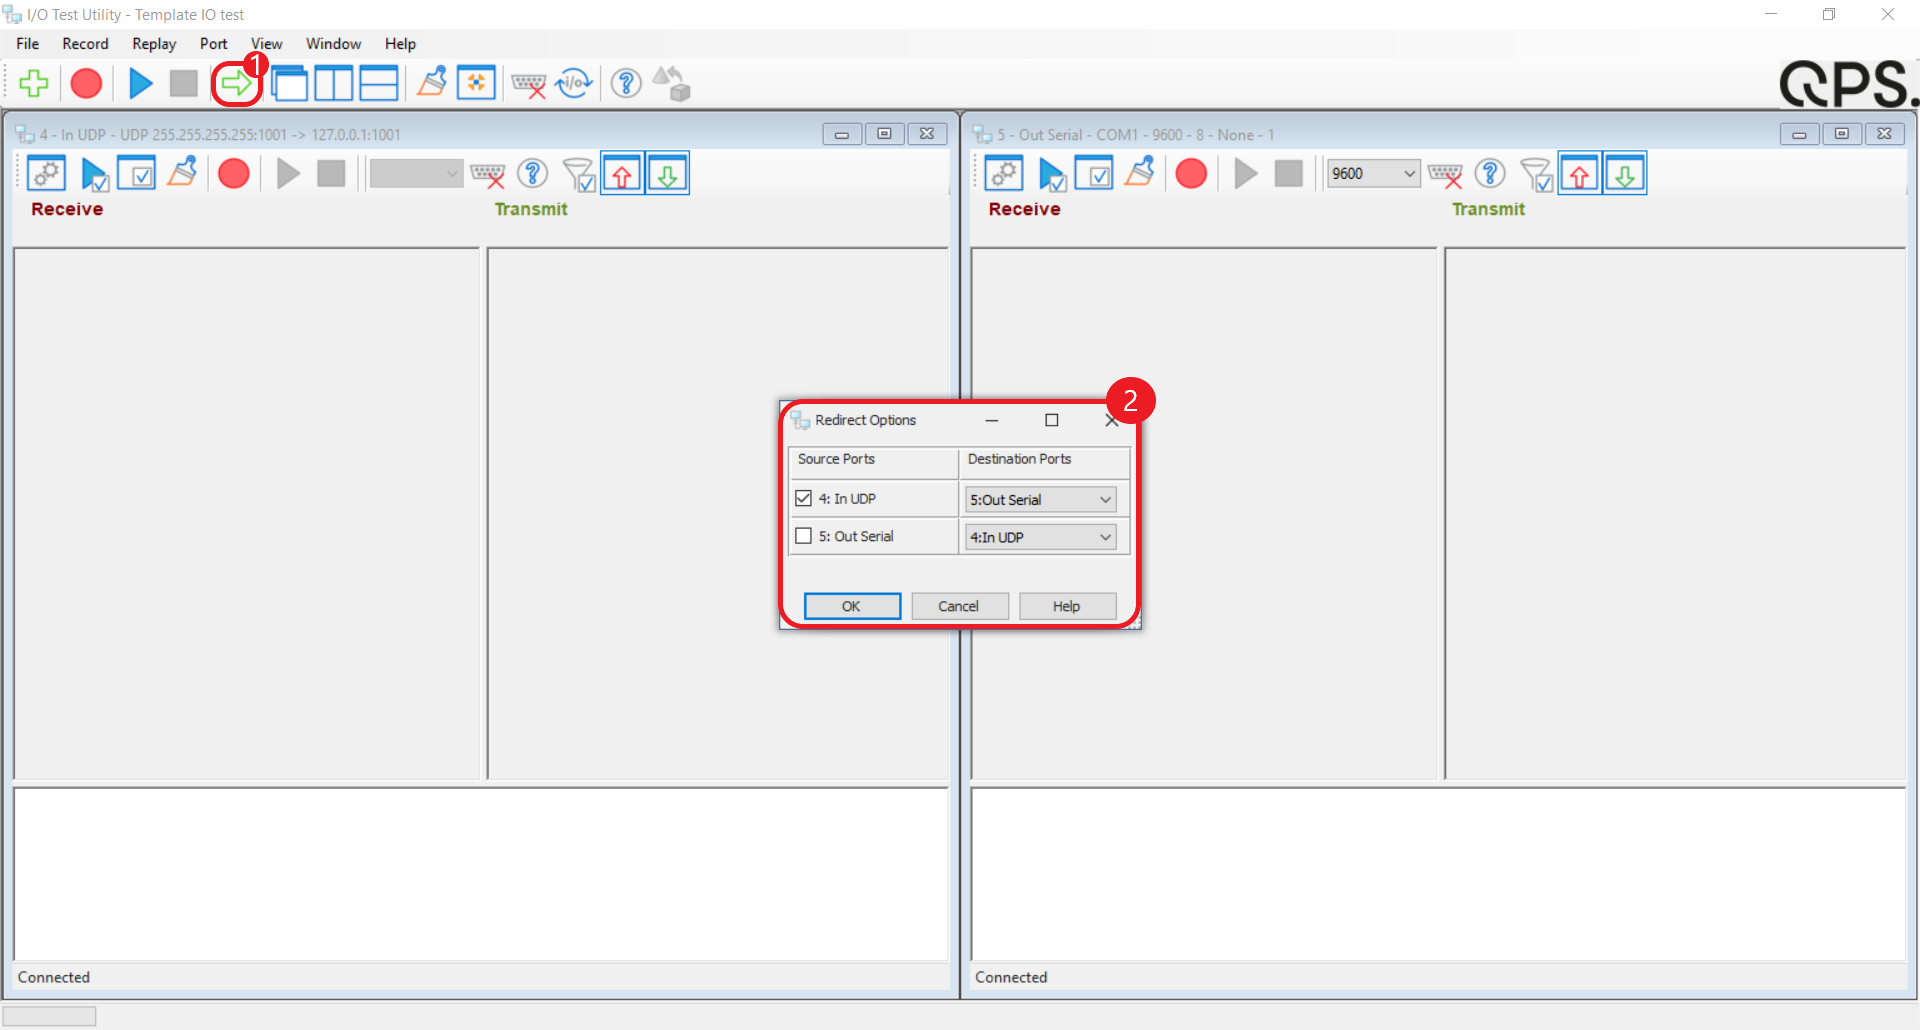
Figure 8. Redirecting the data from one input to output port.
Scan for Serial Ports
If not all of the serial port connections are showing up in the I/O Test Utility tool, the best way to fix this is to scan for the computer's ports.
To do this select "Scan Serial" under Port in the main toolbar (see Figure 9), this will scan the computer and all ports will now show up in the I/O Tester.
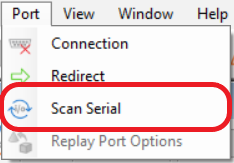
Figure 9. Scan for Serial ports.