
5. Qinsy Survey Manager
This document describes how to get started with the Survey Manager.
Should you need more detailed information then the F1 Help function within the program can be used.
Before you start
Make sure that an existing project is selected and that a template is available and made active in the top panel of the Qinsy Console.
Functions in the Survey Manager
The numbers in the diagram refer to the paragraphs in which the components are explained.
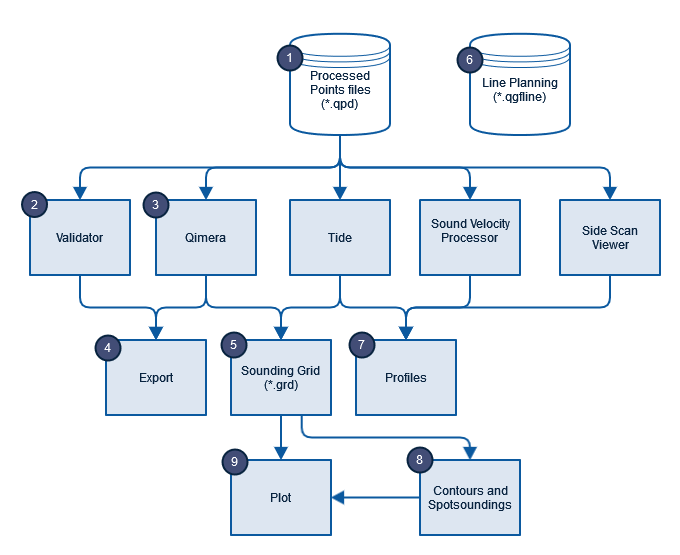
Overview of explained components
- (9.5) 5. Qinsy Survey Manager#(1) Processed Points
- (2) Validating Data using the Validator
- (3) Editing Data with Qimera
After cleaning and validating data use the following components:
- (9.5) 5. Qinsy Survey Manager#(4) Exporting Processed Points to different formats
- (9.5) 5. Qinsy Survey Manager#(5) Viewing Data in a Sounding Grid
- (6) Line Planning
- (9.5) 5. Qinsy Survey Manager#(7) Creating Profiles
- (8) Contours and Spotsoundings
The final product of the Survey Manager can be a plot of the data:
Some hints to make working with the program more convenient:
Press the Survey Manager icon to start the program
![]()
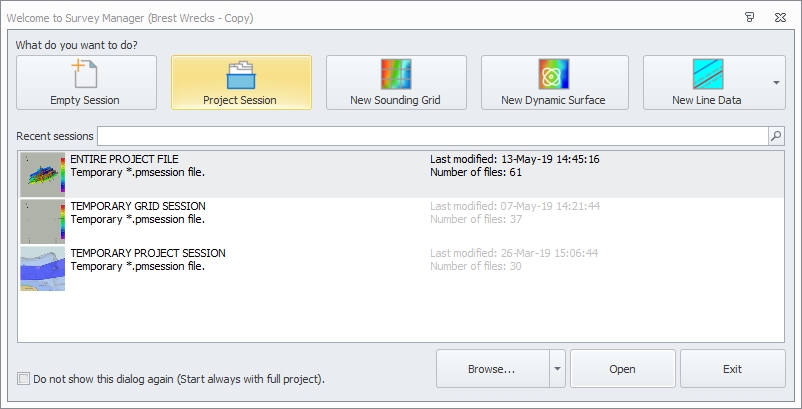
When starting up the Survey Manager, you have a choice between different options.
When choosing Project Session all available files (like QPD files, Sounding Grids, line data, background data, etc.) in the project will be loaded.
(1) Processed Points
Dynamic Surface
The Dynamic Surface is a combination grid of all selected QPDs. It is a dynamic grid, which shows the latest results.
Changes made to the Processed Points (QPDs) will affect the Dynamic Surface.
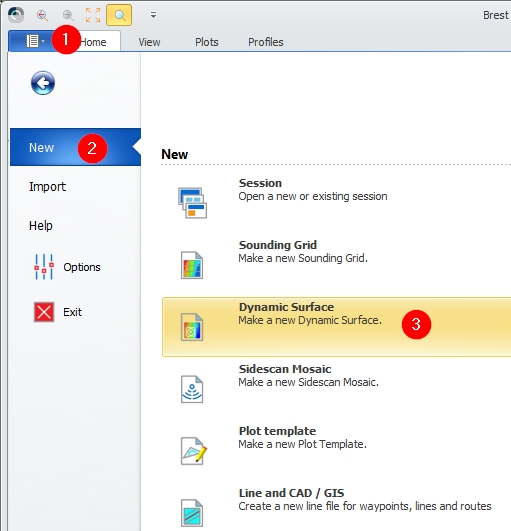
Select Dynamic Surface
Either
- Go to the File tab.
- Press New.
- Select Dynamic Surface.
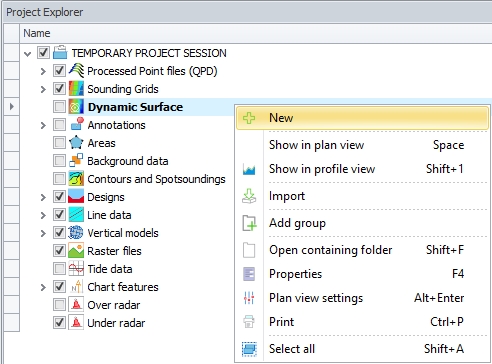
Or
Right click on Dynamic Surface in the Project Explorer and select New.
Select files to fill the Dynamic Surface grid
Press <OK>.
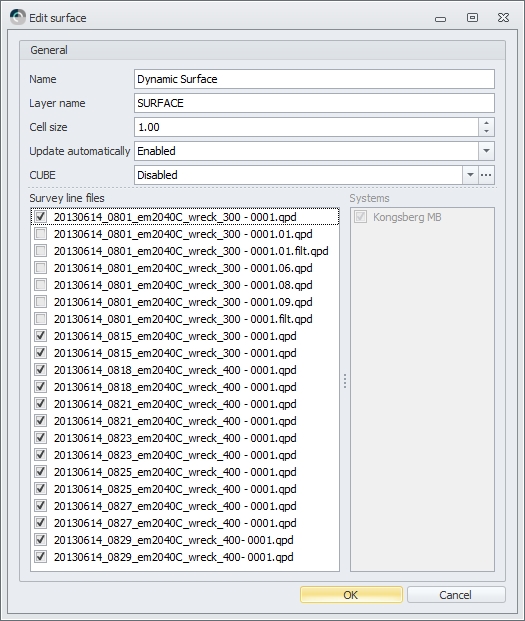
The Dynamic Surface Update will start. (This may take some time.)

Enable Dynamic Surface
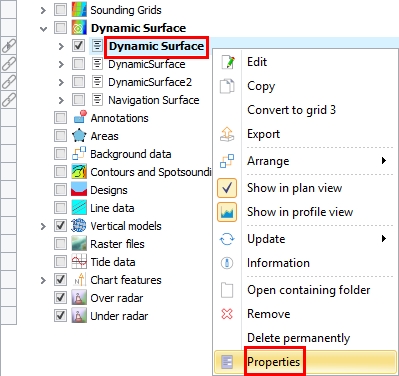
In order to view the Dynamic Surface, it should be enabled. This can be done in Project Explorer on the left hand side of the screen.
Right click on the Dynamic Surface. Here you can either tick 'Show in plan view' or you can open the Properties Window.
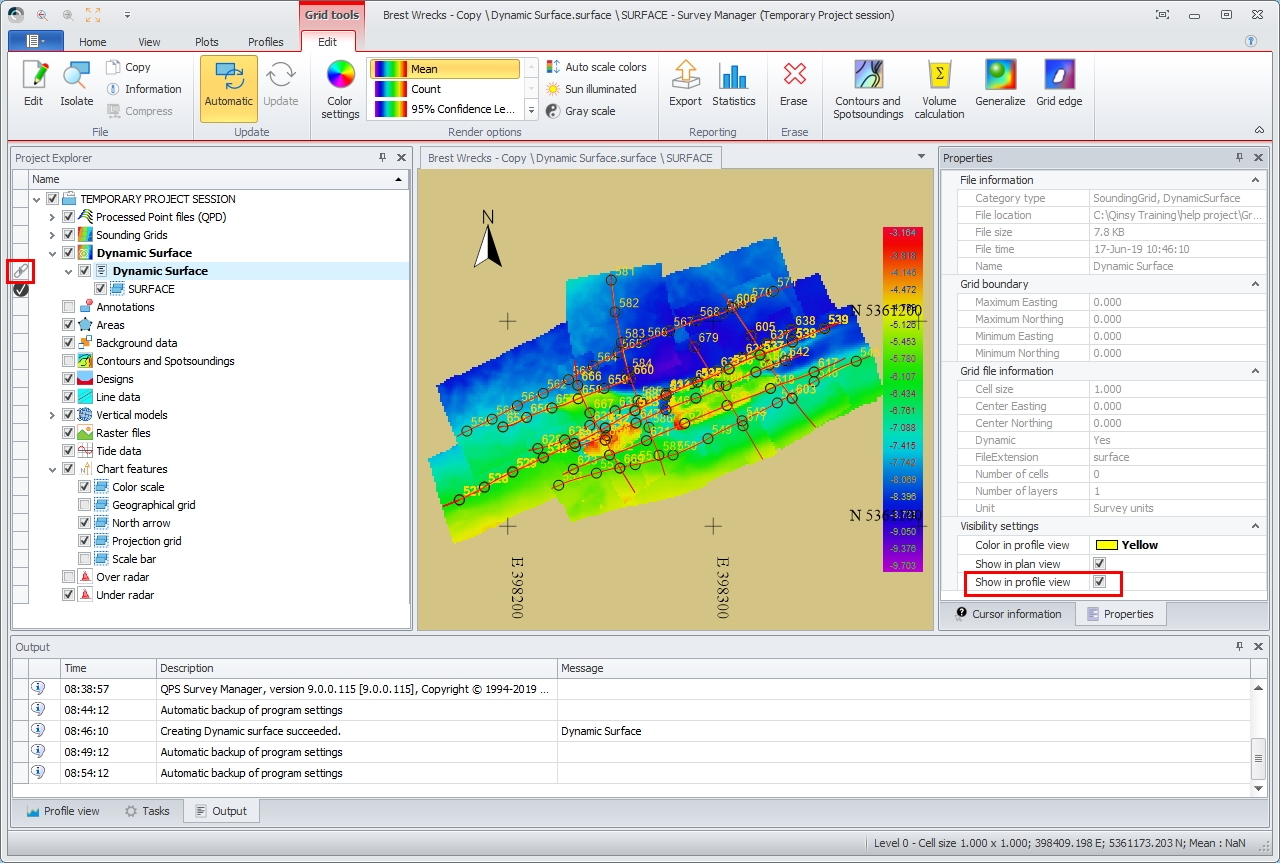
To be able to show it in the Profile Display when a profile is generated, you can either tick 'Show in profile view' or you can open the Properties Window.
The link icon distinguishes a Dynamic Surface from a regular Sounding Grid.
(9.5) 5. Qinsy Survey Manager#Return to Overview
(2) Validating Data using the Validator
Cleaning data can be done with the Validator tool (and/or Qimera) from the Survey Manager.
In the Project Explorer select which files need to be inspected
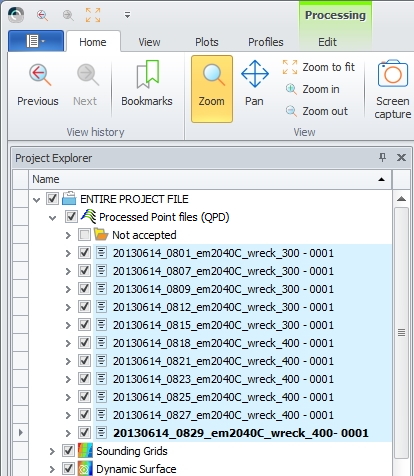
Use the mouse pointer combined with the <Shift> or <Ctrl> button to select the files.
Press the Processing tab's Edit tab
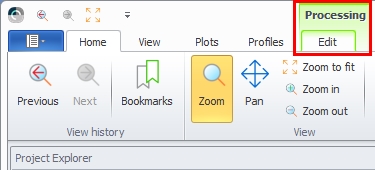
This will activate all the processing tools.
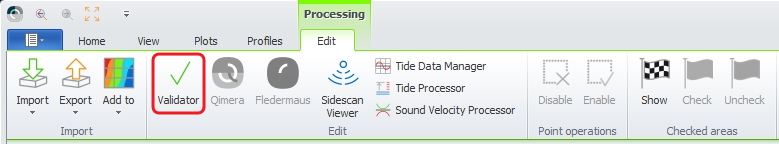
Start the Validator
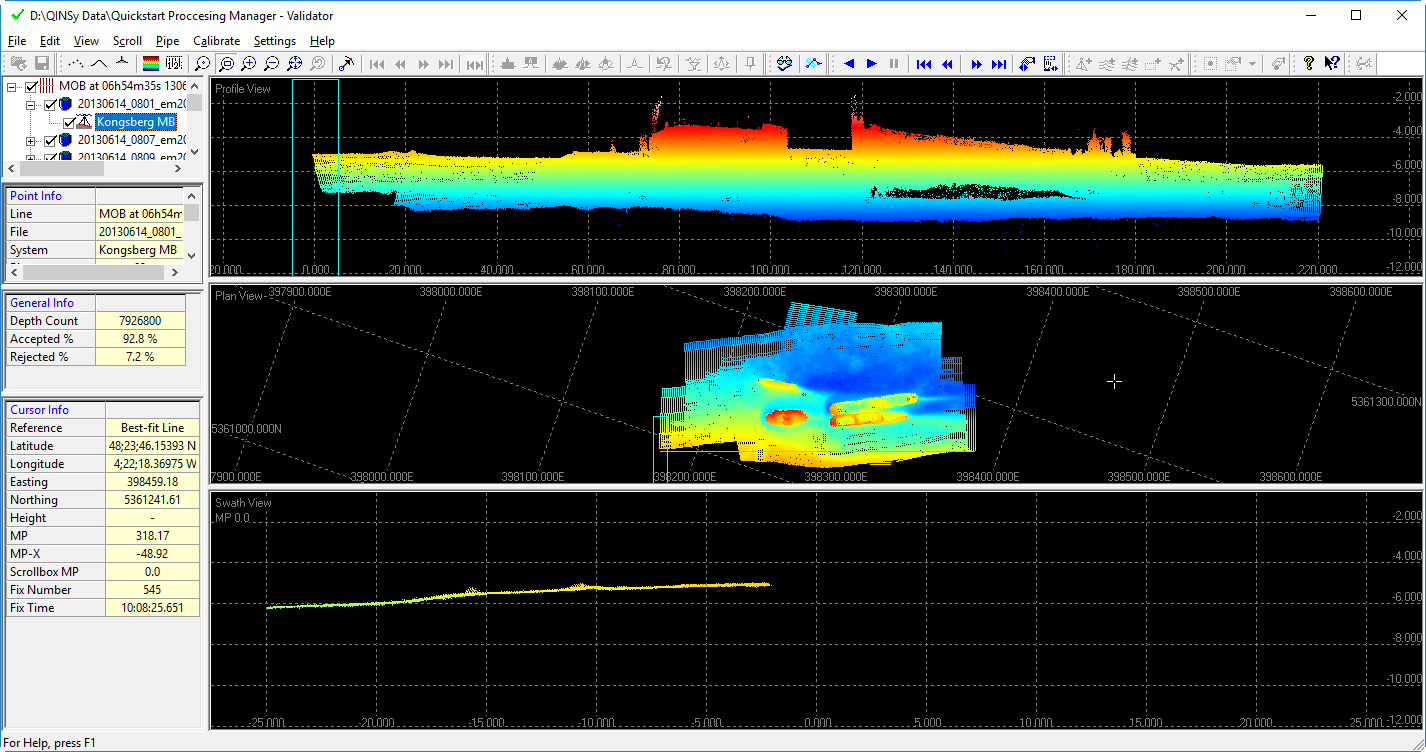
Edit your data.
For more information on how to work with the Validator use its F1 Help functions.
Exit the Validator.
The Dynamic Surface will be updated automatically.

(3) Editing Data using Qimera
If you have Qimera installed on your pc, you may use this to edit your survey data.
(9.5) 5. Qinsy Survey Manager#Return to Overview
(4) Exporting Processed Points to different formats
Select QPDs in the Project Explorer.
When Processed Points files (QPD) are selected the Ribbon tab Processing will light up.
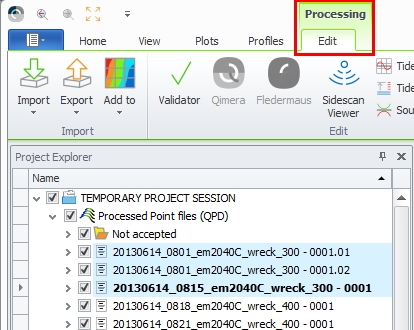
Press the Processing Edit tab
Among the processing options the Export button can be found.
Various predefined export formats can be selected:
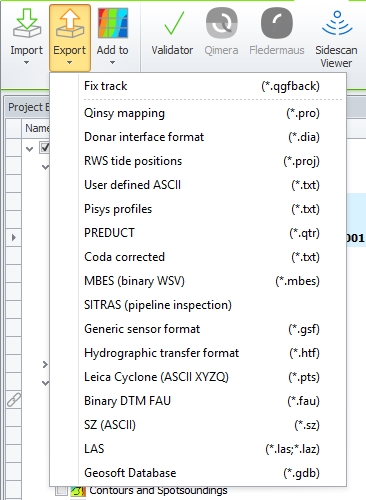
For more information on a specific export format, select the format and use the inline F1 Help function.
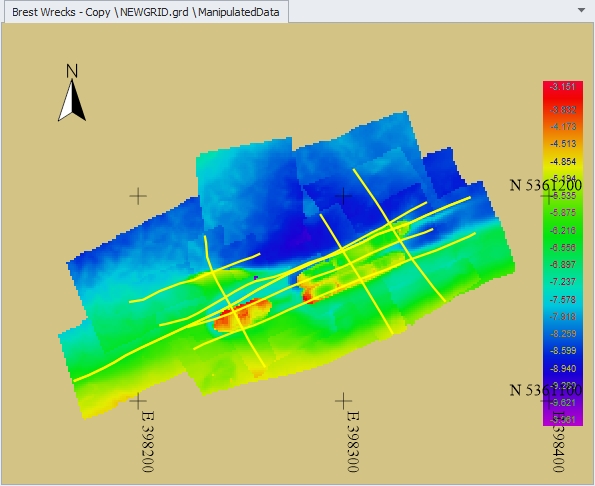
(5) Viewing Data in a Sounding Grid
Here an overview of the available data is seen placed in a grid:
Grid data can be exported and imported. To do this, a grid layer needs to be activated in the Ribbon tab Grid tools.
To work on data in a grid, it is safest to make a copy of the original grid in the Project Explorer.
Select which grid and layer to work with in the Project Explorer
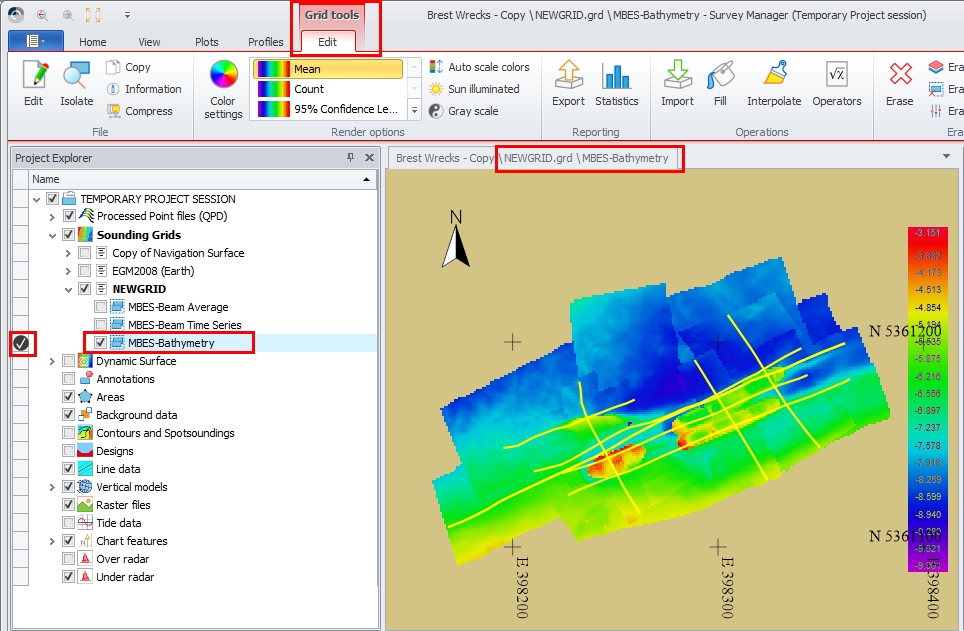
Selecting a grid will activate the Grid tools tab.
Press the Grid tools Edit tab
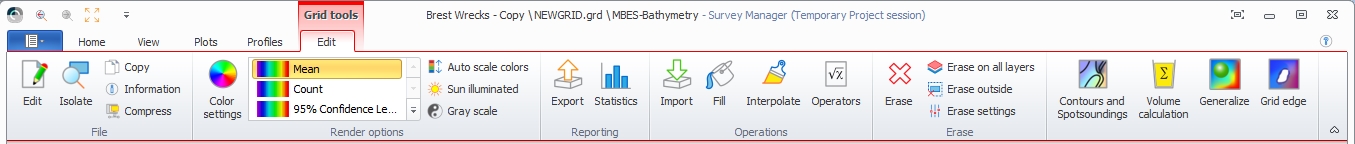
Pressing the Edit tab will activate the Grid tools which can be used on the Sounding Grid (or the non-edit options on the Dynamic Surface).
(9.5) 5. Qinsy Survey Manager#Return to Overview
(6) Line Planning
The Line tools tab only becomes active when a Line database is selected in the Project Explorer window.
How to create a new Line database
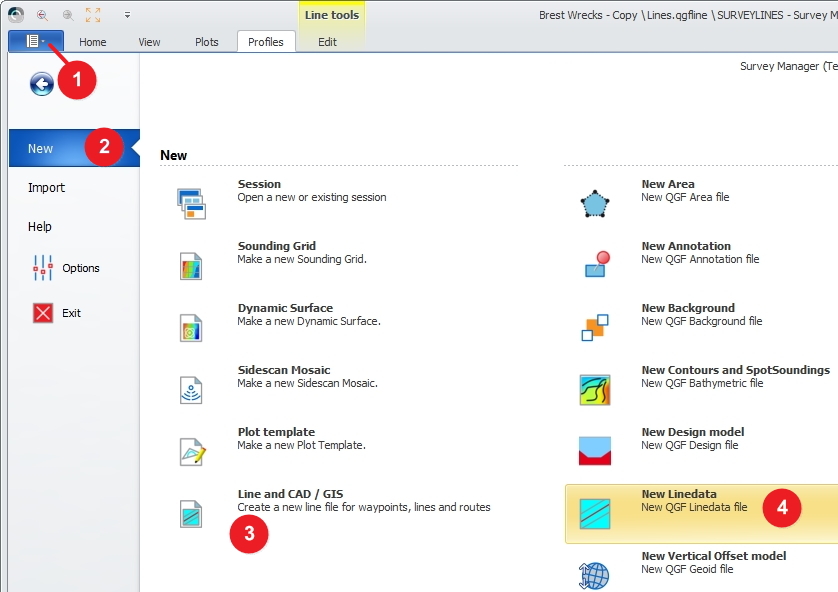
Either go to
- File
- New
- Line and CAD/GIS
- New Linedata
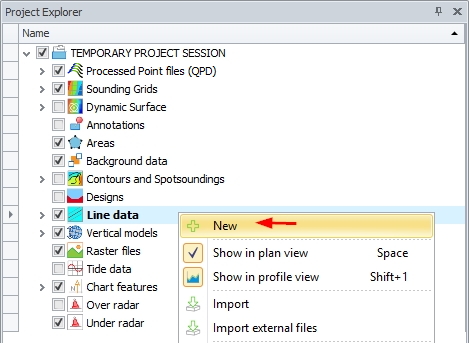
Or right click on Line data in the Project Explorer and select New:
Open an existing file or enter a name for a new file.
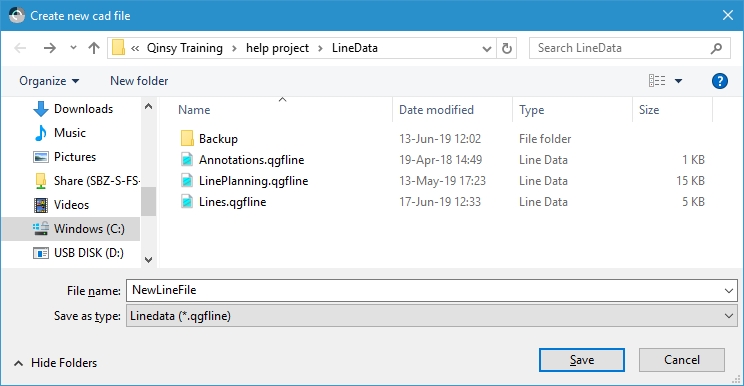
Save it as a *.qgfline file in the LineData folder of the active project.
The created *.qgfline file is now listed under the Line data files the Project Explorer tree.
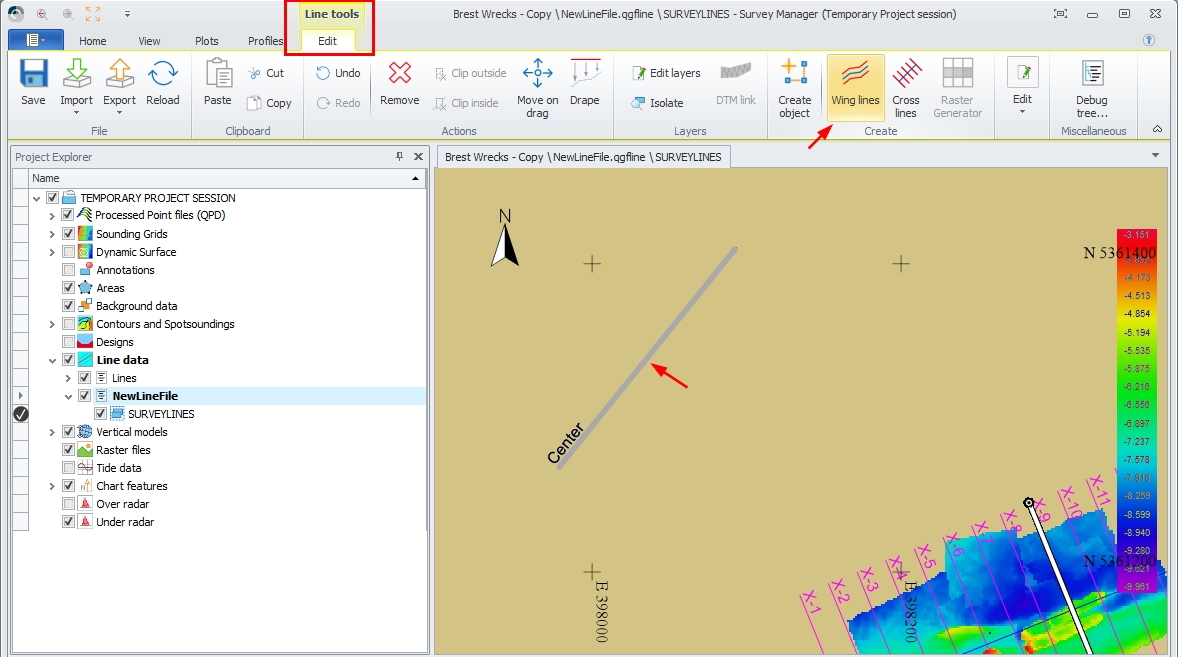
When the *.qgfline file is selected in the Project Explorer tree, the Line tools become active:
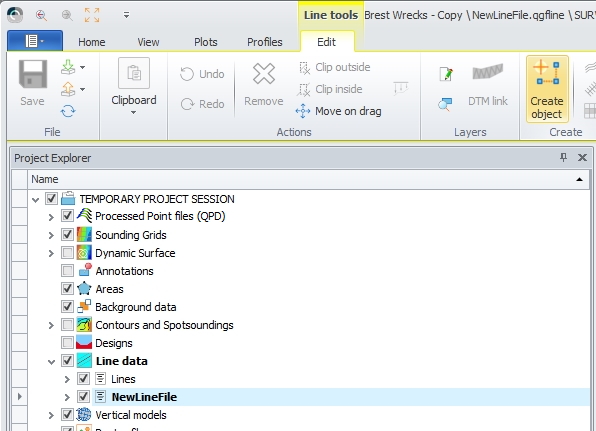
You can add points, lines, polylines and areas by using the Create object button 
Creating Points, Lines, Polylines
How to add (way)point(s) - Press the Create object button in the ribbon. Left mouse click in the Plan View to create the point. Right mouse click to fill in the Add New Object dialog. Press Ok. The point is saved to the *.qgfline file.
How to add a Line - Press the Create object button in the ribbon. Left mouse click in the Plan View to create the start point of the line, a second mouse click creates the endpoint of the line. Right mouse click to fill in the Add New Object dialog. Press Ok. The line is saved to the *.qgfline file.
How to add a Polyline - Press the Create object button in the ribbon. Left mouse click in the Plan View to create the start point of the polyline. Additional left mouse clicks will create the required line segments to the Polyline. Right mouse click to fill in the Add New Object dialog. Press Ok. The polyline is saved to the *.qgfline file.
Creating Wing lines and Cross lines
Wing lines and cross lines can be created using a Line or a Polyline as a reference.
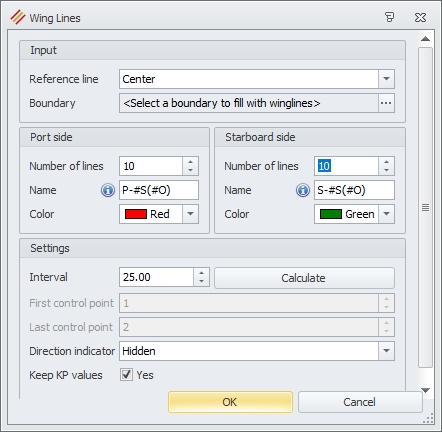
Creating Wing lines on a Line
Select the Line in Plan View. The line is selected when it's highlighted. Then press the Wing lines button.
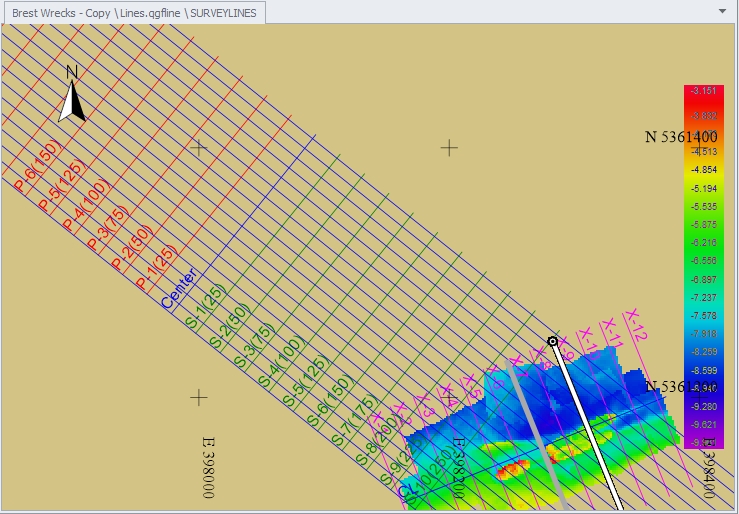
Decide how many wing lines will be created and what the line spacing will be.
Determine the naming convention of the lines:
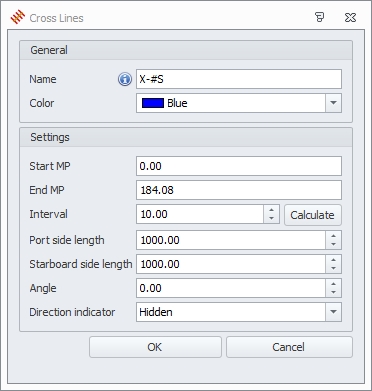
Creating Cross lines on a Line
Select the Line in Plan View. The line is selected when it's highlighted. Then press the Cross lines button in the Line Tools ribbon.
Determine the naming convention of the lines.
Decide the start and end distance along the line, the interval, the left and the right length.
If you want the cross lines not perpendicular to the selected line you can enter an angle.
Wing Lines and Cross Lines on a Polyline
It is also possible to create wing lines and cross lines on a polyline. Select a polyline instead of a line and then follow the exact same procedure.
Editing Points, Lines, Polylines
In Project Explorer select the *.qgfline file in which you need to make the adjustments.
Press the lower half of the Edit Objects button: 
Then select one of the options: Points, Lines or Polylines: 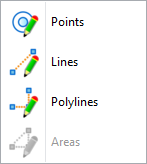
The respective user interface will open accordingly and enables editing.
(9.5) 5. Qinsy Survey Manager#Return to Overview
(7) Creating Profiles
It is possible to create a Quick Profile (A) by manually drawing a line in the Plan View or
it is possible to create Profiles on lines from a Line planning file (B).
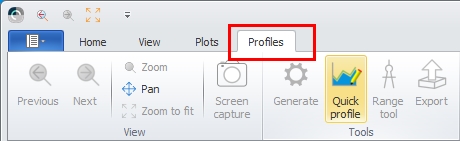
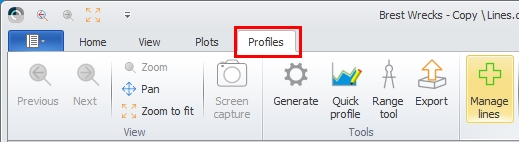
(a) Start the Quick Profile from the Profiles Ribbon Tab
Draw a line
In the Plan View manually draw a line.
Left click for each point, right click to finish the line.
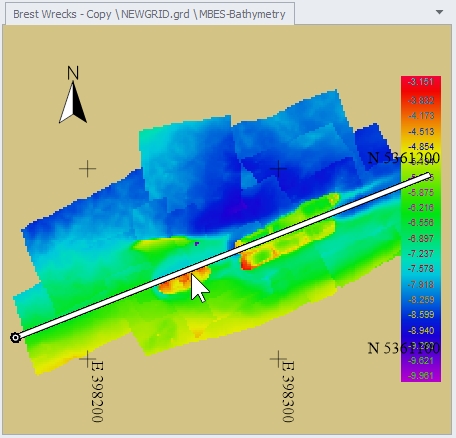
Now a Manual Profile is created in the Profile View window at the bottom of the screen.
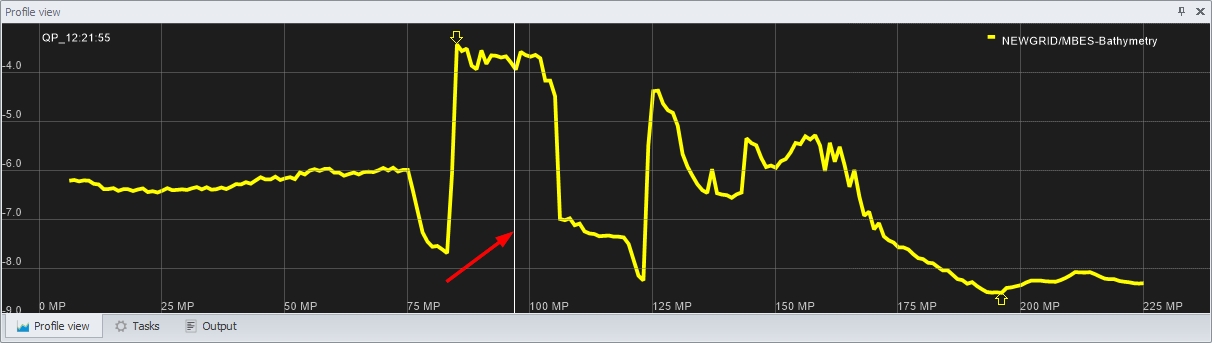
The vertical white line represents the location of the mouse pointer in the Plan View.
(b) Creating a profile line using a Line Planning file
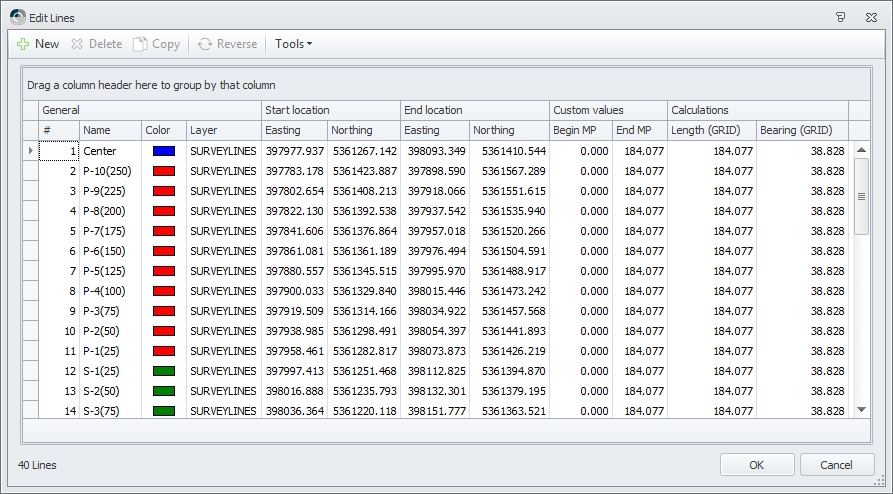
Activate the Manage Lines from the Profiles Ribbon Tab
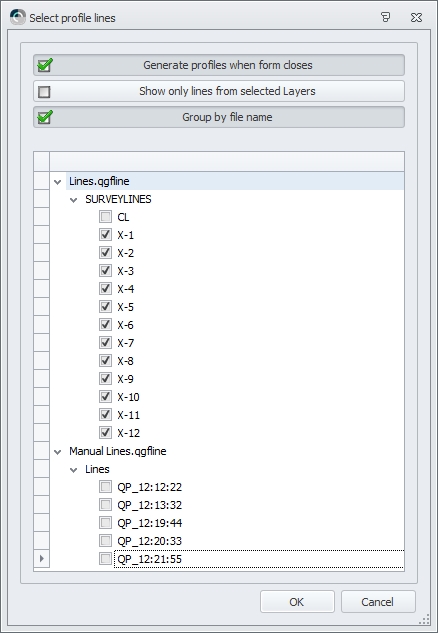
Select a line file and enable the lines you want to create profiles from and press OK.
Select lines for profiles
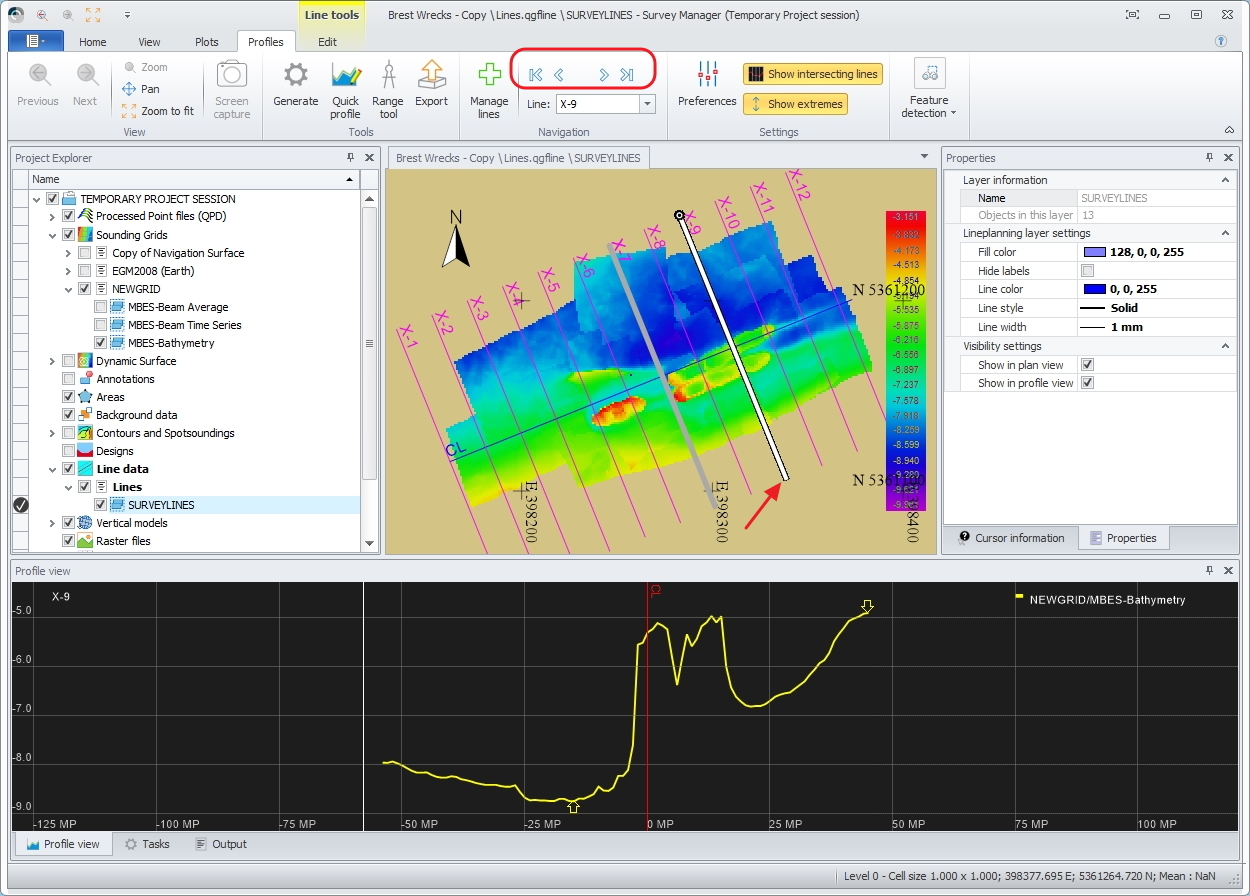
Use the arrow buttons to jump between the different profiles. The profile which is drawn in the Profile View is highlighted In the Plan View.
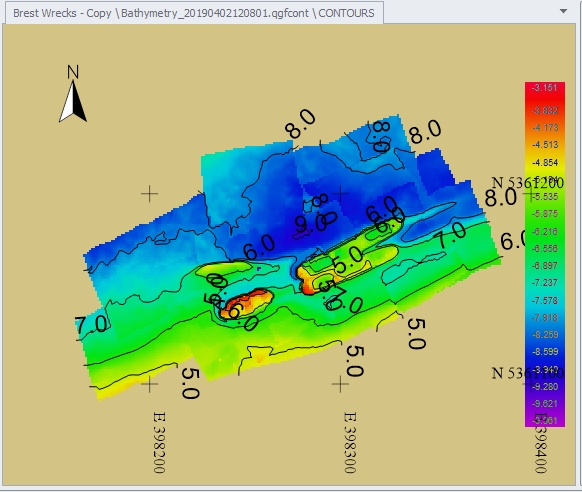
(8) Contours and Spotsoundings
In order to generate contour lines or depth sounding figures a specific grid layer needs to be activated.
This can be done in the Project Explorer window.
Activate a grid layer
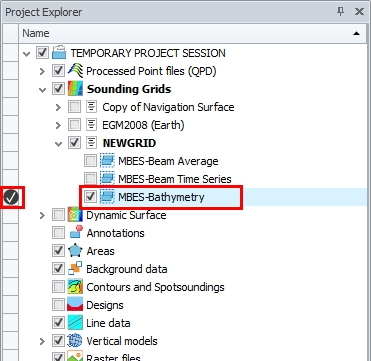
Selecting a grid layer will activate the Grid tools ribbon tab.
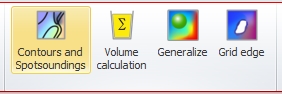
Press the Grid tools Edit tab
Pressing the Edit tab will activate the Grid Tools which can be used on the sounding grid.
Select an area
If contours or soundings are required in a certain area only, select this area first before filling in the following dialogs.
Use the right mouse to activate the selection menu.

Press Contours and Spotsoundings
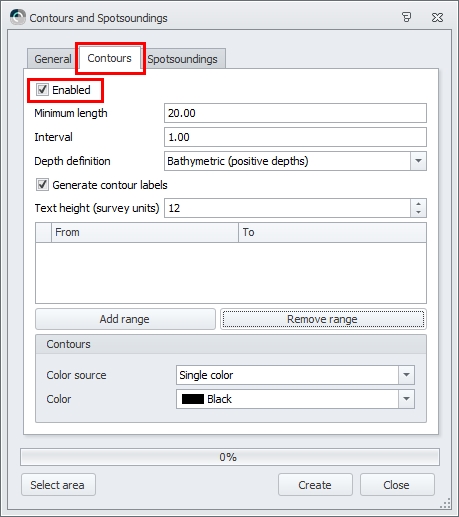
Enable the Contours
Enable the Spot Soundings
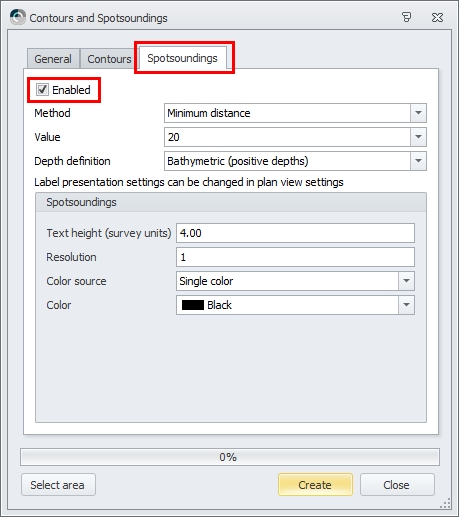
Press <Create>.
The contours and spot soundings are generated and shown in the grid in the Plan View.
(9) Plotting Data
Plotting is explained in a separate document (see: 6. Qinsy Plotting)
Tips and Tricks
There are several options in the Survey Manager to change the layout of your screen or to use shortcuts. They are based on the general MS Windows options.
- (9.5) 5. Qinsy Survey Manager#Add tools to Quick Access Toolbar
- (9.5) 5. Qinsy Survey Manager#Docking and Undocking windows
- (9.5) 5. Qinsy Survey Manager#Saving screen layouts
- (9.5) 5. Qinsy Survey Manager#Pinning down a menu
- (9.5) 5. Qinsy Survey Manager#Retrieving a window
Add tools to Quick Access Toolbar
This way you can always select the command independently from the currently active Ribbon Tab.
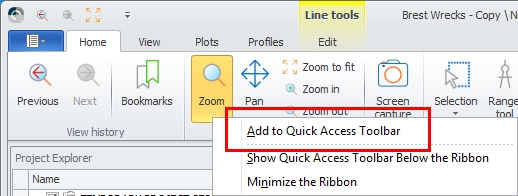
Right click on a menu option
Right click with your mouse on one of the menu options (e.g. Zoom) and select Add to Quick Access Toolbar.
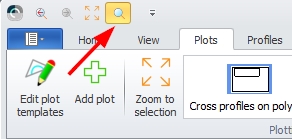
Now your new icon will be added to the Quick Access Toolbar at the very top of the screen:
Docking and Undocking windows
All view windows can be positioned to the user's preferences.
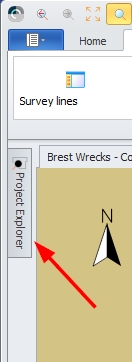
Double click in the name bar of a window
(Here the Project Explorer is selected.)
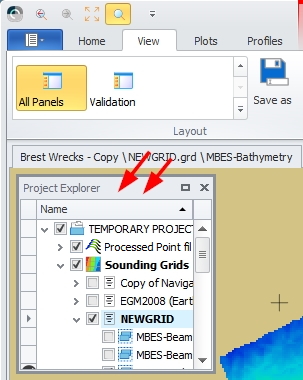
The window is immediately undocked.
The window can also be dragged to the center of the screen to undock it.
Now the window is undocked and floating.
Drag the window to a new location
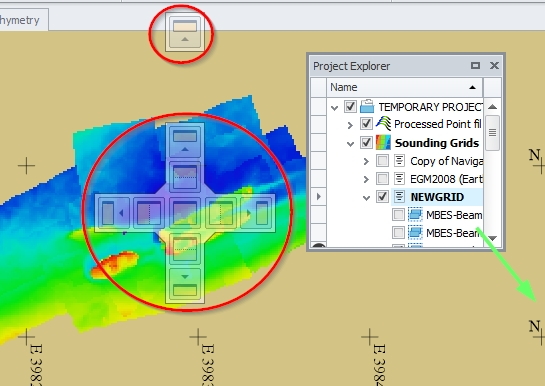
Slowly drag the window across the screen .
The docking icons will light up inside every window when moving through there and along all the outer edges.
Choose a position for the window
To position the window drag it over one of the docking icons.
Make sure the mouse pointer touches the icon.
The part of the screen where the window will be docked will be highlighted in blue.
Drop the window.
The sizes of windows can be adjusted by dragging the edges.
Saving screen layouts
After arranging the different windows the layout can be stored.
The Save as button is used for this.
Press the Save as button
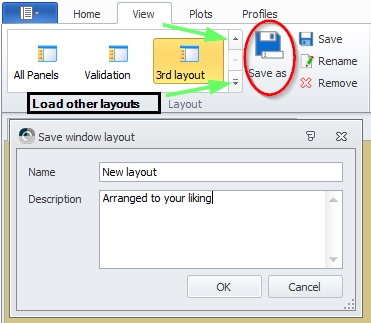
Enter a name for the layout and save it.
Use the up and down arrows of the list to re-load another layout.
Pinning down a menu
All the opened menu windows can clutter the screen. When they are not in use they can be minimized.
The pin icon is used for this.
Press the pin icon
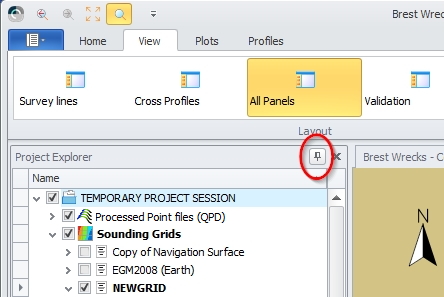
The menu window will be minimized whenever the cursor is moved elsewhere.
Hover over the window tab and it will open.
To keep the menu window open, press the pin icon again.
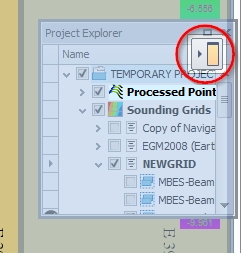
Retrieving a window
When a view window has been (accidentally) closed it can be retrieved and opened again.
Go to the View Ribbon Tab
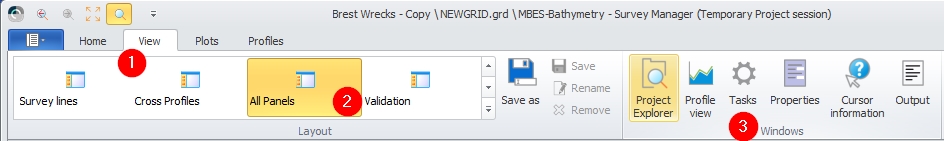
- Press the View tab
- Either choose the appropriate layout form the Layout group
- Or select the missing window from the Windows group.
(9.5) 5. Qinsy Survey Manager#Return to Tips and Tricks
or
Return to Overview.