
How to Start
Varying Vertical Shift Tool option from the Tools→Dynamic Grid Shifts menu in the Main Menu bar.
What it Does
This tool will compute a continuously varying vertical shift between two grids.
General Description
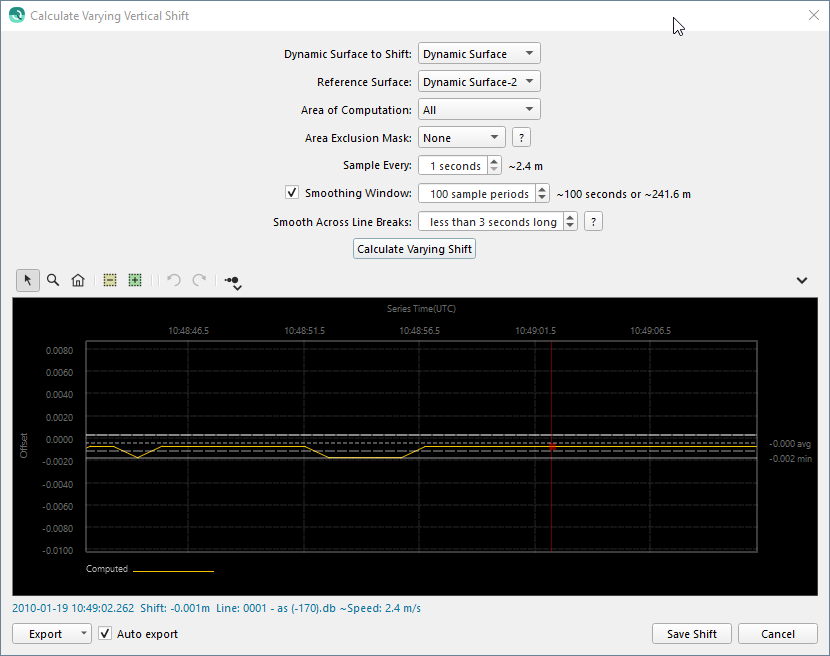
This tool computes a time-varying vertical offset between two grids using the statistical data generated by a traditional grid difference. The main advantage of this particular tool is that it examines the ping point cloud data in the Dynamic Grid that you wish to shift and uses this to determine the optimal shift along the navigation track, allowing the shift to thus vary along track. This can be used to correct for a number of dynamic errors such as tide drift, heave bandwidth, or just differences in vertical referencing in between successive surveys. The tool is designed to work optimally, for the moment, for long linear corridor surveys such as those running along a pipe or cable route where the survey must be matched against a previous survey to assess changes in seabed conditions in the vicinity of the pipe or cable.
You can select a line object in the scene to use as an Area Exclusion Mask. This will mask out areas you don't want to be part of the statistical computation. For example, if the primary survey contains rock dumping and the reference grid does not, you can mask out the area of the rock dumping which allows the algorithm to compute more accurate statistics. The results are computed as a time-series of vertical shifts for all the lines that contribute to the Dynamic Grid, this is done at a fixed time interval and you can smooth the output as well within the tool. There is also the capability to allow for joins across survey lines along the route as long as the time gap between the lines does not exceed the specified tolerance for interpolation across a file boundary. Once you save the results using the Save Shift button, the results will be stored for each file as a time-series of shifts that can be reviewed and edited in the time-series editor as a "Height Shift" time-series. Qimera will prompt you to reprocess the relevant files after you run the tool and every raw sonar file that is part of the Dynamic Grid you are shifting will have a continuous vertical shift applied on a ping-by-ping basis. Qimera will then prompt you to update all Dynamic Grids containing the affected lines. A statistical summary of each file's continuous shifts can be reviewed in the Processing Settings Dialog.
For more information on navigating the data of the plot, see the section on Qimera Plot Grids.
Toolbar

 Explore Mode
This is the primary exploration mode of the tool. As you move your cursor over the plot, the label in the lower left of the window will update to show the X/Y axis values, the current vertical offset associated with the time of the cursor position as well as the survey line at that location. The cursor in the Scene in the main app will also update with a red cursor for the synchronized location along the survey line's navigation track.
 Zoom Mode
When in zoom mode, simply click and drag an area of the plot to zoom into. Click the Home button to return to the full extents of the data. At any time, you can Shift-Click to drag the plot to a new location, you can also re-position with a middle mouse click. This is especially useful when you are zoomed in.
 Zoom Out Button
If you have zoomed into an area of the plot, this button will zoom out to the extents of the data.
 Interpolation Edit Mode
If you Click-Drag a selection of the time series, Qimera will flag the selected samples invalid and interpolate across the selection using the sample on either side of the selected area. During processing, time series data queries will then use these new interpolated values. This is a simple way to get rid of spikes in your data. You can always undo an edit using the Undo button. Once you are satisfied with your edits, you must press the Save button. Note that you can do further editing of the height shift in the Time-Series Editor.
 Validate Edit Mode
This mode is an easy way to bring back data that you have marked as rejected or for interpolation. Simply Click-Drag a selection over the previous edit and Qimera will restore the original data. You can always undo an edit using the Undo button. Once you are satisfied with your edits, you must press the Save button.
 Undo Button
This will undo the last edit actions. It is a pseudo-infinite undo buffer in that you can make several edits in sequence and then undo those edits in the reverse sequence.
 Redo Button
This will redo the last undo edit action.
 Plot Point Size
Clicking this icon will change the point size drawn in the widget. If you click and hold the button, it will display a menu where you can select point sizes between Small and XX-Large. Simply clicking will cycle through all sizes.
 Menu
Menu
Show Current Offset
If you have previously run this tool, this option allows you to control whether or not the previously computed offset is shown in the plot or not. If shown, it is drawn in blue.
Show Statistics
This option allows you to show summary statistics of the time-series of shifts on the graph. It will show the mean, min, max and +/- 1-sigma standard deviation. These are drawn as dashed lines in the graph along with numeric labels on the right-hand side of the plot.
Show Gridlines
This option controls the display of grid lines on the time-series graph.
Dynamic Grid to Shift
Use this combo box to select the Dynamic Grid you wish to shift. It will set the Dynamic Grid you had selected in the Project Layers Dock when you launched the tool.
Reference Grid
Use this combo box to select the reference grid.
Area of Computation
Use this combo box to selected either Everywhere or Inside Selection to constrain where the algorithm runs the grid difference computation. Selecting the Inside Selection option will shift the source pings of all footprints that fall within the selected area. If a ping has footprints that fall inside and outside the selection area all of the footprints will be shifted for that ping.
Area Exclusion Mask
Use this combo box to select a line object from the Project Layers Dock that can be used to mask out areas that you don't want used by the grid difference computation.
Sample Every
Use this numeric entry field to specify the time interval over which a time-series shift should be computed. The default is 1-sec, meaning that the ping data will be traversed at 1-sec intervals and each ping that is found at this interval is then used to compare against the reference grid.
Smoothing Window
Use this numeric entry field and checkbox to enable smoothing of the raw vertical shift time-series. This is enabled by default to always give a smooth time-series of vertical shifts such that large jumps will not be observed. When you update the value in the box, the time-series graph will update. You may want to consider making image exports of the unfiltered time-series for reporting, as well as the smoothed time-series.
Smooth Across Line Breaks
This option allows you to smooth the varying vertical shift results across the small gaps that sometimes occur when logging stops and starts along a survey line. If set to "Never", each line's shift time-series is smoothed in isolation without benefit of the survey line before and after, resulting in steps and reduced smoothing at the start and end of each line. The time window parameter controls the decision on whether the stop of one line and the start of another line are close enough in time to smooth across.
Export Button
Export to ASCII...
This option allows you to save the entire time-series of vertical shifts as an ASCII output for reporting or further analysis. This is useful in the tool since it exports the time-series for all of the survey lines together in a single export.
Export Plot as Image...
This option allows you to save a view of the time-series graph as an image for reporting purposes. This is useful in the tool since it plots the time-series for all of the survey lines together in a single graph.
Export Window as Image...
This option will export the entire contents of the dialog as an image. This is useful for an overview for reporting.
Export Scene as Image...
This option will export the main Qimera window scene work area as an image.
Export All...
This option will launch a dialog and allow you to specify the location and items you would like to export. The selectable list contains the content listed under 'Export Button'.
Auto Export Checkbox
Selecting this box will automatically save all of the listed exports under the Export Button to a unique timestamp folder in the current projects export directory.
Cancel Button
This button will cancel the operation and exit the dialog.
Save Shift Button
Click this button to run the continuous shift computation.
Return to: Qimera Dynamic Grid Shifting Tools
Return to: Qimera Table of Contents