

How to Start
-
Compute Grid Statistics option of the Dynamic Grid Context Menu in the Project Layers dock.
What it Does
This dialog displays statistical information about the selected grid or selection.
General Description
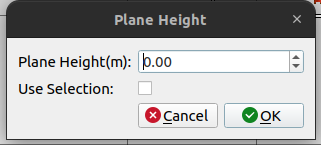
The Grid Statistics dialog functions similarly to a wizard, guiding you through the necessary steps. Initially, an input dialog with a spin box will appear, allowing you to select the desired depth above or below the reference plane. The spin box enables you to specify a plane other than the default value of 0.0. This plane height is crucial for the Survey Area and volume calculations, as it determines the area and volume above or below the selected plane.
Once you’ve entered the plane height, the main Grid Statistics dialog box will be displayed, as shown in the figure above. The left text box provides detailed Grid Information, while the right text box presents Attribute Statistics. Below these two sections, a histogram of the data is displayed for further analysis.
By default the statistics will be computed for the entire grid. If you selected a rectangular area from the main window before bringing up this dialog then the "Use Selection" checkbox will be enabled but will NOT be toggled ON by default. You must choose “Use Selection“ to use the constrained area as an additional step.
The Attribute dropdown box is used to select which Attribute Statistics are shown in the right text box and the histogram. Additionally, some layers have an Attribute Threshold option, allowing a threshold to be specified for that layer. This threshold is calculated and displayed in the Attribute Statistics.
Underneath the histogram, you can specify what percentage of the given data you want highlighted. The Cursor field shows the bin average when you hover over the histogram. The bin highlight is shown as a red line.
THU/TVU and Slope Corrected Uncertainty need to run additional calculations, therefore, the statistics for those are calculated on demand. Initially, "Compute TVU/THU" and "Compute Slope Corrected Uncertainty" are the options in the Attribute dropdown. Once they are run once, their name in the dropdown changes to be "THU/TVU" / "Slope Corrected Uncertainty".
The Export dropdown offers the three options for Grid Statistics exports:
-
Save Text: Saves the information displayed in the Grid Information and Attribute Statistics boxes.
-
Export Window as Image: Saves the entire Grid Statistics window as either a PNG or JPEG image.
-
Export Histogram to ASCII: Saves the information displayed in the Grid Information and Attribute Statistics boxes and appends the data in the histogram in CSV format.
The histogram image can be saved by right-clicking the context menu over the histogram.
The Percentage of grid cells filled / Filled Cells / Empty Cells only show when a selection is made.
The Cell Size shows variable precision depending if the data is geographic or projected. Note that as typical for calculations in geographic coordinate systems, the average latitude is used for calculating the cell sizes. It is assumed that the data is reasonably well distributed. In this case, any loss north of center is made up by excess south. For data sets with more data north or south of the midpoint, the accuracy of the result will vary with latitude and size of the data set. More northerly data sets will have more error depending on how uneven the distribution of the data is. In testing, a comparison of the same geographic data reprojected to UTM was a small fraction of one percent difference in area.
Return to: Qimera Interface
Return to: Wizards and Dialogs