
Profile Dock
The Profile Dock allows you to view a profile line over one to many grids in order to get detailed or comparative information along the line. To entire profiling mode, click the 
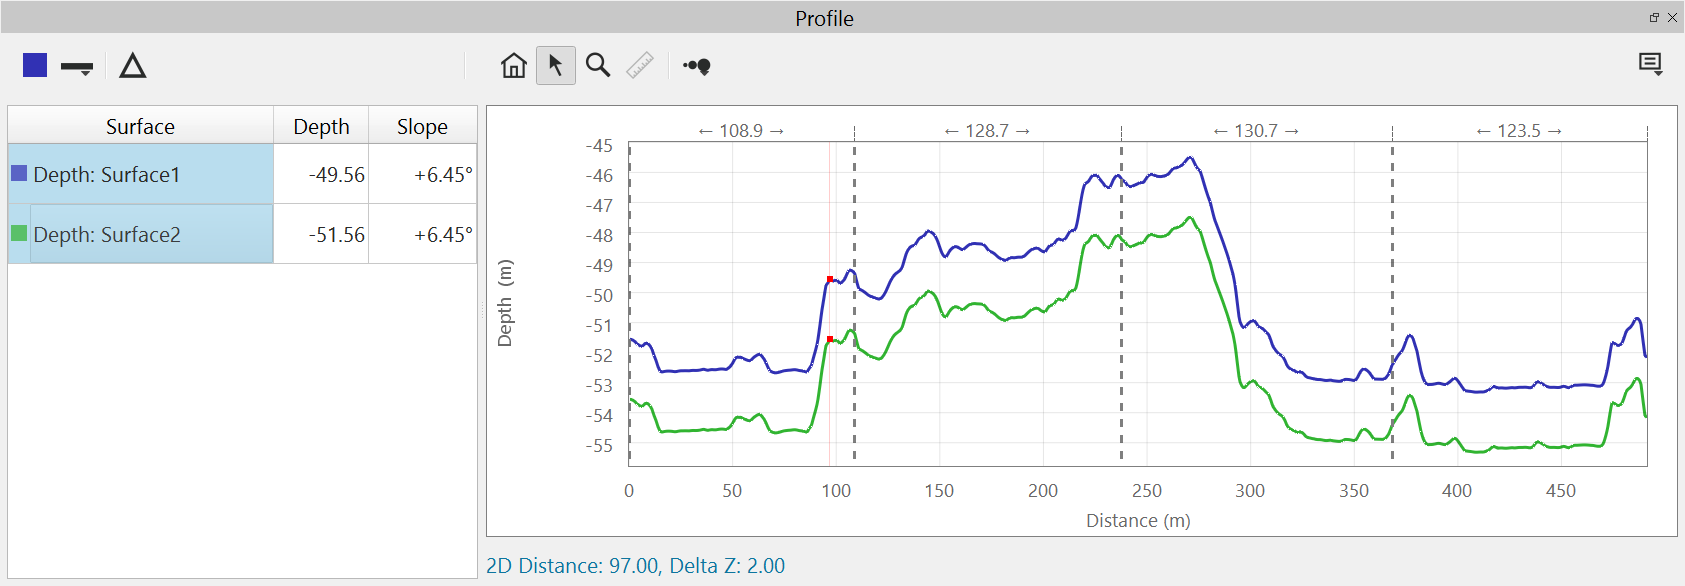
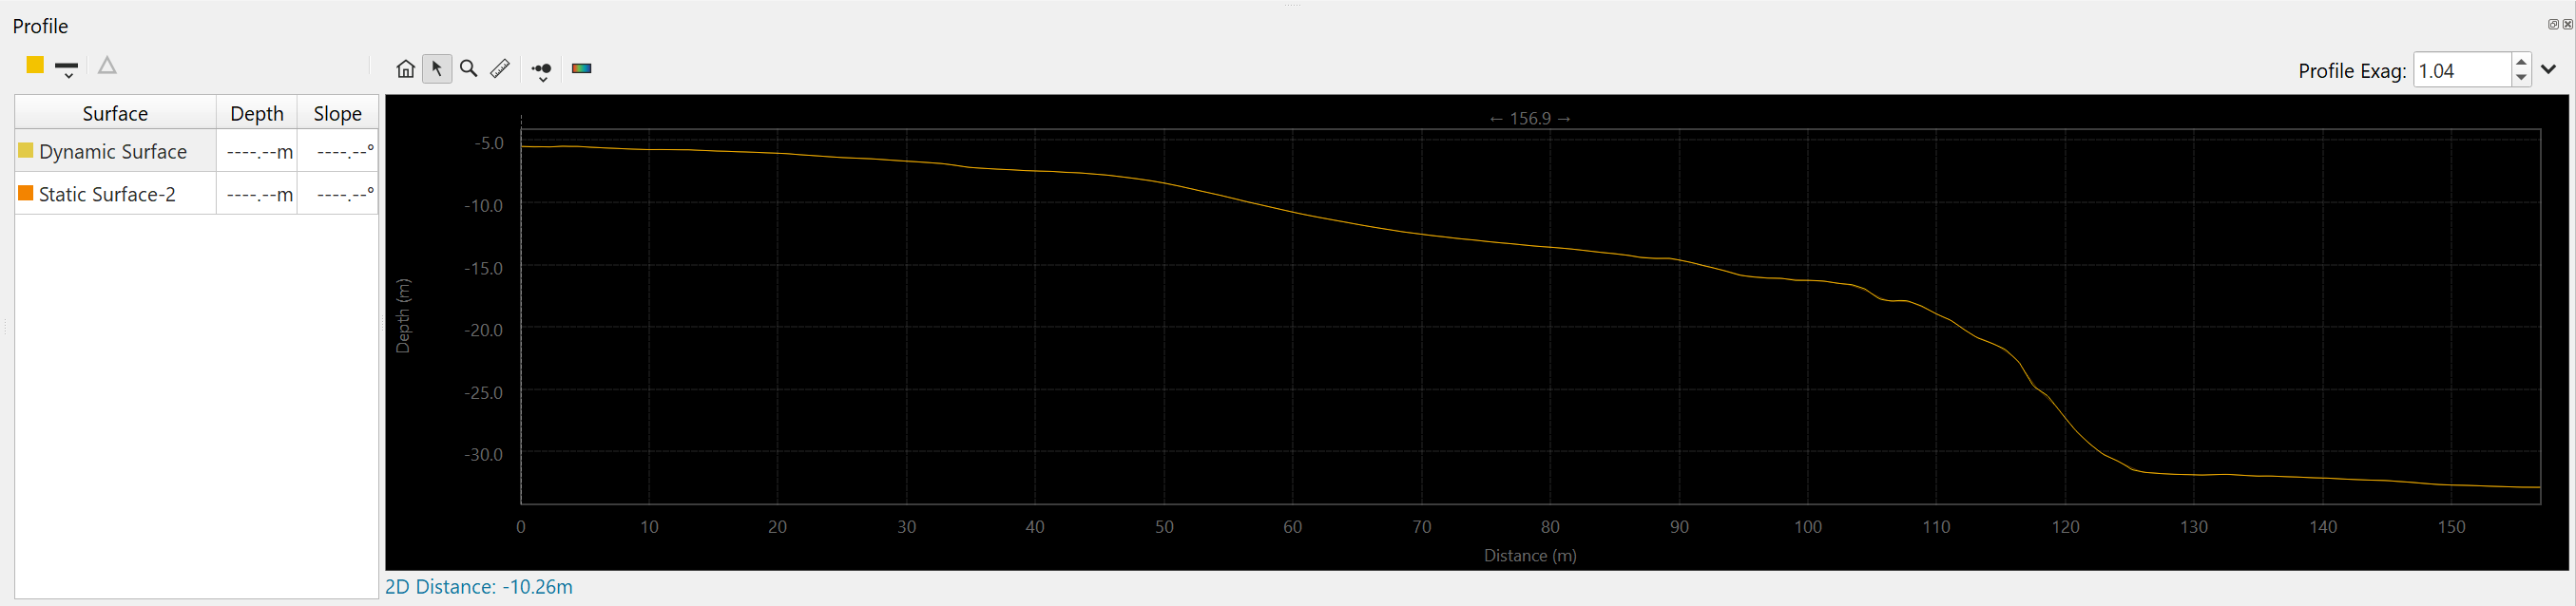
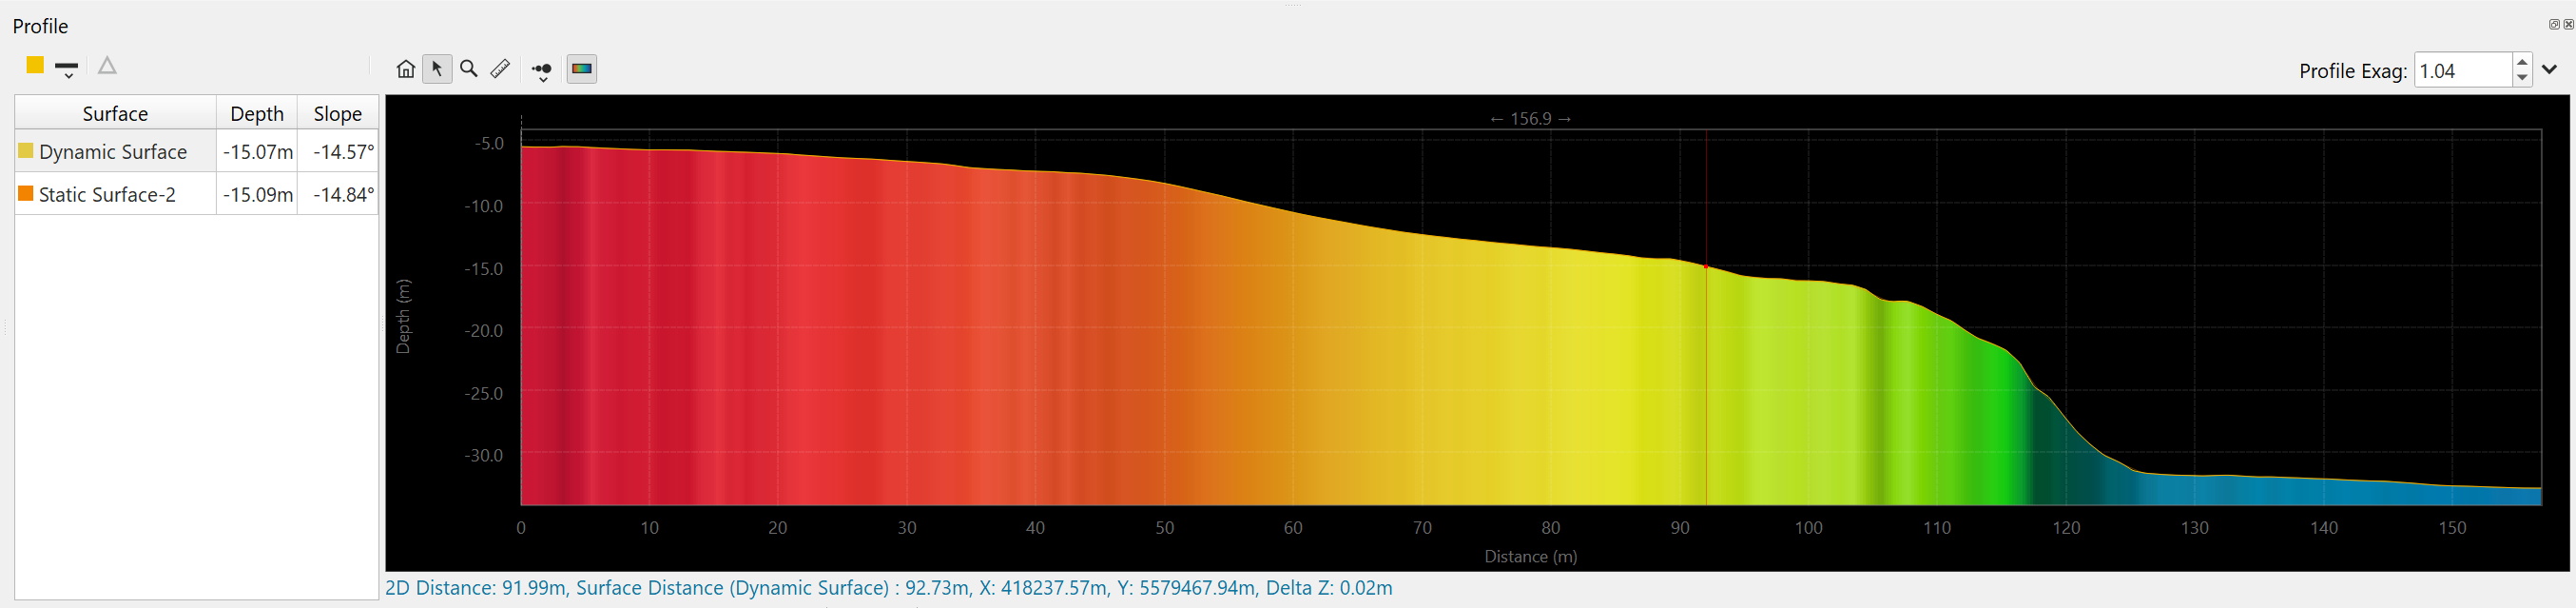
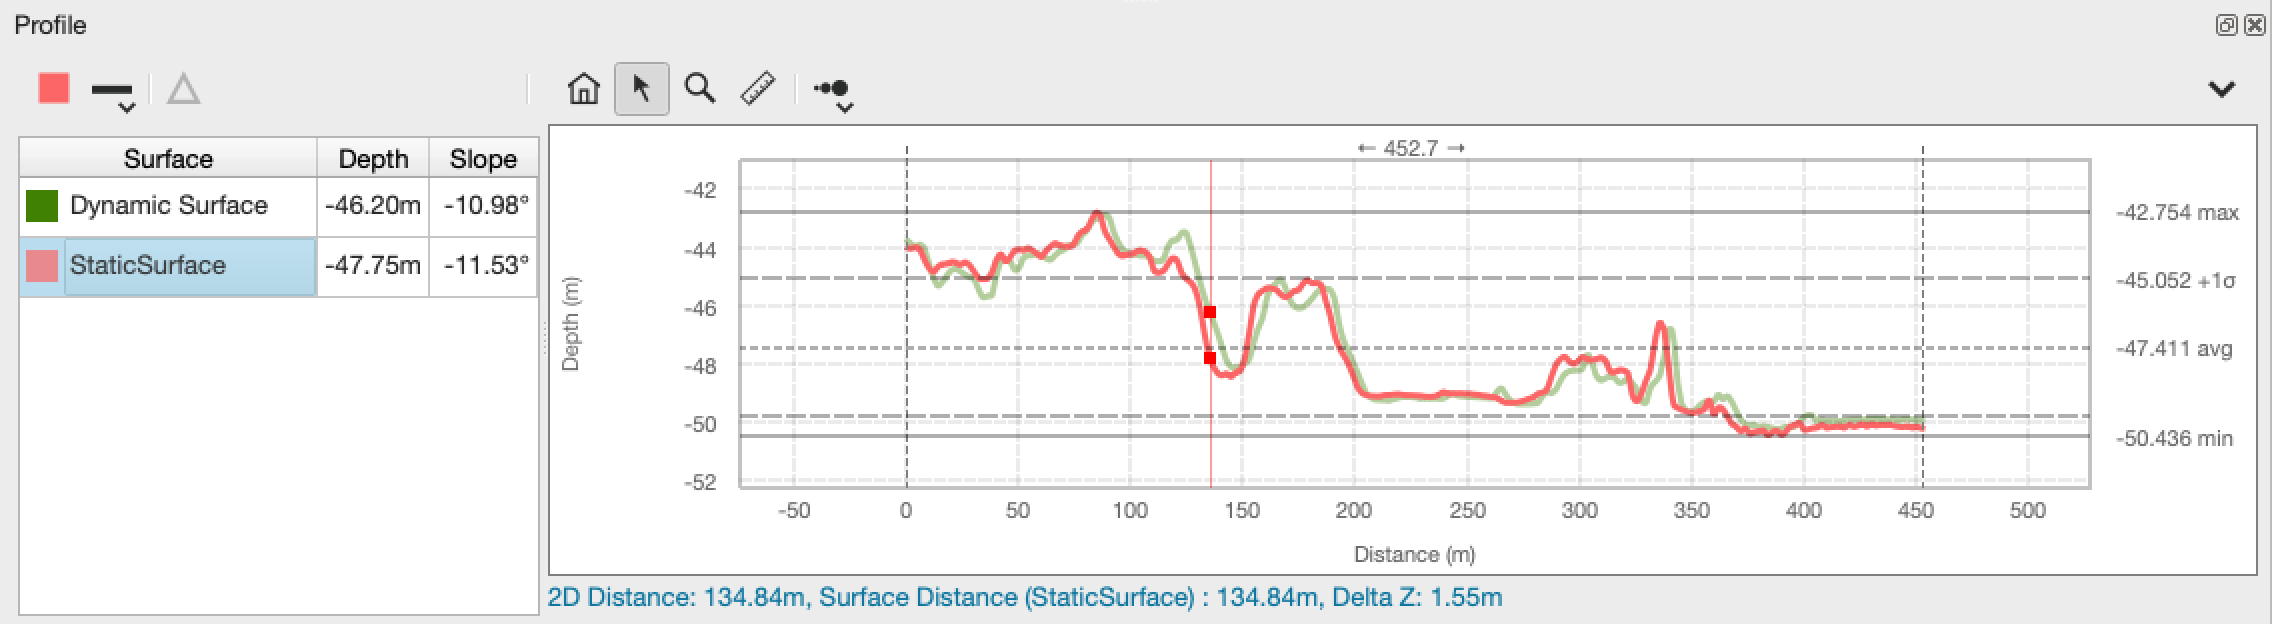
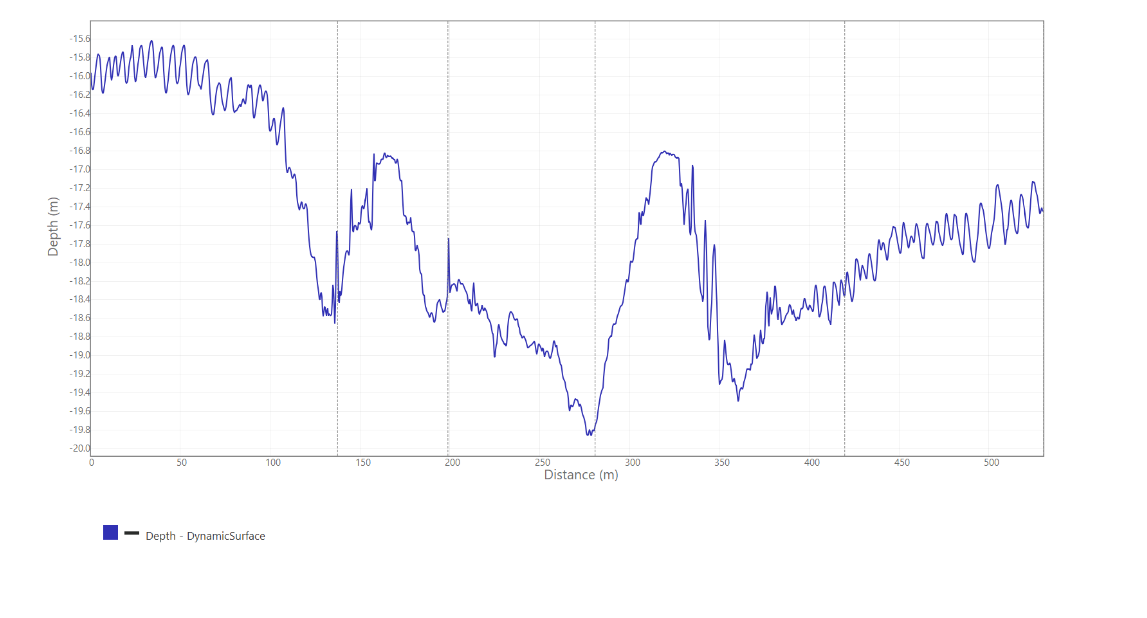
Qimera will generate a unique color-coded profile for every visible Dynamic or Static grid in the current project. If you don't want to see a profile plot, simply uncheck the grid in the Layers View. In the example above, the same grid was gridded twice, where one grid had the line data shifted down by 2 meters.
The plot grid displays the locations and spans the distance between each point using a vertical dashed line in the plot. The vertical axis is the profile depth and the X-axis is the 2D distance along the profile. As you move your cursor along the profile plot, you will also see several properties about that point displayed below the plot, including the 2D distance along the profile, the delta Z between the two grids (if exactly two grids are present), the 3D distance along the grid currently selected in the table (if any), and the KP value at the cursor position (if the project has an active route). As you move the cursor over the plot, the Depth and Slope columns of the table will update to show the values for each grid at that point.
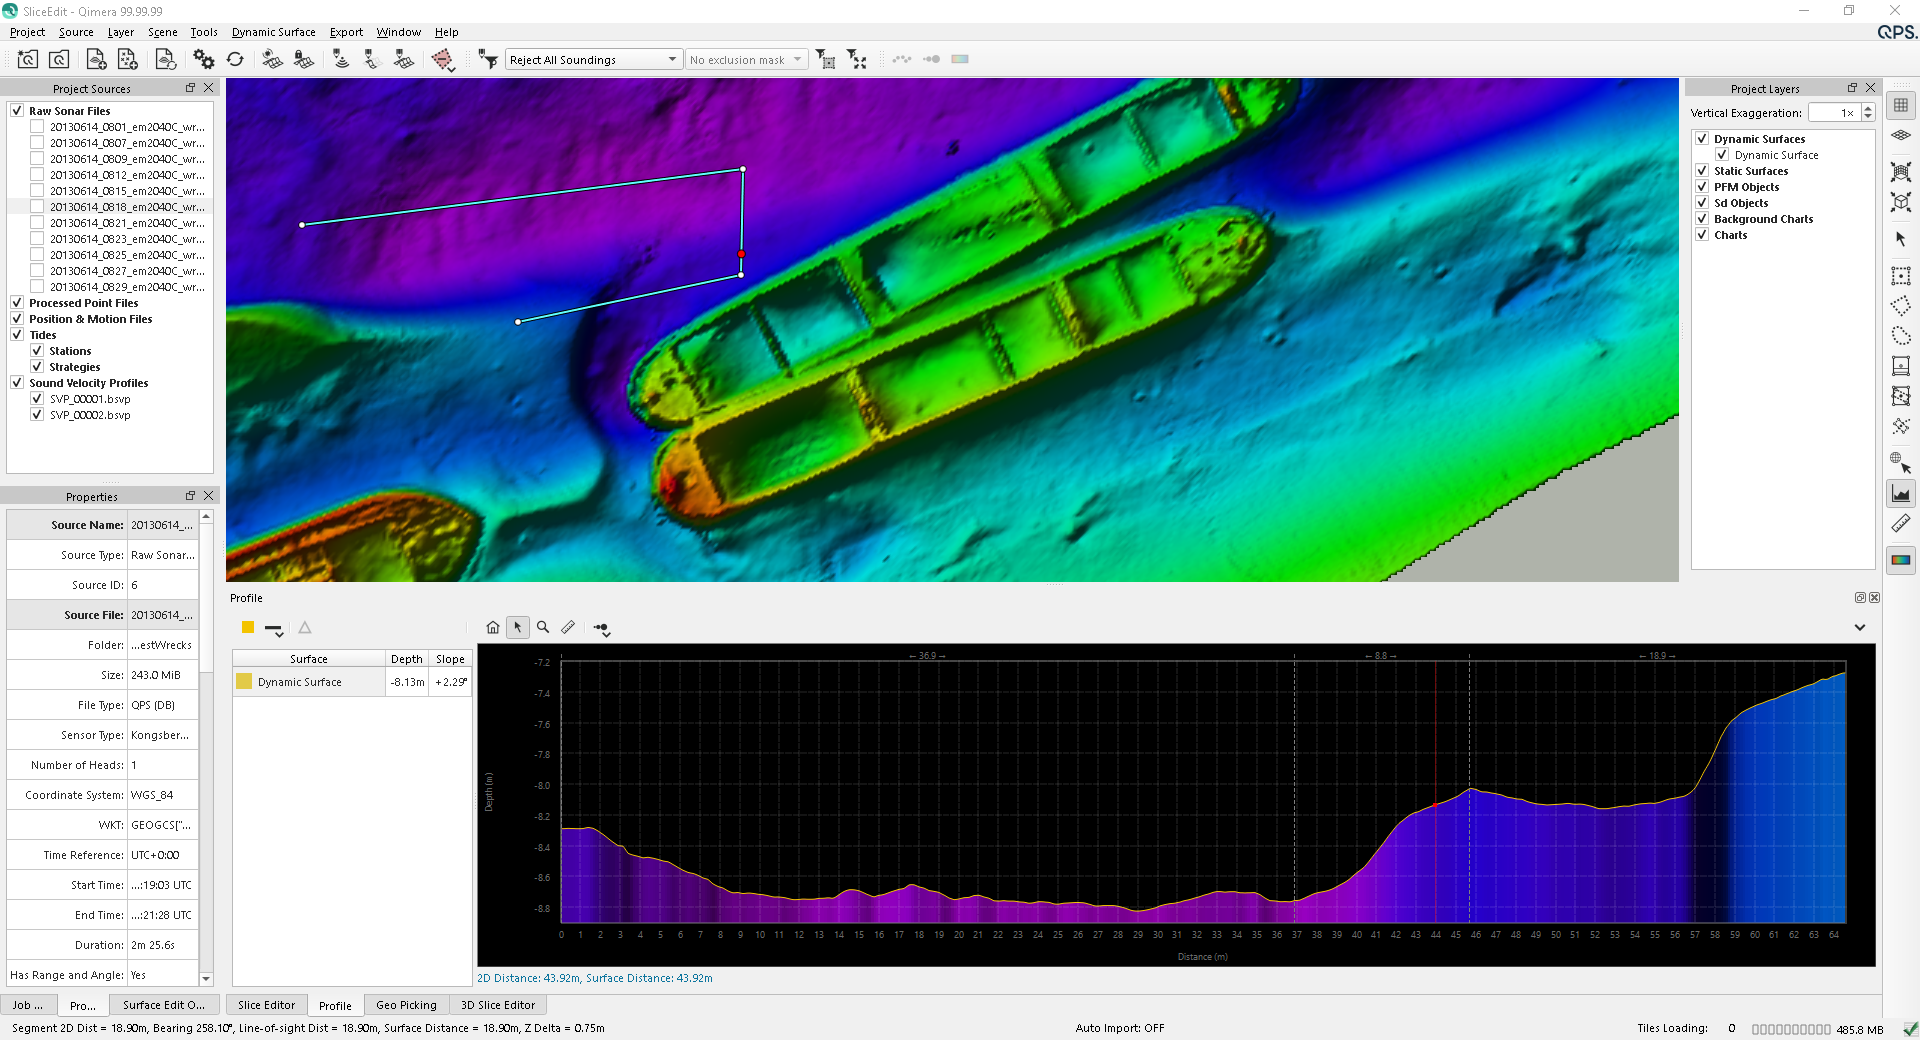
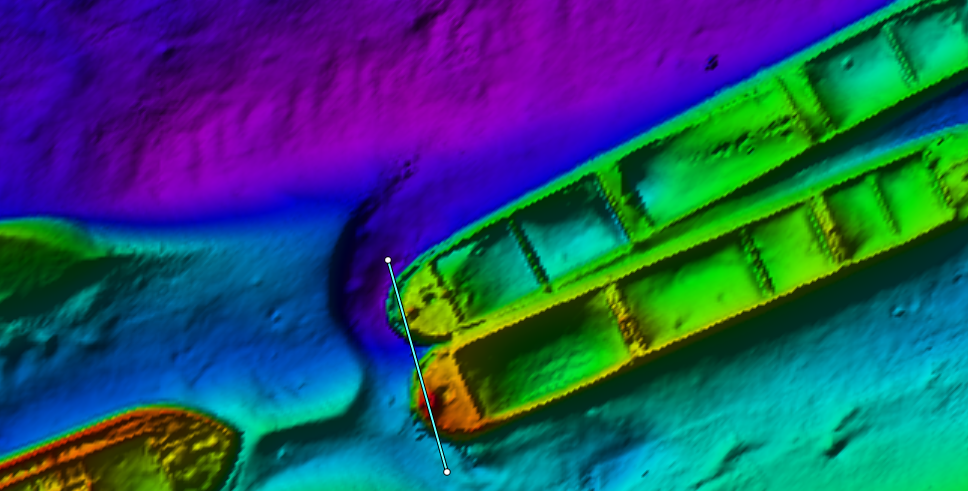
In the 4D View, the profile draws as a draped line on the topmost grid with a vertical curtain that extends up to the minimum depth. White markers are also drawn at each segment endpoint. A single red marker appears along the plot correlating to the location of the cursor in the plot area of the Profile Dock.
Profile Dock Toolbar

This button will change the color of the currently selected profile plot.
 Line Pattern Button
This button will change the line pattern of the currently selected grid. If you click and hold the button, you will see a drop down list of the choices. If you simply click, it will cycle to the next line pattern. The choices are dots, dashed line, dot-dash line, dot-dot-dash line, and solid line. For more information, please see the section on the Time Series Multiplot.
 Delta Button
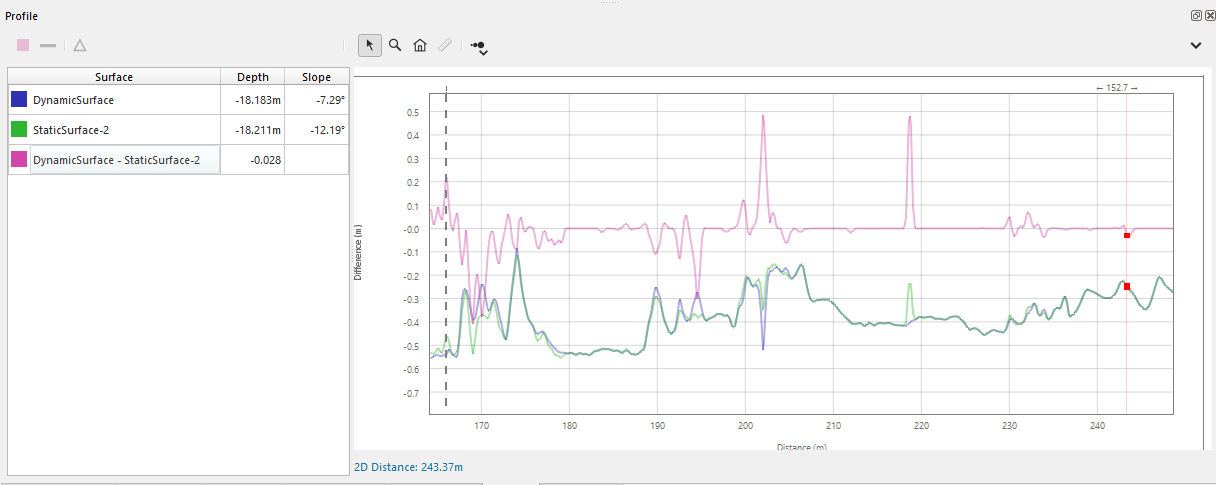
This button will compute the difference between 2 selected grids in the table view. Once you select the 2 grids, click on this button to generate a "Difference" plot. When you select the "Difference" entry from the table view, the Y scale will change for the plot showing you the vertical extents of the data. The difference scale can be set relative to the source data by selecting the newly created "Difference" profile and unchecking the 'Use Exaggerated Scale for Differences' profile menu item.
 Zoom Out Button
If you have zoomed into an area of the plot, this button will zoom out to the extents of the currently viewed attributes. All attributes share the same time axis.
 Explore Mode
This is the primary exploration mode of the tool. As you move your cursor over the plot, the label in the lower left of the window will update to show the current time and value of the selected attributes. A tracking ball will follow the location in time along the currently selected track in the 4D View. If you click/drag the plot grid, you can pan around the data. The mouse-wheel will zoom in/out of the plot.
 Zoom Mode
When in zoom mode, simply click and drag an area of the plot to zoom into. Click the Home button to return to the full extents of the data. At any time, you can shift-click to drag the plot to a new location. For more information on plotting grid navigation, see the appendix section found here.
 Measure Mode
This mode will allow you to measure along a profile. First, you must select a grid from the table view. Then left-click and drag in the plot area to measure between 2 points on the profile. As you drag, you will see corresponding red markers indicating the start and end of your measure in the plot and 4D View. Below the plot you will see specific details about the measurement. These include 2D Distance, grid Distance, Line-of-Sight Distance Line-of-Sight slope, and Delta Z.
Profile Measure in Profile Dock
Profile Measure in 4D Scene
 Point Size
This button will allow you to change the size of the plotted points and lines. Sizes range from Small to XX-Large. Clicking on the button will cycle to the next size. Click and hold to get a drop down menu of sizes to choose.
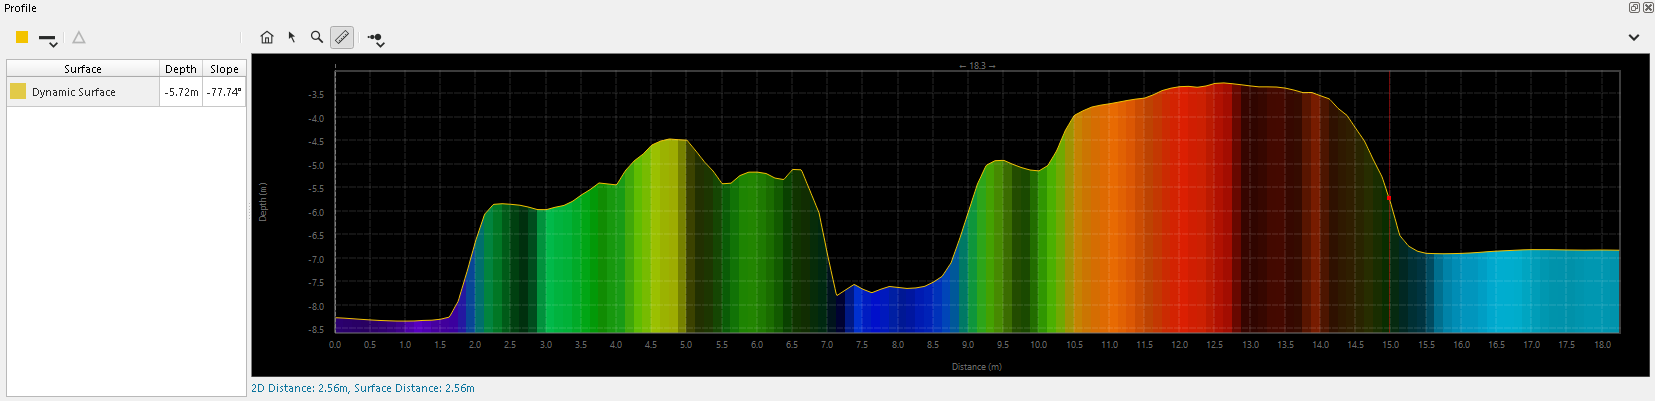
 Show Color Map
This will turn the color map fill of the currently selected profile on or off.
 Profile and Cross Profile Vertical Exaggeration
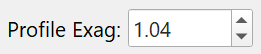
The spin box on the right hand side of the toolbar control the vertical exaggeration scale for the profile graph. Using the Zoom Tool or clicking the Zoom Out Button will automatically adjust the vertical exaggeration scale to fit the selected area or default view accordingly. Vertical exaggeration scale cannot be adjusted while Lock Depth Scale is turned on.
 Profile Menu
Show Statistics
This setting turns on the statistics view for the currently selection profile. It will show the minimum and maximum as solid lines, the +/- 1-Sigma as dashed lines and the average as a dotted line. Value labels will appear on the right side of the tool.
Export to ASCII
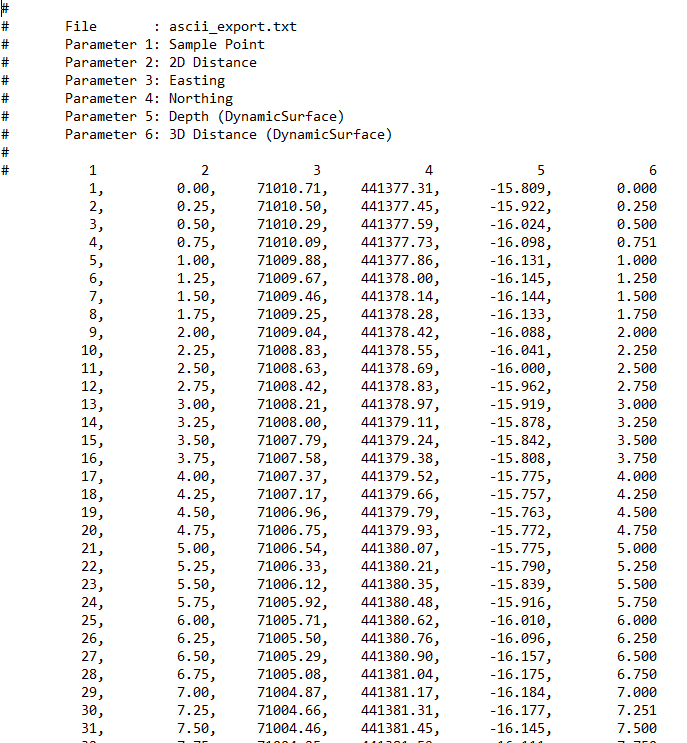
This will export to an ASCII file with data about the profile. The default folder is the ~myproject/Export folder. The ASCII file will contain Sample Point, 2D Distance, Easting, Northing, Depth and grid Distance for each grid in the Profile Dock. If the project has a route, the KP value of each point will be included as well.
A sample export is shown below.
Profile Dock
Save Plot to Image
This will save the current Profile Plot to an image file. The file type by default is PNG. The default folder is the ~myproject/Export folder. The first image below is the configuration of the Plot before export. The next image is the exported image. Notice that Qimera includes the color and line pattern legend.
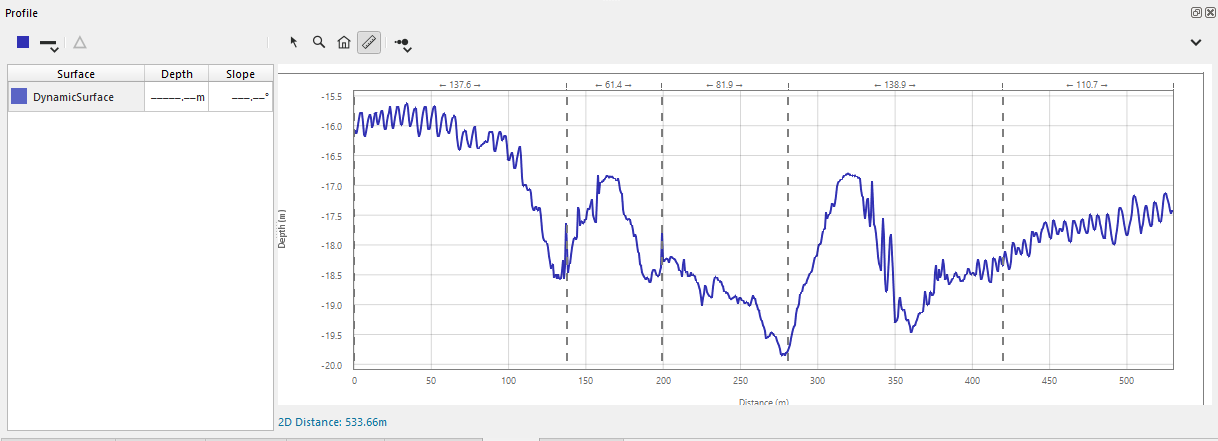
Plot to Export
Exported Plot Image
Show Gridlines
This option will show/hide the grid lines in the plot area.
Lock Depth Scale
This will lock the current Y plot range (Depth) so that when you create a new profile over flatter terrain, it doesn't overly exaggerate small details. This allows you to more easily see areas of high depth range. If the new profile contains depths above or below your currently "locked" range, the range will be extended to encompass these new depths so that you don't have to zoom out to see them.
Clear Differences
This will clear the current difference plots from the grid Table. If you create a new profile, difference plots will be automatically cleared.
Use Exaggerate Scale Difference
With the box checked an exaggerated scale will be used causing the selected difference plot data to extend to the bounds of the plot. With the box unchecked the difference series will use the same scale as the two source items used to create the difference series. This item will only be enabled if there is a difference series created.