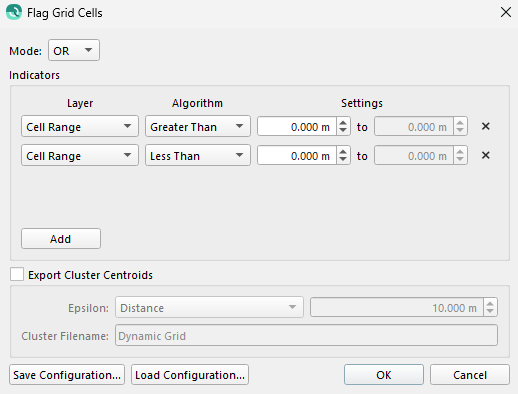
Qimera Flag Grid Cells

How to Start
Right-click on a Dynamic Grid, Grid Operation, and Flag Grid Cells. You can also use the shortcut ctrl + alt + f.
What it Does
The dialog sets which cells in a grid should be flagged. After setting the indicators here, you can view the flagged grid cells by changing the Color By or Highlight By settings on the grid to Cell of Interest. The slice editor can also be colored by the cell of interest Qimera Slice Editor Dock | [inlineExtension]-Plot-Color-By.
General Description
Mode
Set to AND if all indicators must be true for a cell to be flagged. Set to OR if just one of the indicators must be true for a cell to be flag.
Indicators
Indicators are the conditions that must be satisfied for a cell to be flagged. To add a new indicator, click the add button and update the desired layer, algorithm and range. These can later be removed using the 'X'.
Export Cluster Centroids
Checking export cluster centroids will perform a clustering algorithm and produce a points object that can be used to geolocate groups of flagged cells. The epsilon parameter can be used to define the maximum distance between two samples for them to be considered in the same group. The file name defines the points object's name that will be automatically added to the project when the operation is complete. The points can then be loaded into the geo pick tool Qimera Project Layers Dock | SdObjectContextMenu.
Save and Load Configuration
You can save the dialog options into a xml file using the Save Configuration button. You can then reload the configuration using the Load Configuration button. This will automatically populate the mode, indicators, and export settings you previously used.
