How-to Shift Time Series Observations
This How-to is a step-by-step description for using the shift tools in the Time Series Editor, available from Qimera 2.3 and up.
This tool can fix time series observations problems, e.g. height jumps.
On this page:
Introduction
Time Series Editor is used in addition to other Qimera tools to QC and trouble shoot data. The Time Series Editor is a graphical view of the time series (extracted from raw sensor data). The tool plots the measurements from all sensors associated with the particular source item. For example, if you have a source file with two motion sensors, the data from both sensors will be displayed simultaneously. More info can be found in:Qimera Time Series Editor Dock.
There are two ways of shifting time series observations, there is the insert option which allows you to enter a sample data before the start of the series or at the end of the series. It will also allow you to replace an observation which has been interpolated or marked as invalid. Next to that there is the shift option which allows the you to shift a selection of time series to a new desired location.
Good to know
It is not possible to insert new observations in the time series, it is only possible to enter a sample data at the start and at the end of the series, or replace an existing one.
Step-by-Step guide
Step 1 - Assess Your Data
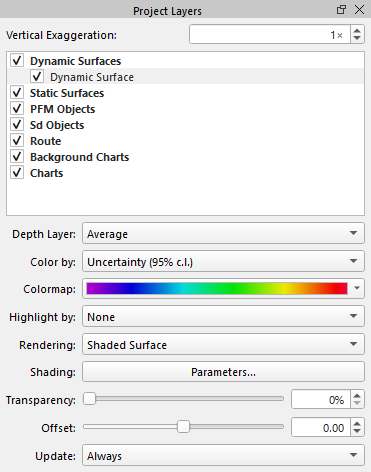
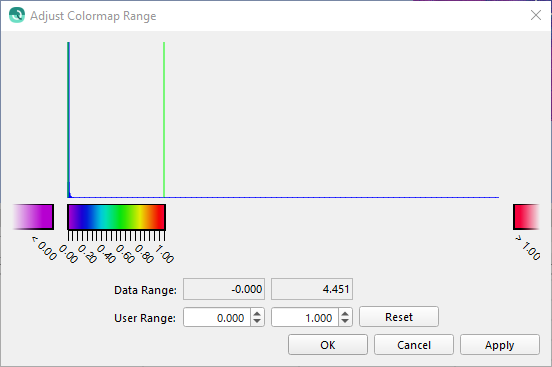
Determine the line that requires Time Series improvement by assessing the data/survey. A good way to visualize any errors in your data is to set the Dynamic Surface attribute to 'Color by' Uncertainty (95% c.l.), and then adjust the colormap to emphasize outliers. The Adjust Colormap Range dialog will come up, you can left-click and right-click on either side of the histogram to adjust the range.
Step 2 - Save a Before Image
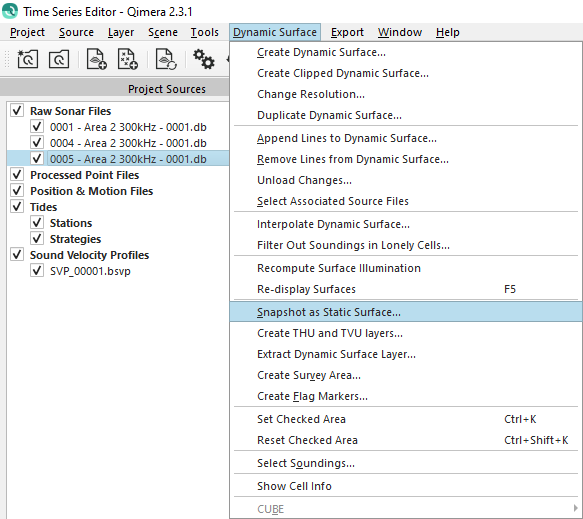
It is a suggested best practice to help you assess the results of the algorithm by capturing a snapshot of the results before any changes are done.
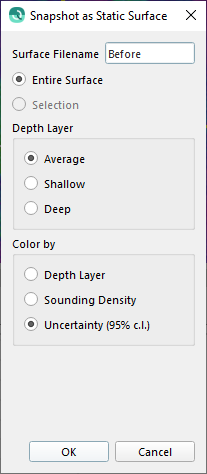
From the Dynamic Surface menu select 'Snapshot as Static Surface' so a Static Surface is generated. You will be prompted to define a name and attributes.
Step 3 - Select the Data that needs Shifting
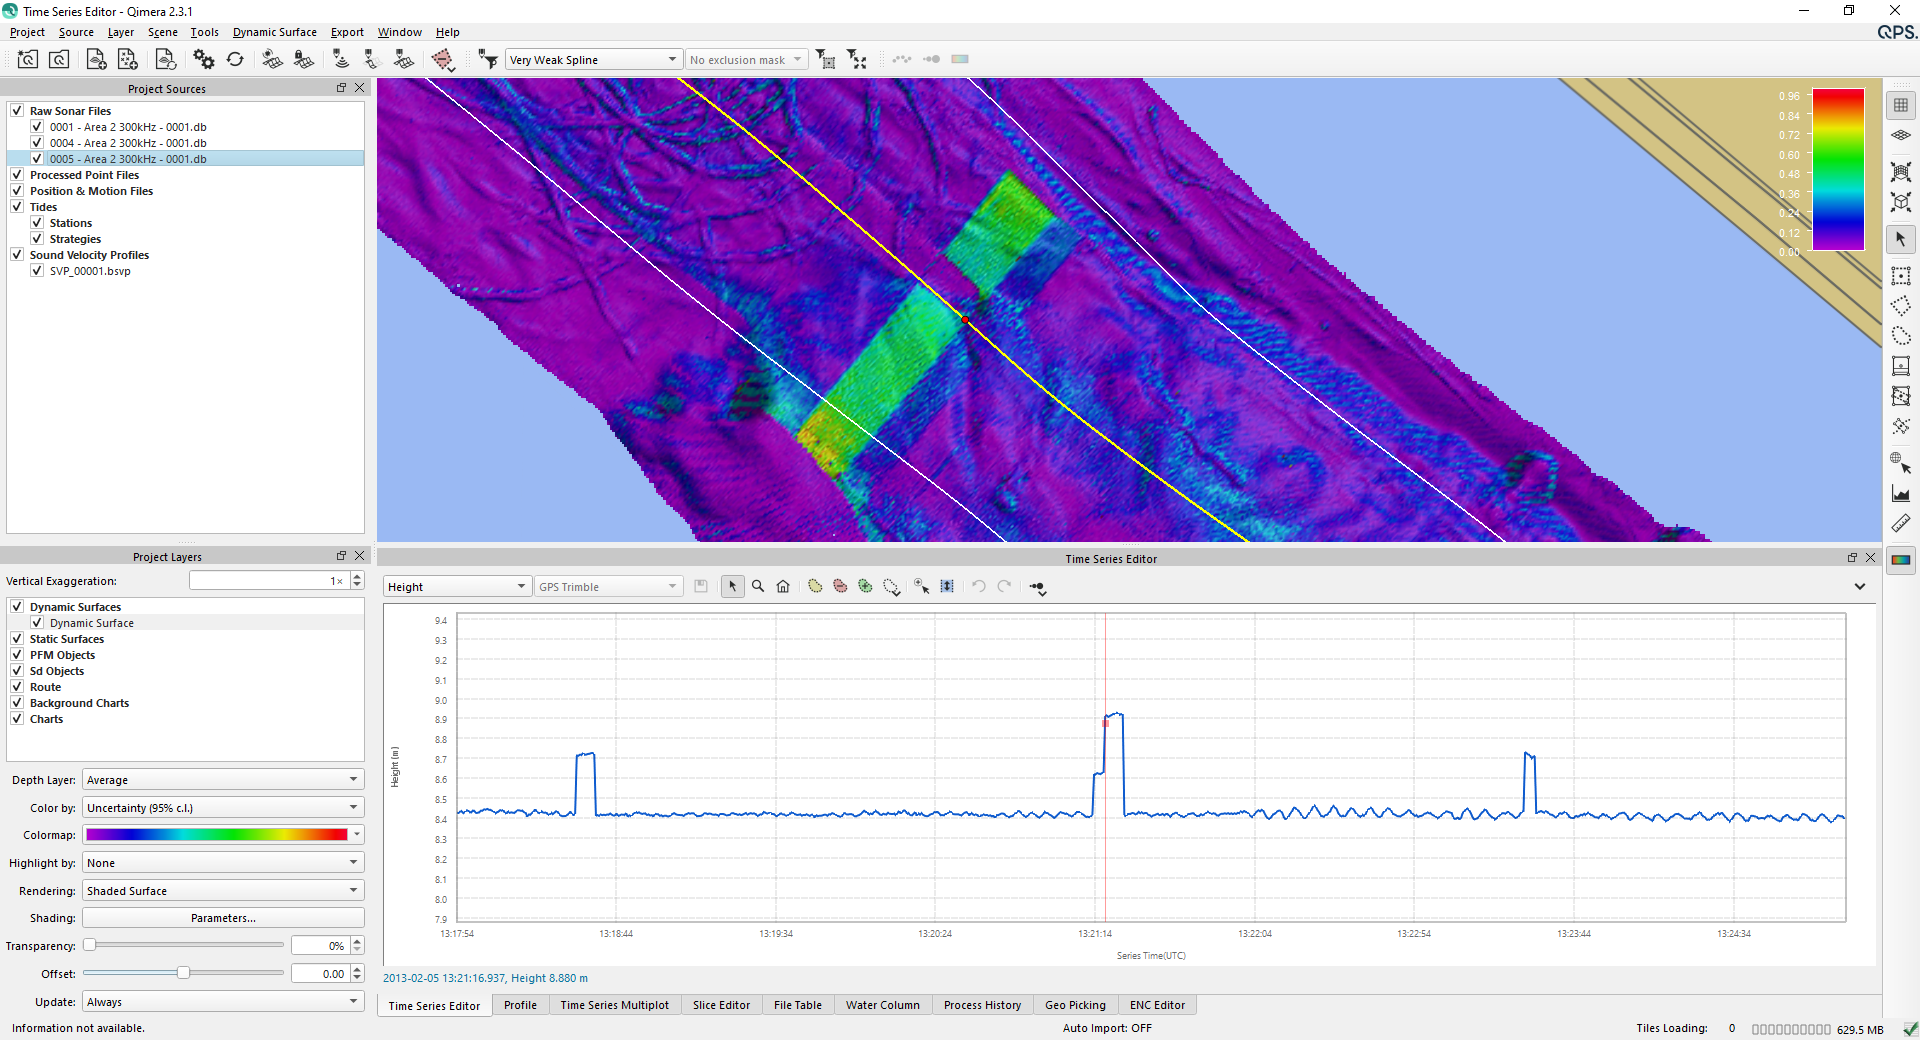
When a problem area is detected, the file (reflecting the area) needs to be selected and the Time Series Editor dock opened so the time series can be adjusted. With the combo Boxes the attribute that is causing the problem can selected.
Step 4 - Use the Tools
There are two ways to edit the time series observations to a new location.
Sample range shift
Insert sample
Sample range shift
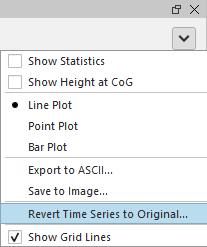
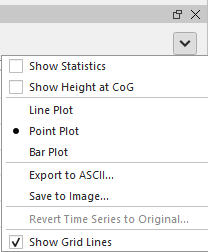
To make the observations more visible the plot can be changed from lines to points, this can be found under the drop down menu in the top right corner of the Time Series editor window.
Select the 'Select sample range to shift' 

After the selection the observations which are selected by the Sample range shift tool are marked cyan. From here the observations can be moved to the new location. The original observations are marked with a blue dotted line.

Select the save icon 
Insert sample
For this tool it could be easier to use the line plot.
To determine the new observation the original observation should be marked as invalid or ignored by de use of the selections tools in the Time Series editor toolbar. If marked invalid is used Qimera will then interpolated between the last and first valid observation.


As can be noticed in the image above the interpolated will be one line, the user can use the 'Insert Sample' tool to overrule the interpolation with a new observation.
Select the 'Insert Sample' tool 

From here on the time of the original observation a new observation can be defined. The new observation will be marked cyan and the interpolation line to the next observation are drawn as well. The original observations are marked with a blue dotted line.

Select the save icon 
Step 5 - Assess your Results
The reprocessing of the sounding results that occurs after completion of the algorithm run in Step 4 will trigger the automatic update of any Dynamic Surfaces that use the selected lines. This is why it is helpful to have a Snapshot surface first, you can compare the results before and after the tool is run.
In the 4D scene you can review the latest result of the Dynamic Surface.
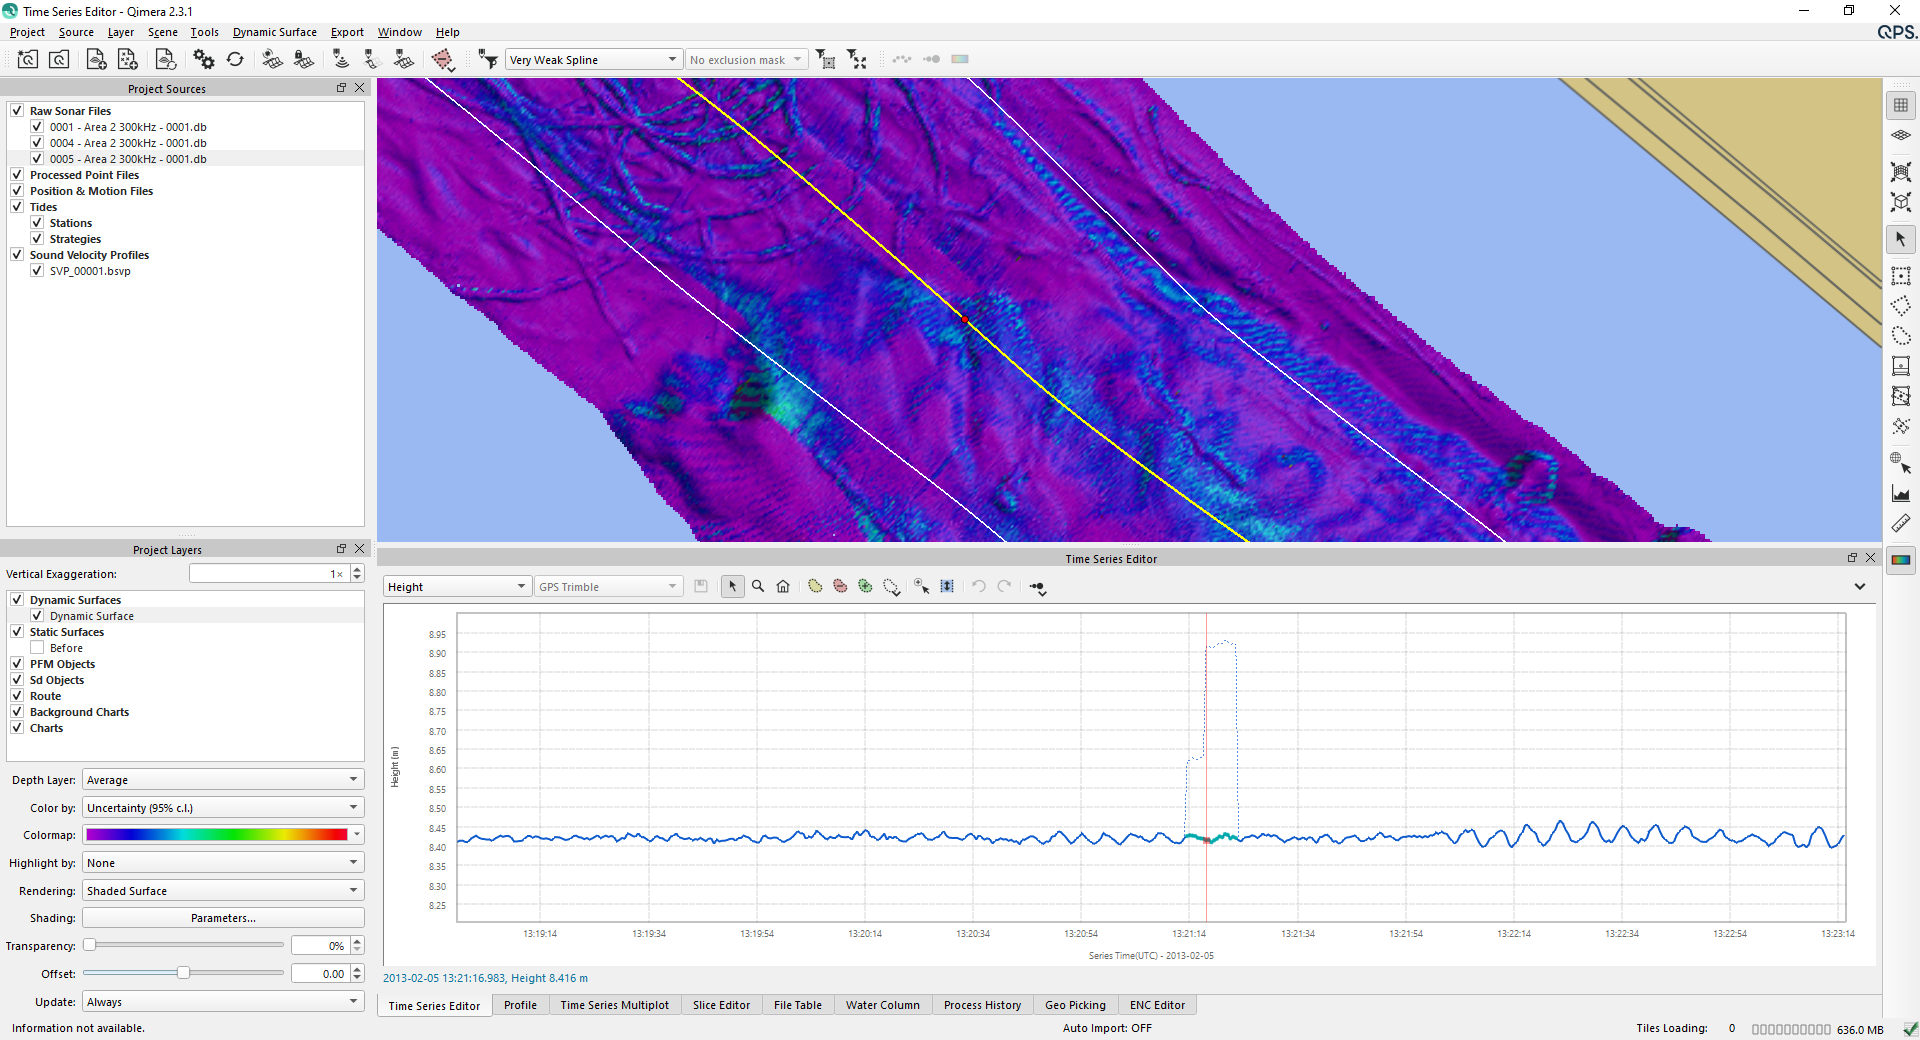
It is also possible to generate a profile to see the difference of the new surface compared to the original surface. To generate a profile right click and drag on the surface.
In order to show both surfaces in the profile dock, make sure both surfaces are enabled in the project layers.

Revert to original
Notice that you are always able to revert back to the original time series. This can be found under the drop down menu in the top right corner of the Time Series editor window. This will result in reprocessing of the selected file.
