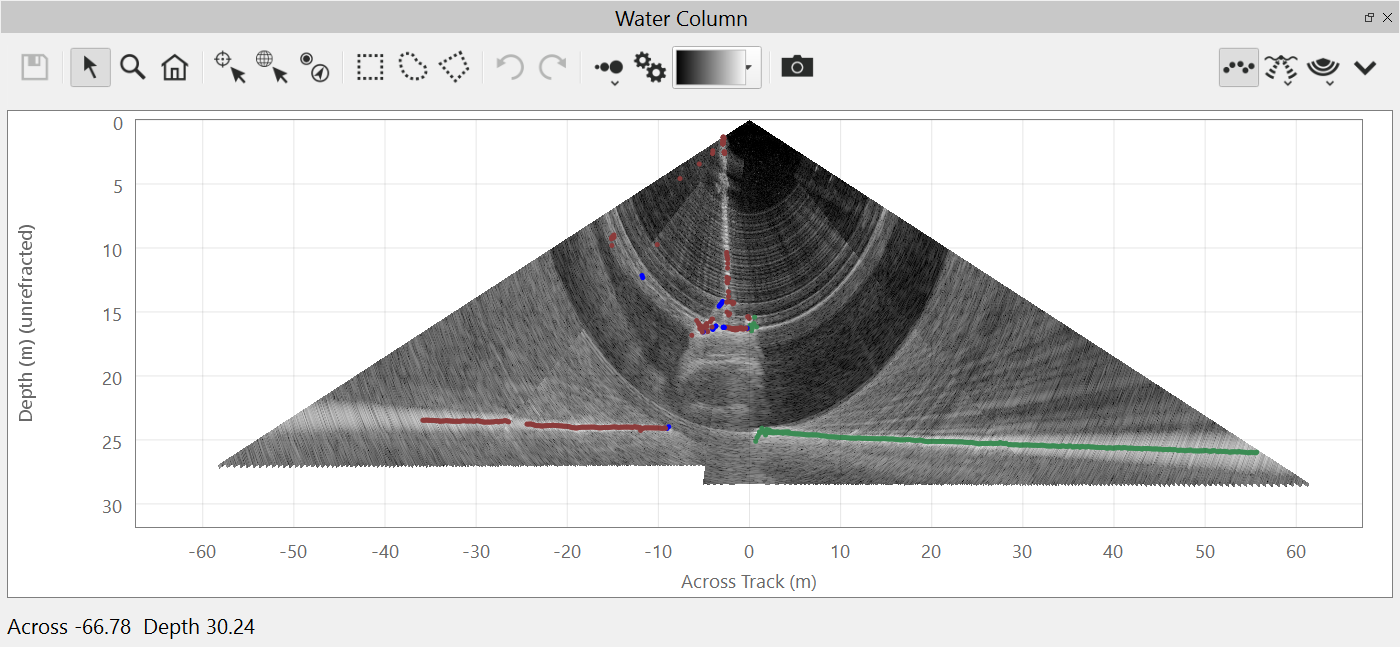
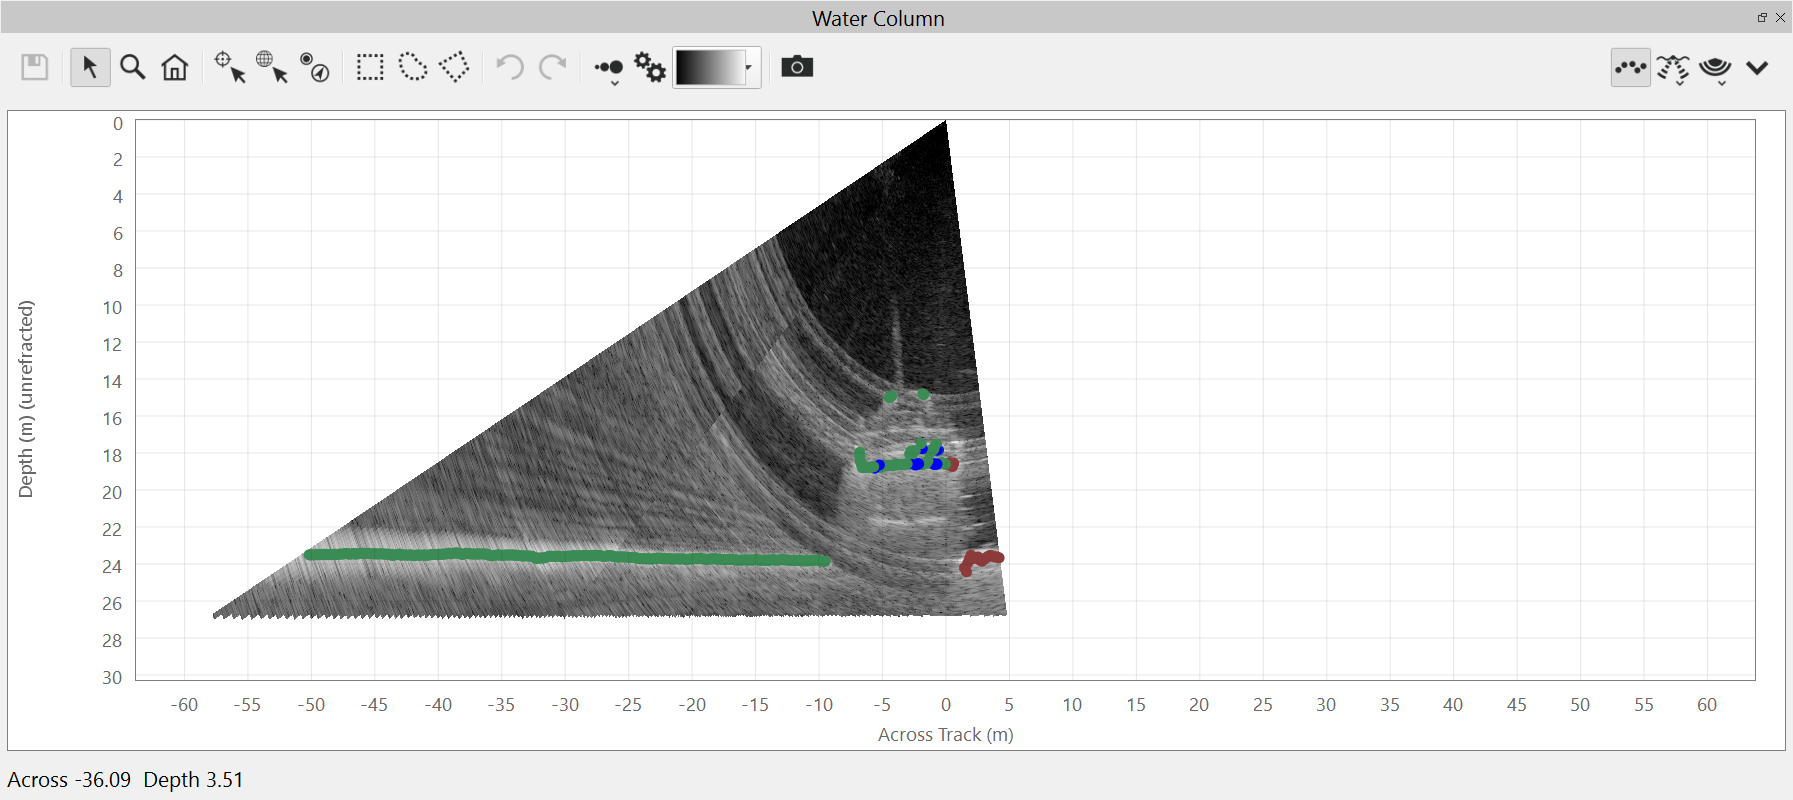
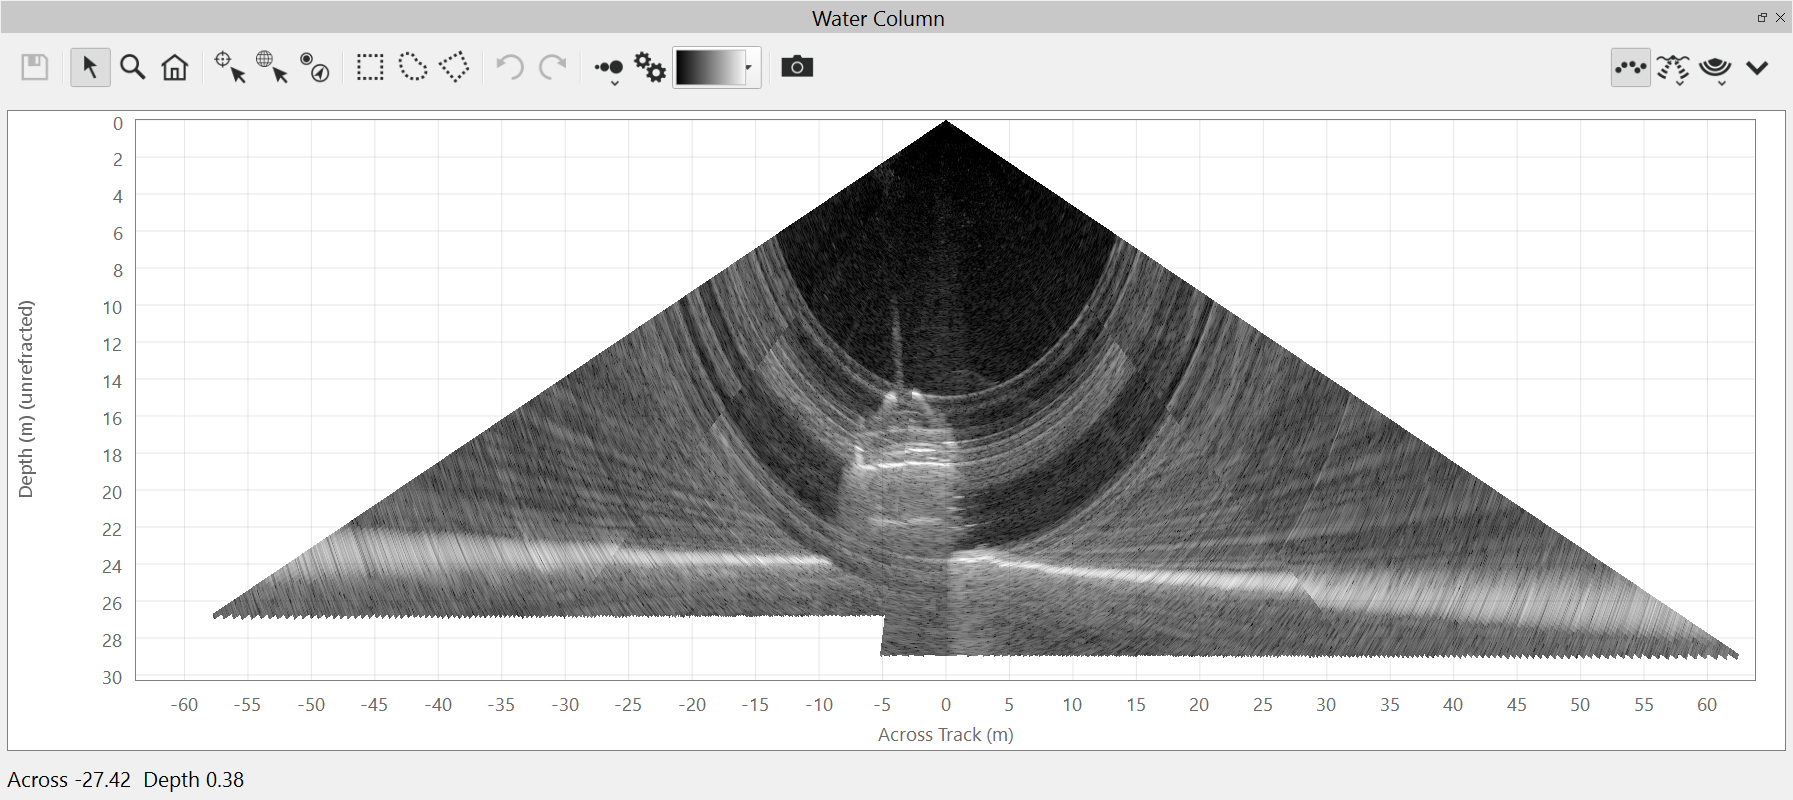
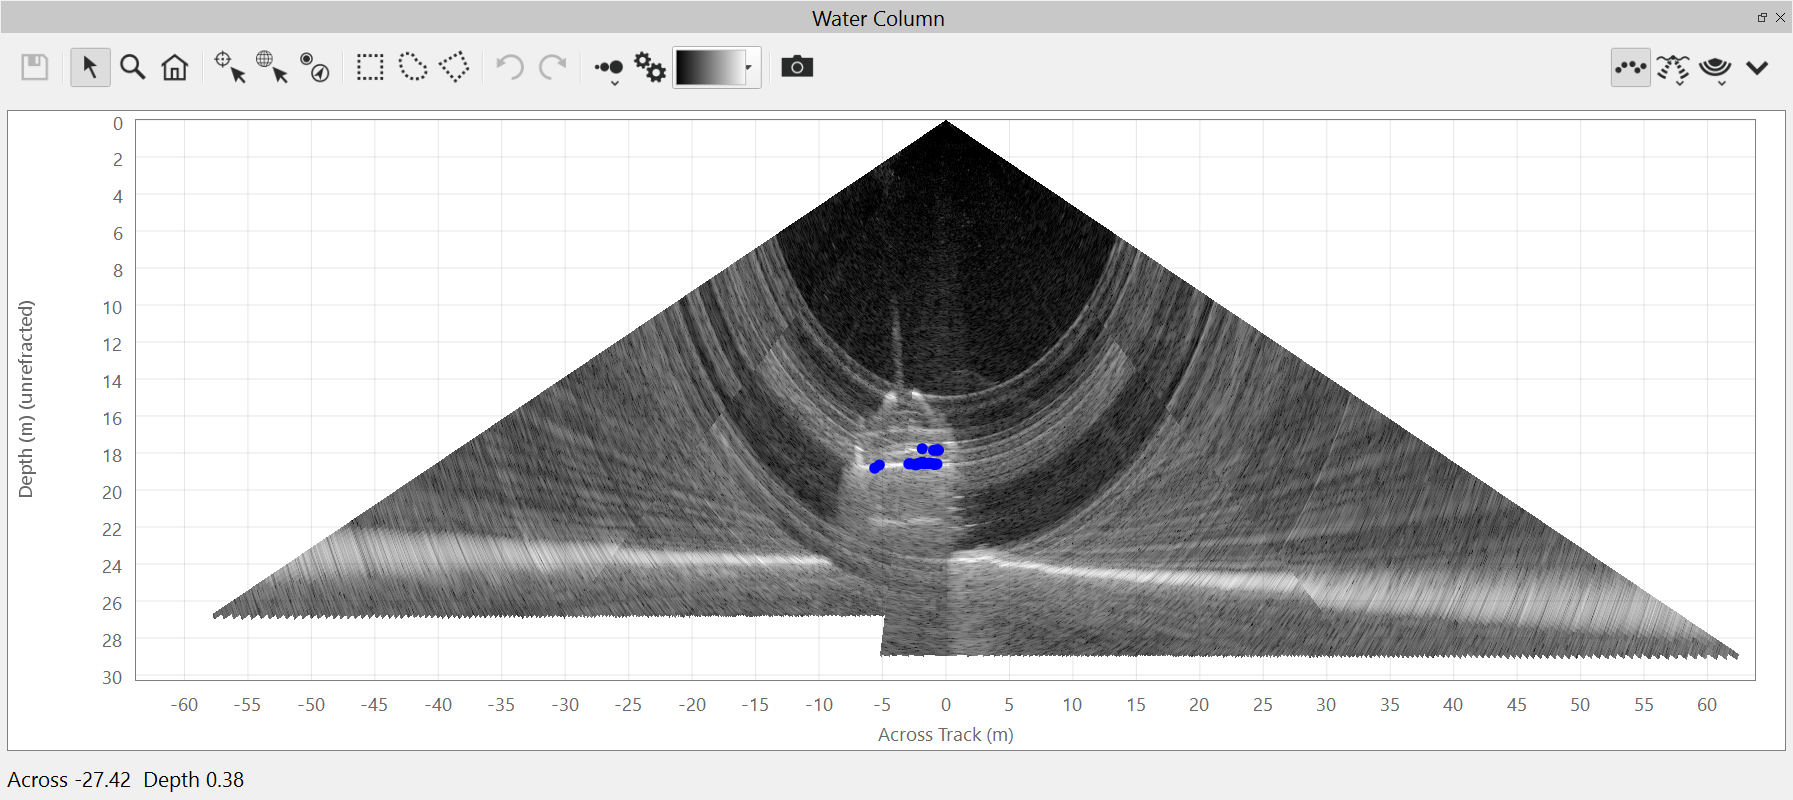
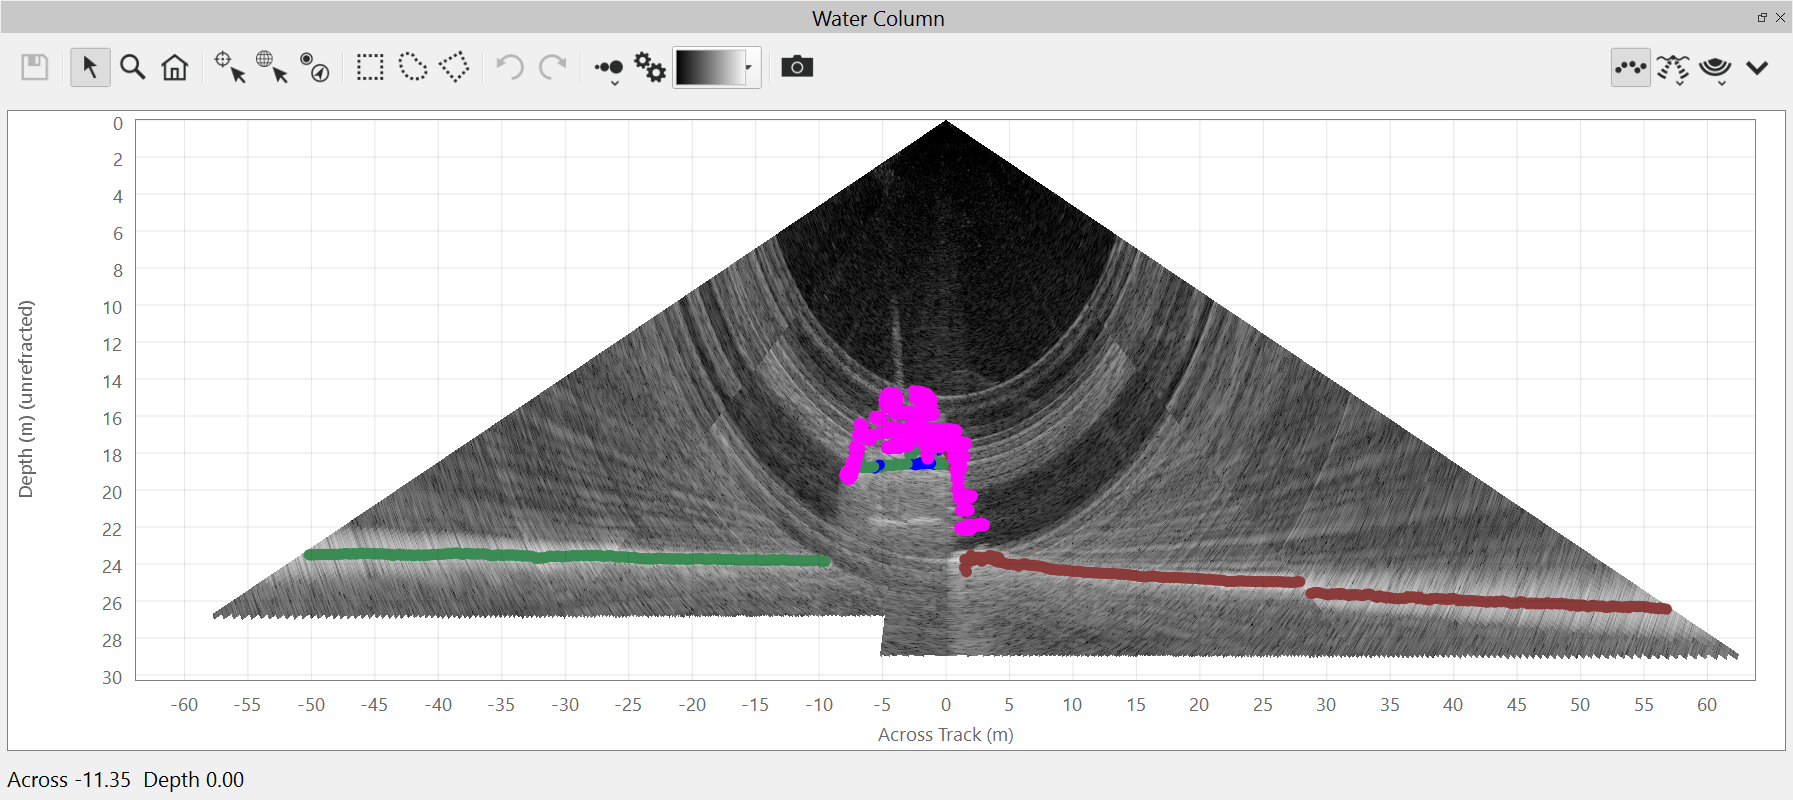
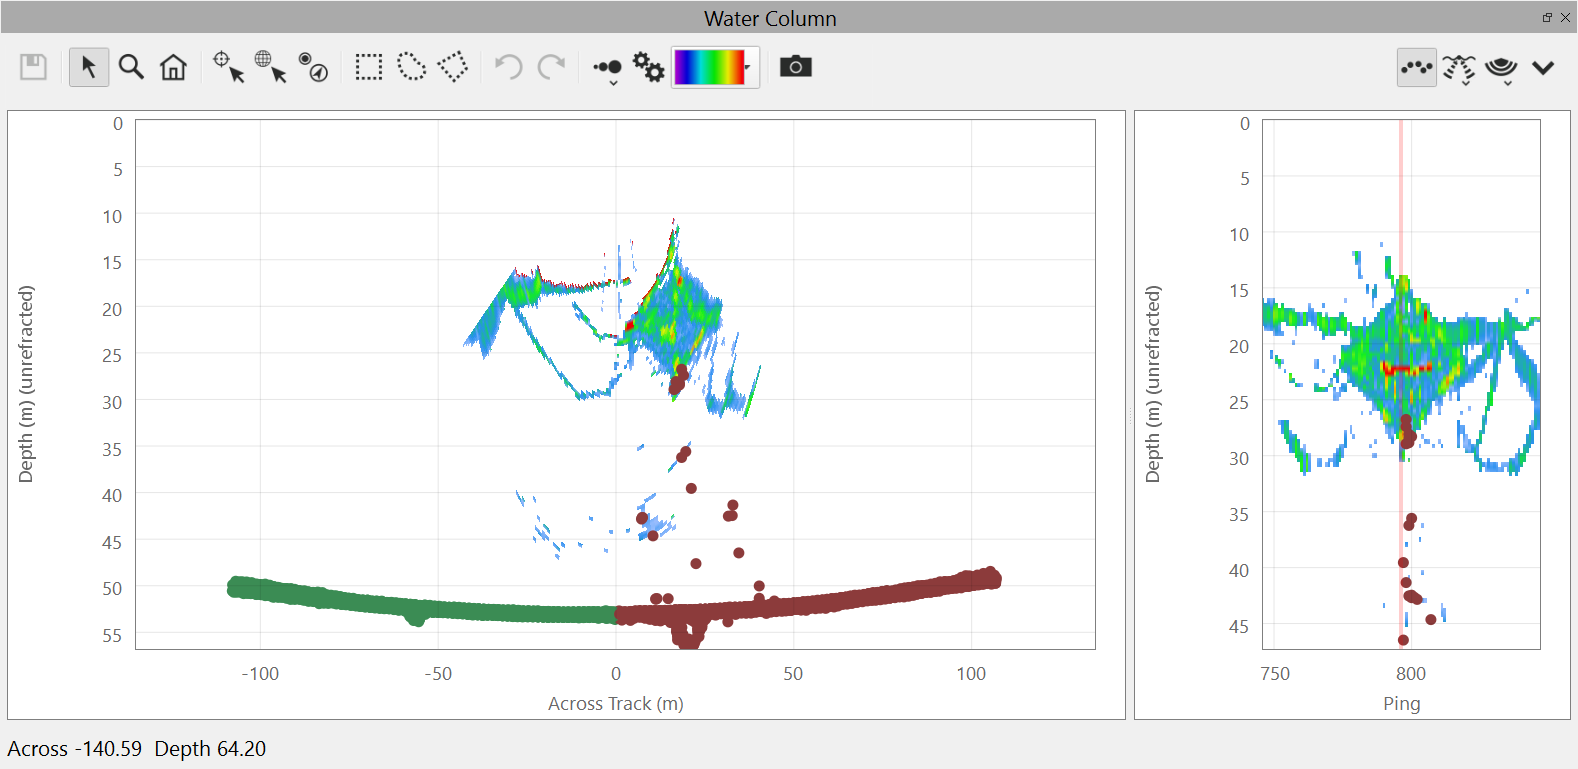
The Water Column window is active whenever you are in Swath Edit mode and your raw sonar data has associated water column information. In early versions of Qimera, this display was a visual aid only and its use was intended to help you determine the validity of bathymetric targets. Since Qimera 1.4, the display can be used to digitize additional soundings. The plot surface works just like all plot surfaces in Qimera, you can zoom in/out and pan the display. As you move your Swath Editor buffer, this display shows you the current ping. Depending on the view being used in the Swath Editor, this can be the middle of the swath edit buffer, or the current ping that the mouse is over in the above and oblique views. Detection's are shown as point overlays on the display. Red is for the normal detection's (port side only if dual head). Green is for normal soundings from the starboard head. Blue is for additional detection's from any head. Magenta soundings are user picked soundings. When you pick soundings in the water column view, you are actually adding raw sounding values to the current line. These soundings can be refracted, edited, exported and used in static or dynamic surfaces. These soundings are added to the SystemName_UserAdditional system where SystemName is the name of a particular multibeam system. If you want these soundings to appear in any surfaces you make, be sure to leave the system checked in the surface generation dialog. Also note that the water column display is NEVER corrected for refraction. The depth and distance scaling that the background grid enables should only be used for approximate positioning for items in the water column widget. User picks from the display are stored as raw multibeam range, angle measurements, refraction corrected, and georeferenced externally from the Swath Editor.
For information on plot surface navigation and editing, see the manual, here: Qimera Plotting Surfaces
This button will save any edits that have been completed.
Reset Zoom
This button zooms out the plot window to the extents of the data. Please see the section on Plotting Surfaces for more information on plot surface navigation and control.
Explore
This button places the window in Explore mode. As you move your cursor over the plot area, you will see corresponding X/Y axis values display below the plot. These values are NOT refraction corrected. Additionally, see the section on Plotting Surfaces for more information on plot surface navigation and control.
Zoom In
This button places the cursor in Zoom mode. Please see the section on Plotting Surfaces for more information on plot surface navigation and control.
Add Sounding
This button places the cursor in Add Sounding mode. Each time you click a visible water column sample in the view, a sounding will be added for that ping, beam and range. If there is already an existing sounding within +/- 1 sample, no new sounding will be created. New soundings will appear as magenta dots, visible as an overlay to the water column view. You cannot add single soundings on a stacked fan or side view, you can only add single soundings on a single ping fan. This cursor mode is only available on the Fan View due to the ambiguous position of the pixel in theSide Views described below. Using this mode on the Side View will result in moving the current location to the "clicked" ping.
Geo Pick
This button places the cursor in Geo Pick mode. Each time you click a visible water column sample in the view, a refracted geo-location is added to the Geo Pick Dock. Qimera uses all the processing settings of the current line to perform a refraction operation. Using the Geo Pick Dock, this data can be exported or used to create an SD object in the scene. This cursor mode is only available on the Fan View due to the ambiguous position of the pixel in theSide Views described below. Using this mode on the Side View will result in moving the current location to the "clicked" ping.
Add ENC Point Object
This button places the cursor in ENC Point Creation mode. Each time you click a visible water column sample in the view, the Geo Pick operation is performed to create an ENC point feature on the currently selected project ENC layer. To learn more about creating ENC objects, see the section on the Qimera ENC Editor Dock. Creating ENC point objects from water column samples results in the VALSOU attribute of the feature being automatically assigned to the refracted depth of the sounding. This cursor mode is only available on the Fan View due to the ambiguous position of the pixel in theSide Views described below. Using this mode on the Side View will result in moving the current location to the "clicked" ping.
Add Sounding Selection (Rectangular Selection)
This button places the cursor in Rectangle Selection mode. Left-click-draga selection rectangle over the water column view to add all visible samples as new soundings. The same logic applies for duplicate sounding protection as when doing single selection. New soundings will appear as magenta dots visible as an overlay to the water column view.
Add Sounding Selection (Lasso Selection)
This button places the cursor in Lasso Selection mode. Left-click-draga lasso selection over the water column view to add all visible samples as new soundings. The same logic applies for duplicate sounding protection as when doing single selection. New soundings will appear as magenta dots visible as an overlay to the water column view.
Add Sounding Selection (Polygon Selection)
This button places the cursor in Polygon Selection mode. Left-click multiple points to define a polygon. Select the initial point to close or right-clickclose. The selected area of the water column view will add all visible samples as new soundings. The same logic applies for duplicate sounding protection as when doing single selection. New soundings will appear as magenta dots visible as an overlay to the water column view.
Undo
This button will undo the previously added soundings. Each sounding addition pushes an undo state onto the undo stack. Once the swath buffer moves, the undo/redo stack is cleared.
Redo
This button will redo the soundings removed from a previous undo operation. Once the swath buffer moves, the undo/redo stack is cleared.
Point Size
This button will allow you to change the size of the plotted sounding solutions. Sizes range from Small to XX-Large. Clicking on the button will cycle to the next size. Click and hold to get a drop down menu of sizes to choose.
Water Column Filter Settings
This button will launch the Water Column Filter Settings. This dialog gives you all the controls necessary to filter the sample data that is displayed in the water column views. See the section below for more specifics on how this dialog works.
Colormap Control
This popup allows you to see the currently selected colormap. It allows you to select a colormap file, edit the current colormap or adjust the colormap range. This control works the same as the one found in the Project Layers Dock.
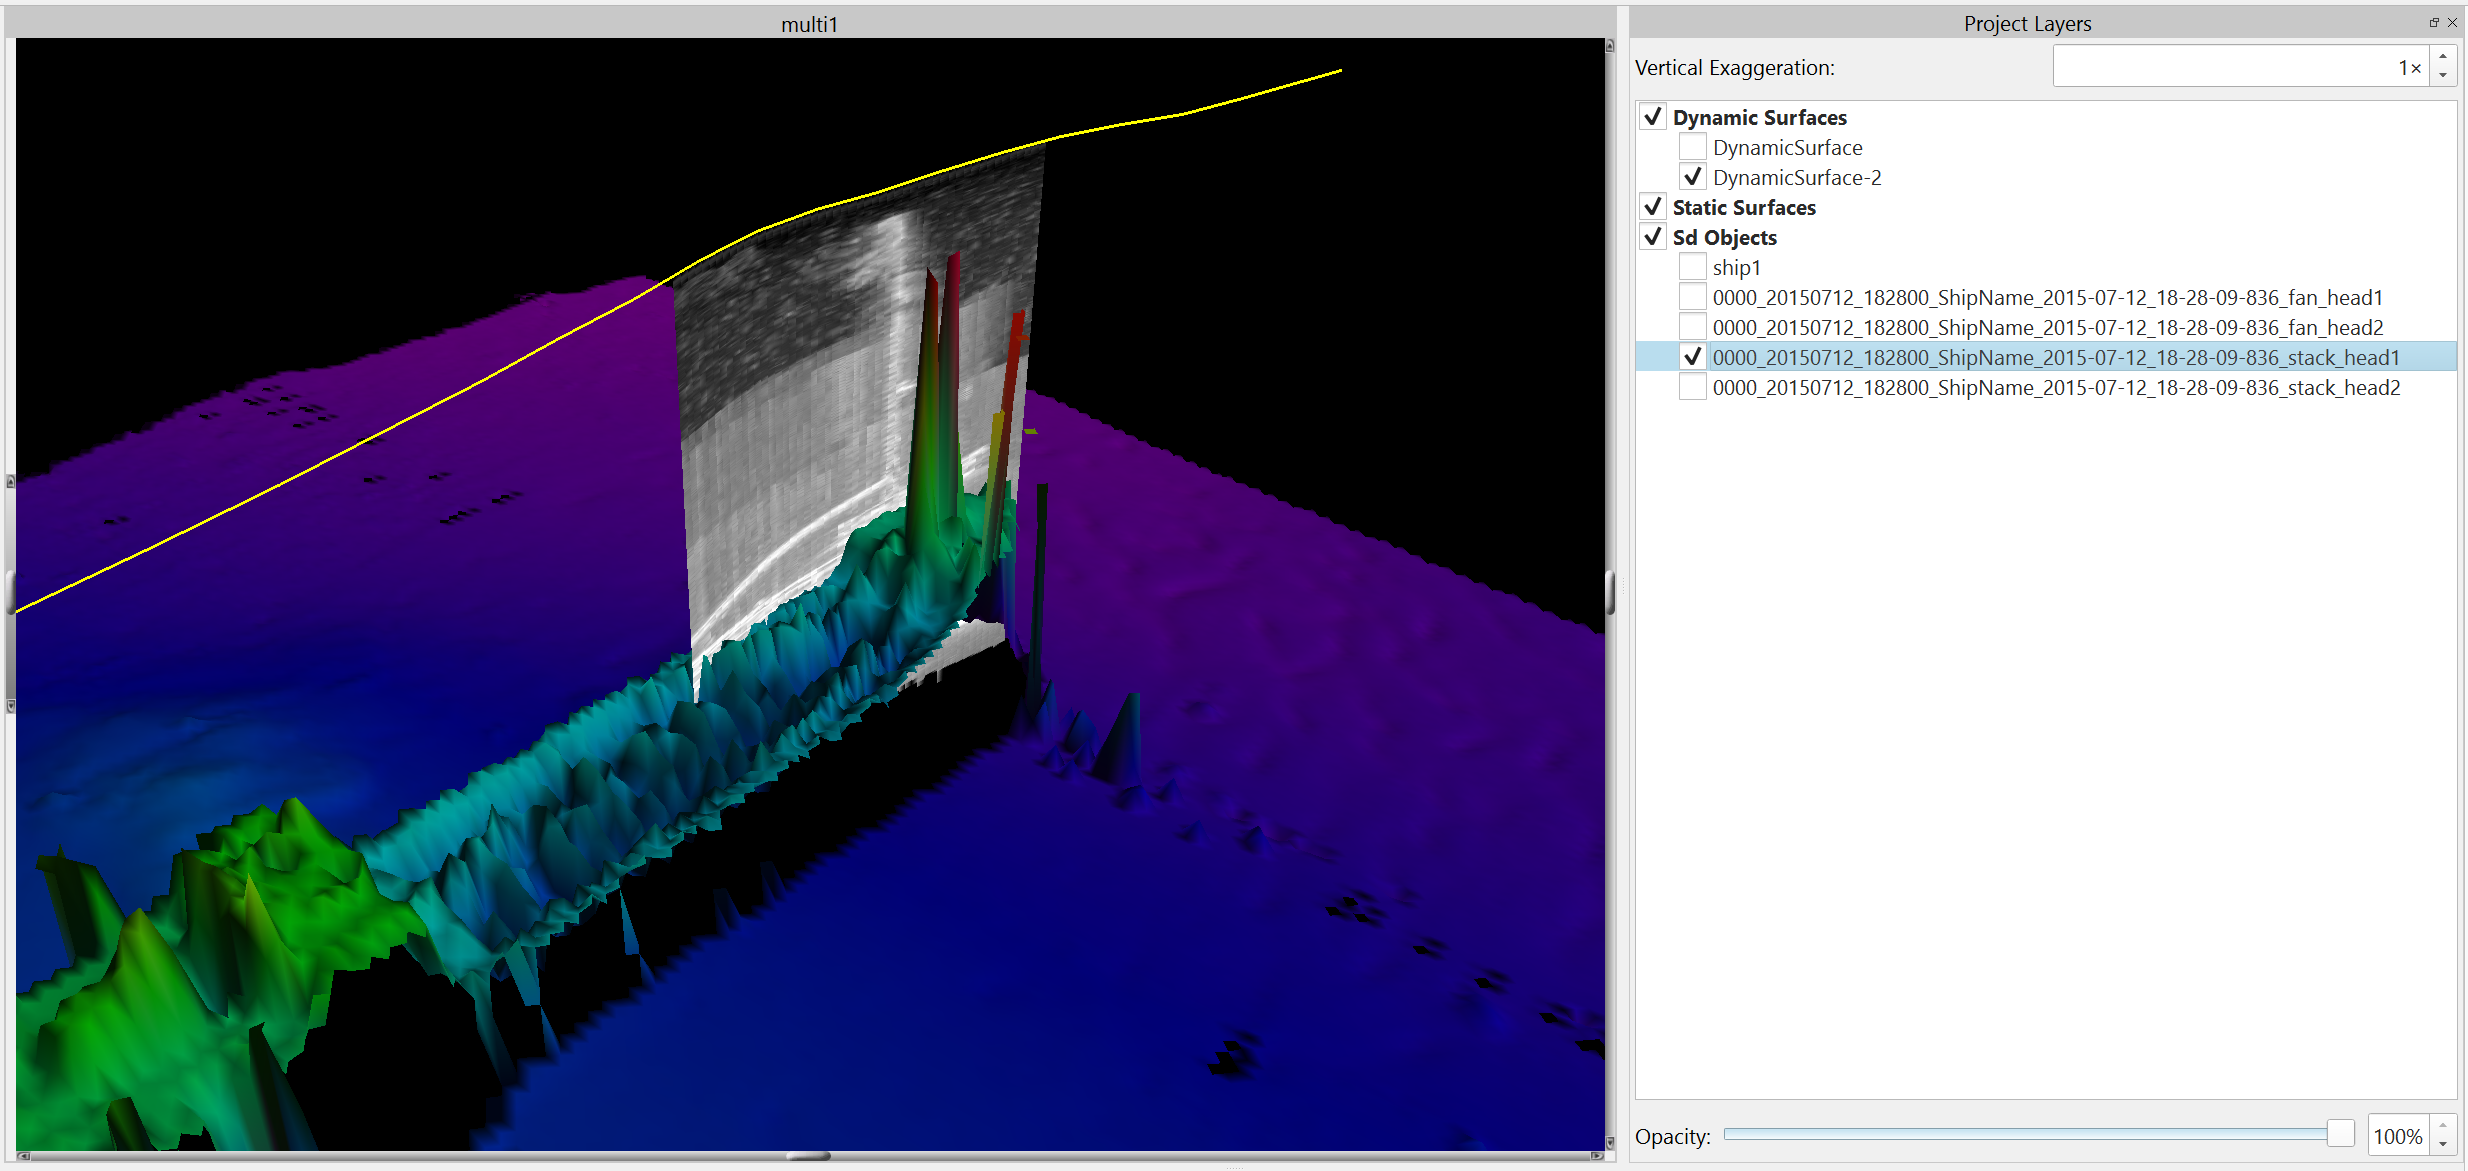
Fan Snapshot
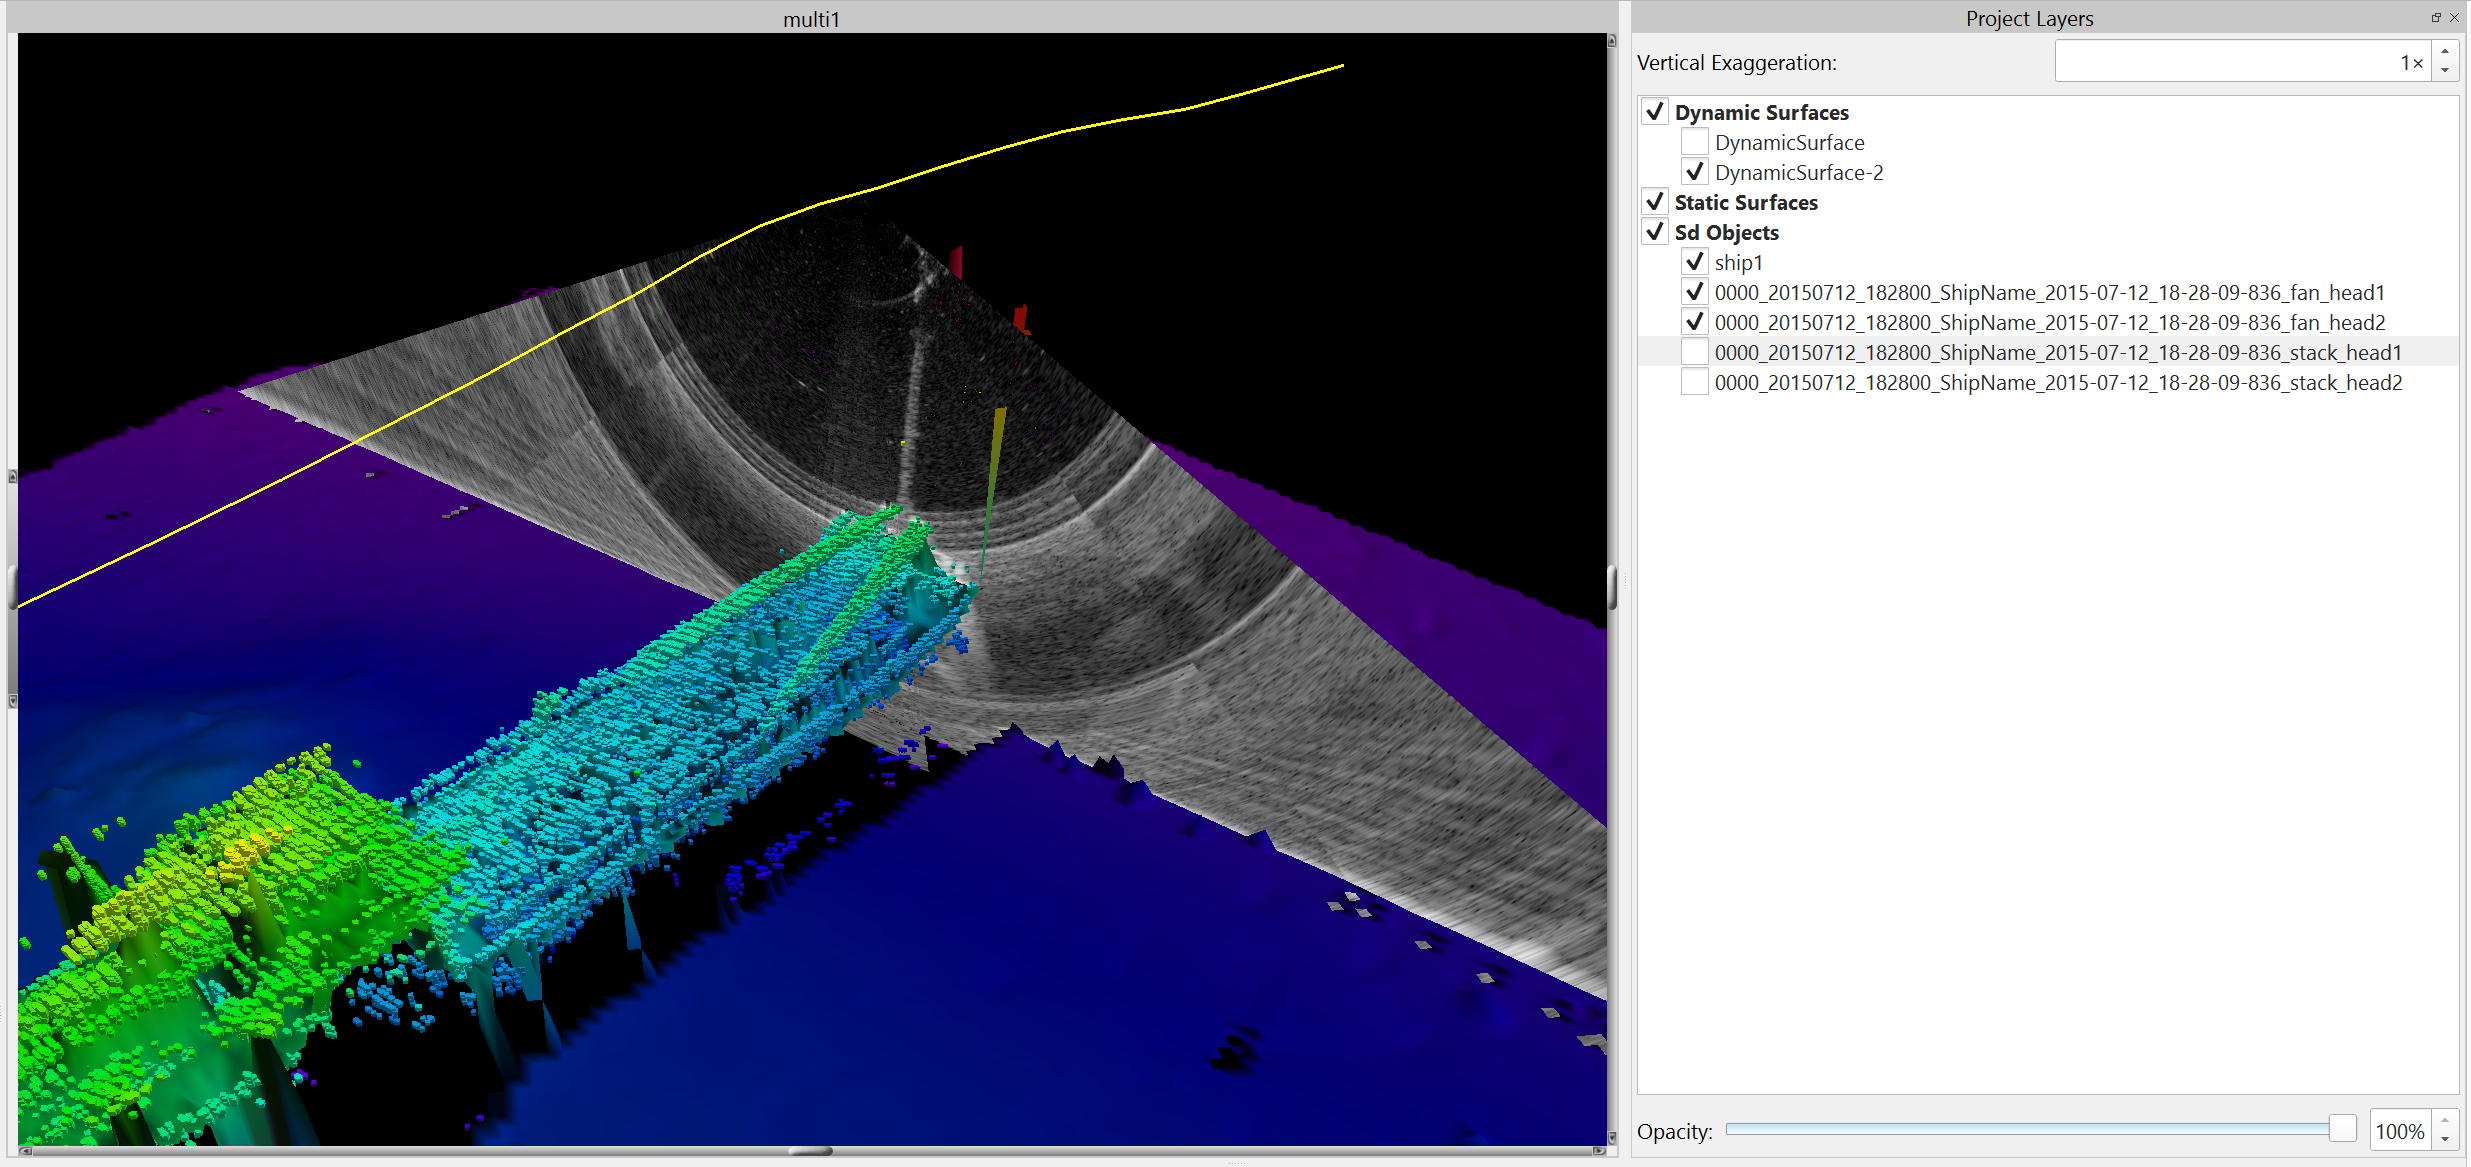
This button creates a Fan SD object in the scene at the current location and will appear under the SD Objects tree on the Project Layers widget. If you have a dual head system, 2 SD objects will be created. The snapshot SD will get the name 'Fan_Snapshot_#####' or Stack_Snapshot_####. If you are in Fan Stack mode, the imagery will be stacked and the object will be placed at the current ping location. An example of a Fan Snapshot is shown below. The fan snapshots are NOT refraction corrected. If you wish to use a specific name for the snapshot, use the Water Column View Menu option Save Fan or Stack Snapshot or hold down the CTRL key while you click the button. CTRL as a modifier will save the fan view while SHIFT as a modifier will save the stack view. This will bring up a Save File dialog that will allow you to name the object. Snapshots are meant to be used as simple visual mark up cues in the working area to give you a method to easily keep track of items that you have reviewed, or to perhaps capture objects of interest that require further examination or analysis. You can use these objects as "bookmarks" in your data. To quickly navigate to their location, select them in the SD Objects tree and click the Z key or use the Zoom to Object button of the 4D Toolbar.
Show Soundings
This toggle button will show/hide all soundings regardless of type. It is a convenient way to turn all soundings on or off while investigating the water column imagery.
Head View
This button can cycle options by clicking or if you click and hold, a drop down menu appear with the options and their descriptions. The options are Dual Head, Port Head, Starboard Head. This controls which heads are displayed in the window, if your data is dual head data.
Port Head View
Starboard Head View
Both Heads
Plot Type
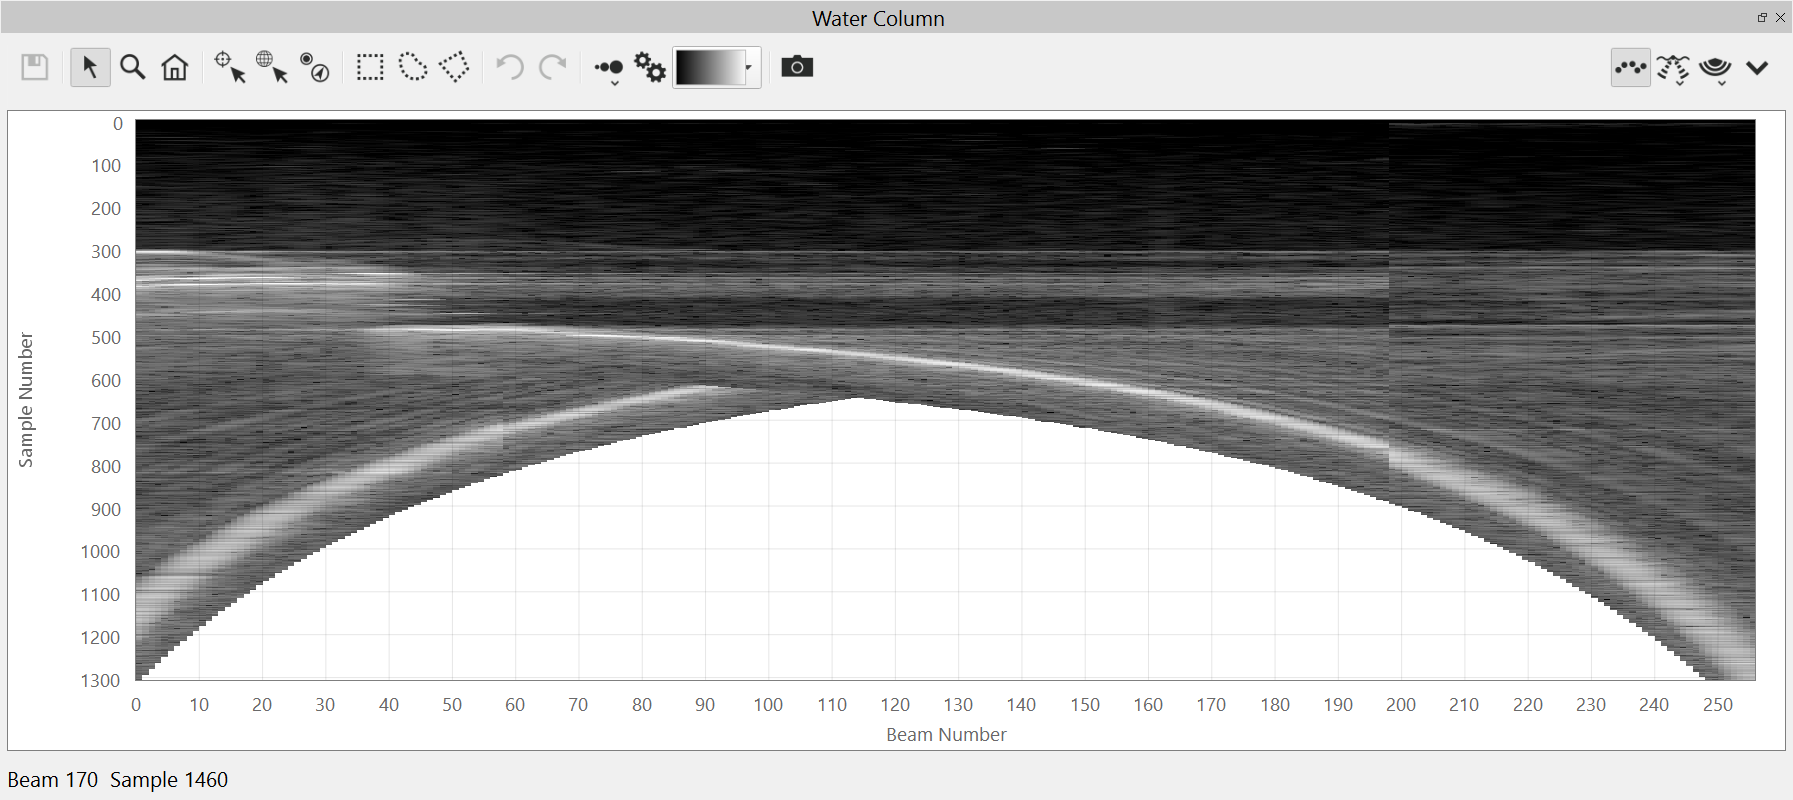
This button can cycle options by clicking or if you click and hold, a drop down menu appear with the options and their descriptions. The options are Wedge view (depth, across track) and Beam/Sample view. Beam/Sample view is mostly useful for multibeam technicians who are examining water column imagery for telltale artifacts when troubleshooting installations or problematic data sets.
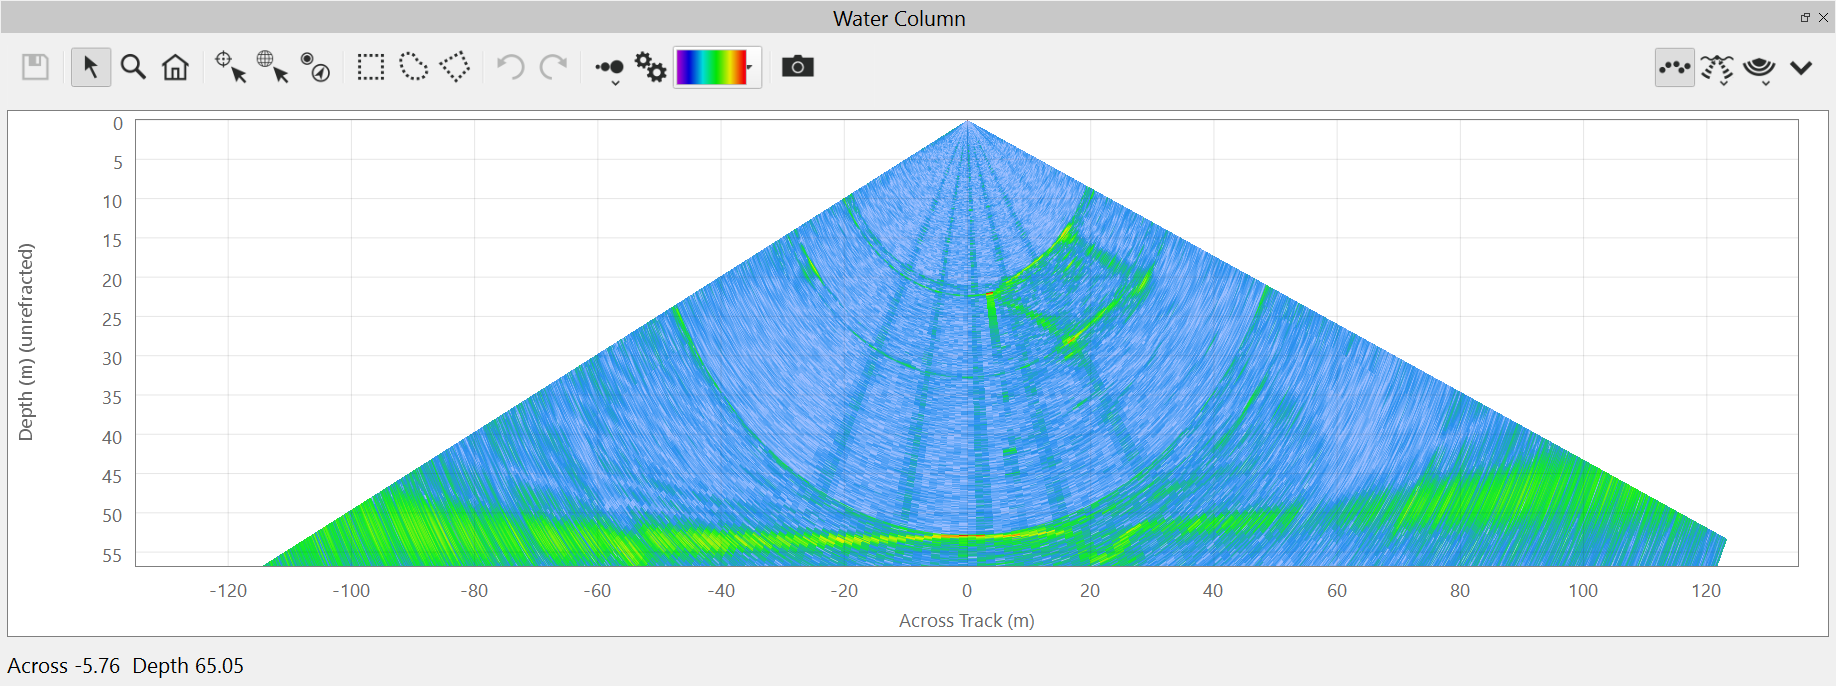
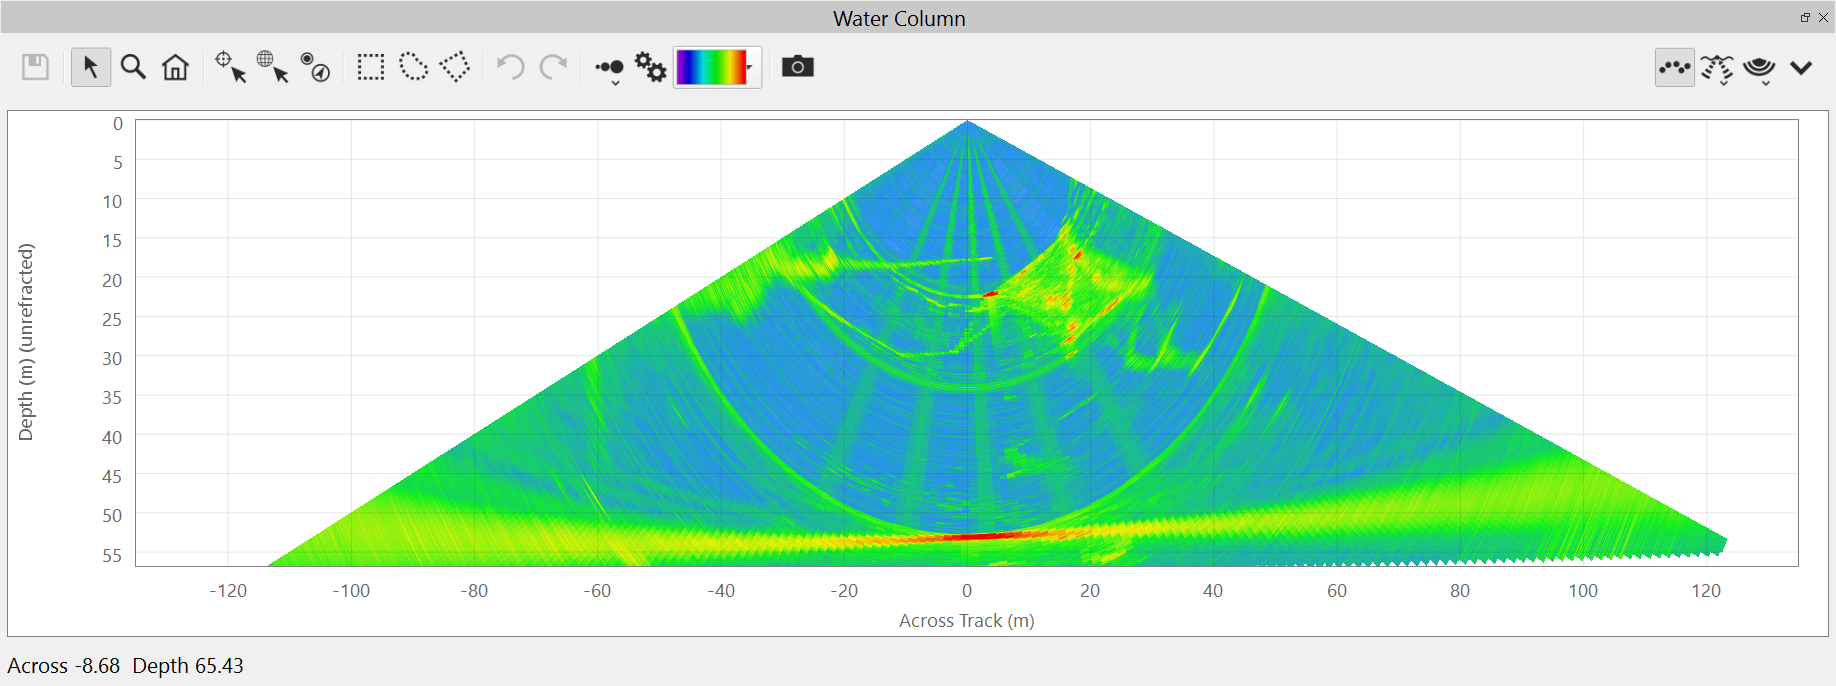
Wedge View
Beam/Sample View
Water Column View Menu
Behind View - Hidden
The water column fan view will not be shown.
Behind View - Fan
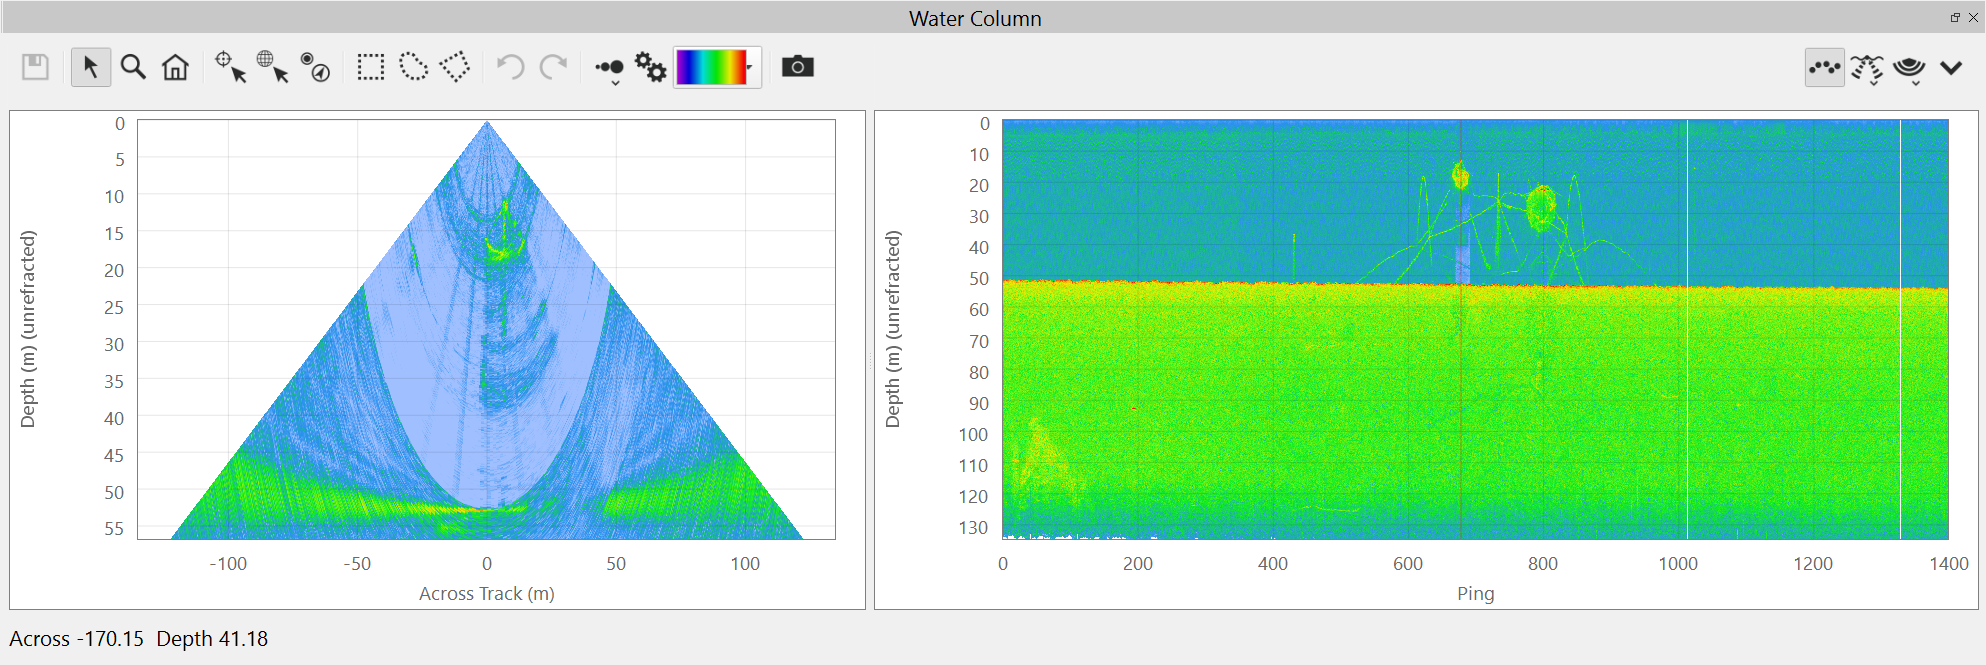
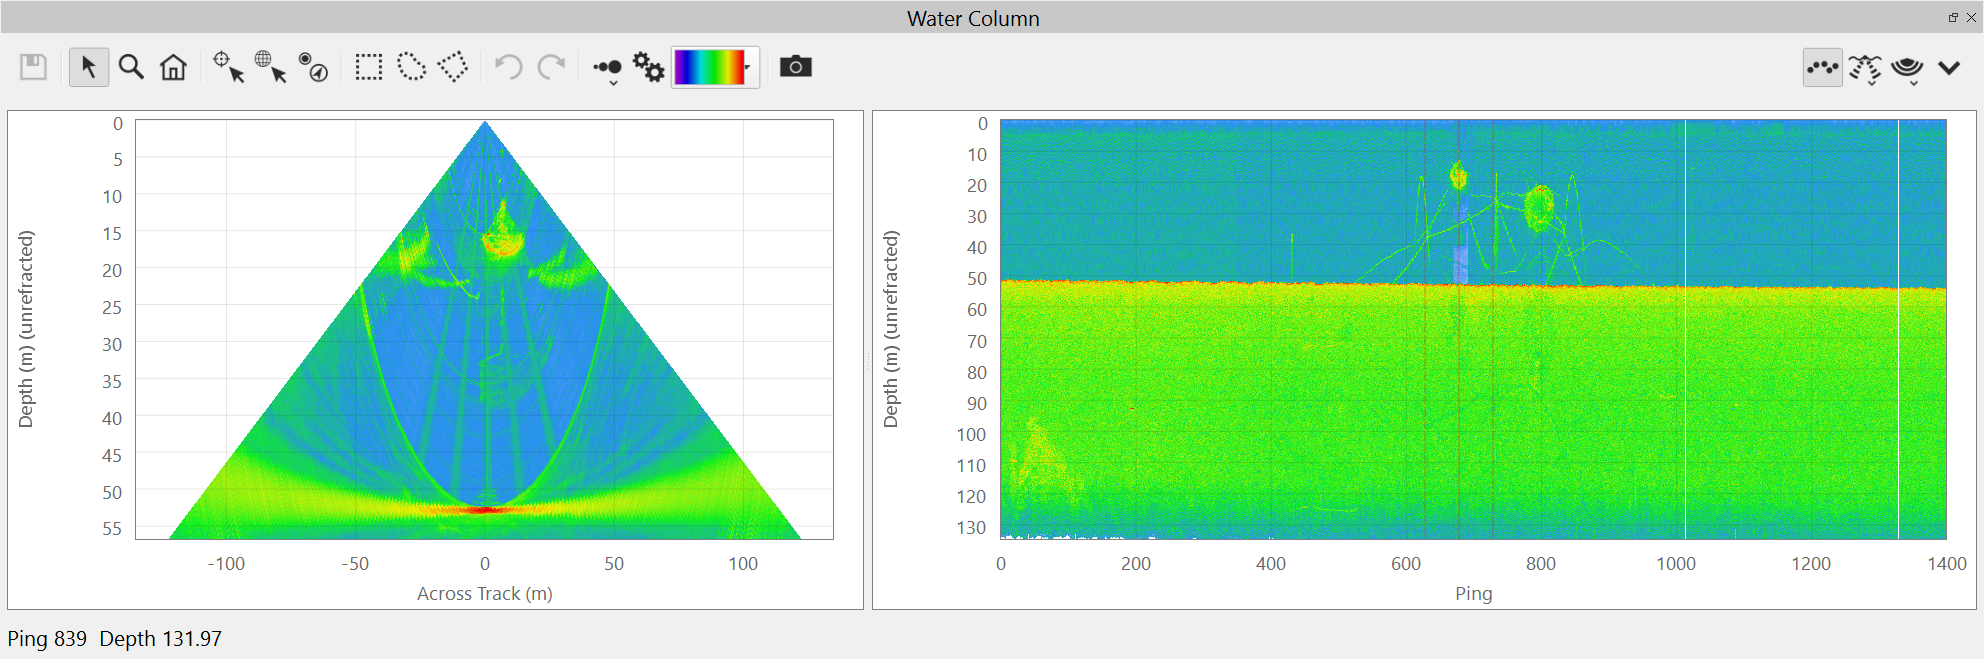
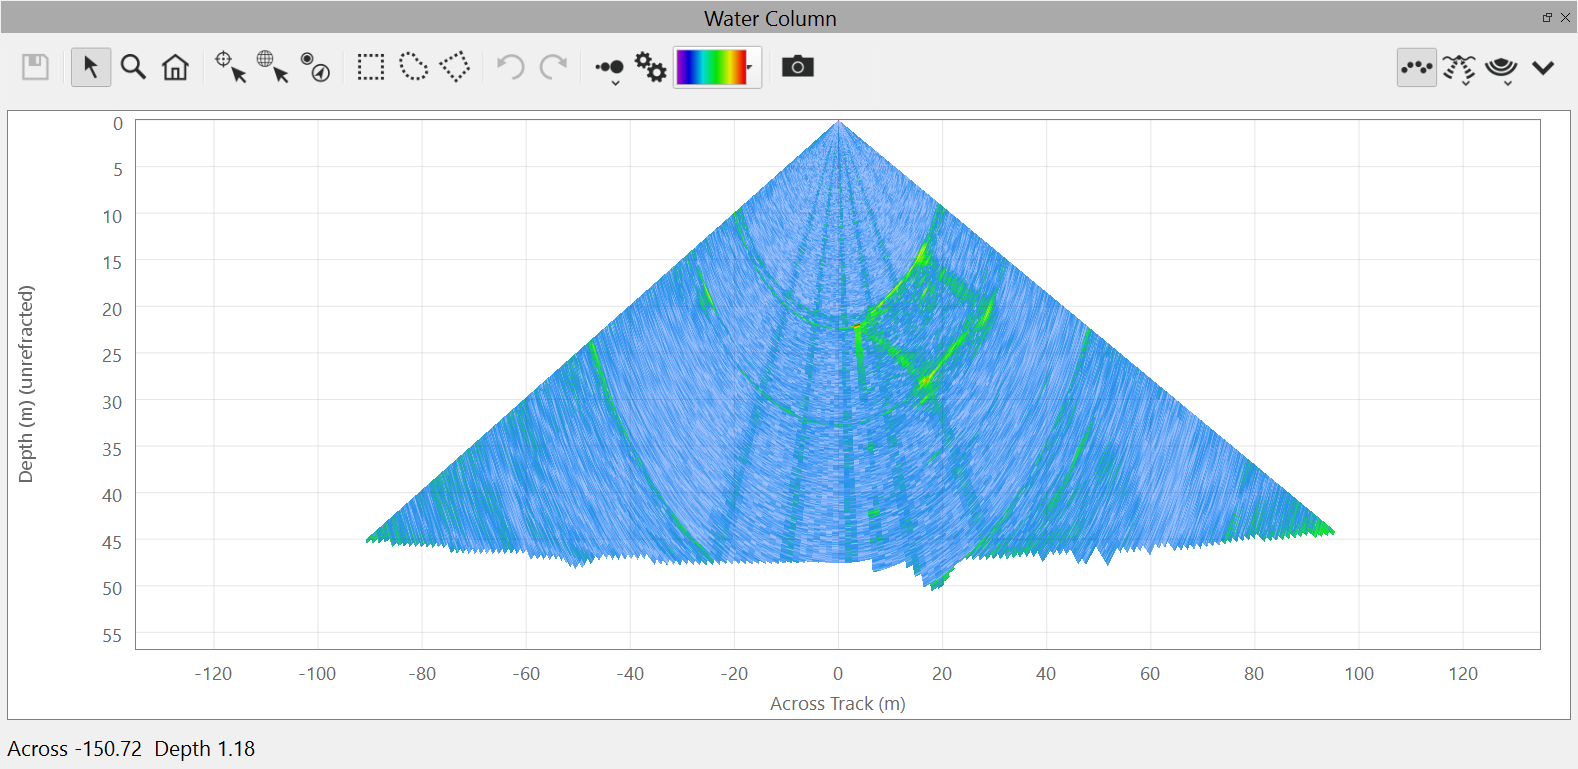
This is the default view of the water column fan. It shows the water column data from the current ping.
Behind View - Stacked Buffer
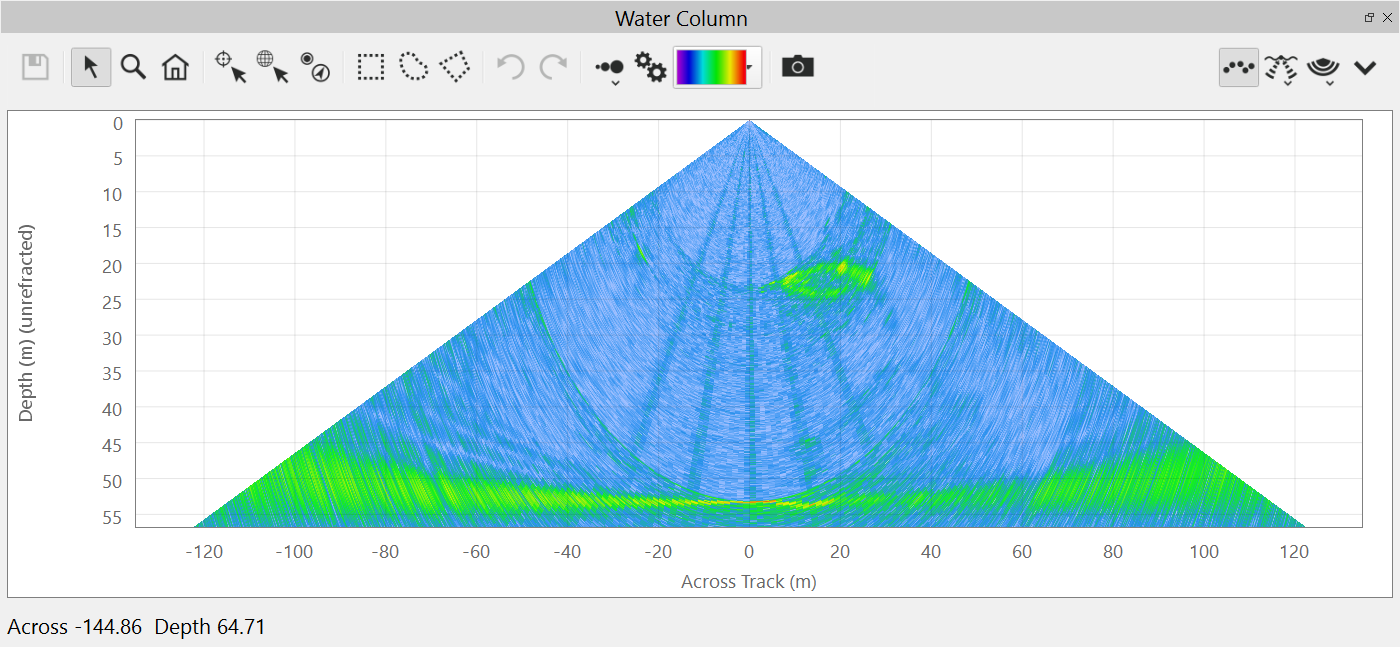
This is a fan view "stacked" for all of the pings in the current swath buffer using a "shine through" technique in which the strongest return is displayed for each beam and range sample.
Side View - Hidden
This is the default for the side view.
Side View - Current Buffer
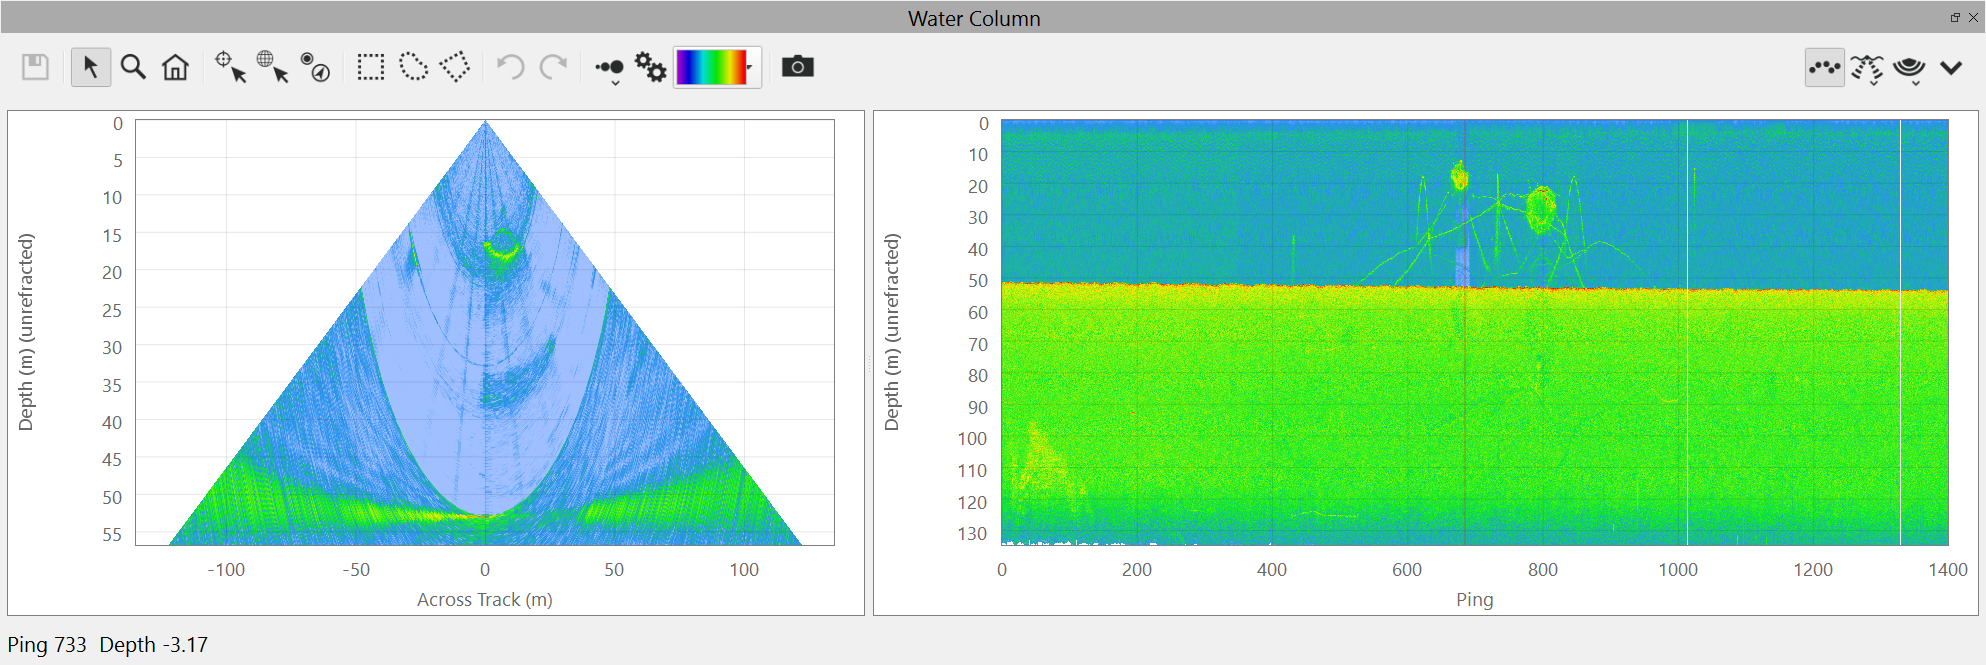
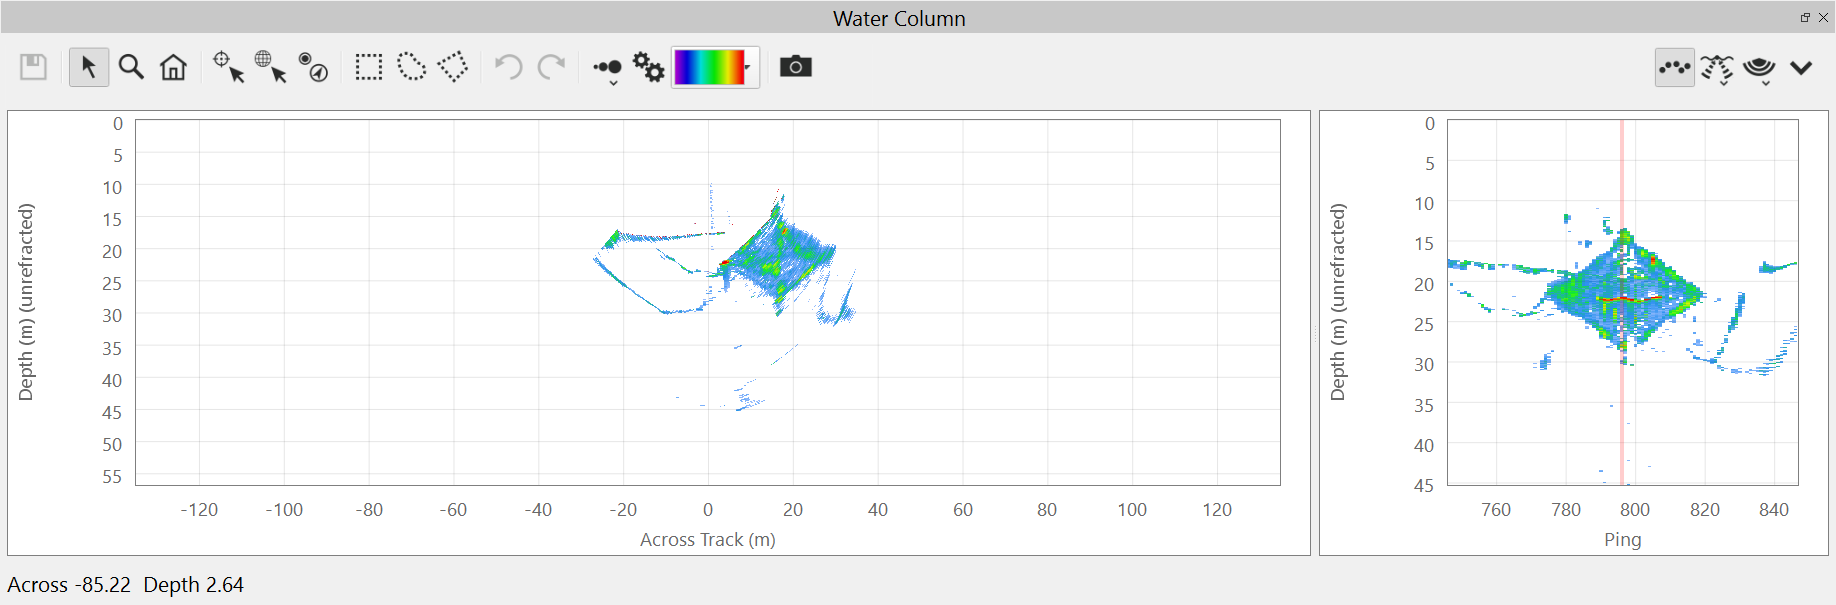
This option will show the stacked side view of the current swath buffer using the same "shine through" method described with the Stacked Fan above. This view will show a depth or range stack depending on the selected stacking option. Using any of the cursor modes on this view will move the ping to the indicated ping number. You cannot use this view to add single soundings, geo-pick a location or add an ENC point object. This is because a picked point on this display represents the accumulation of many beams across the swath. Using any of the selection modes will allow you to add many new soundings to your bathymetric solution. Be sure that before using these options, you first filter out background noise using the options in the settings dialog.
Additionally, a vertical red line is drawn to show the location of the current ping. This line will move as you move the slider in the Qimera Swath Editor Dock.
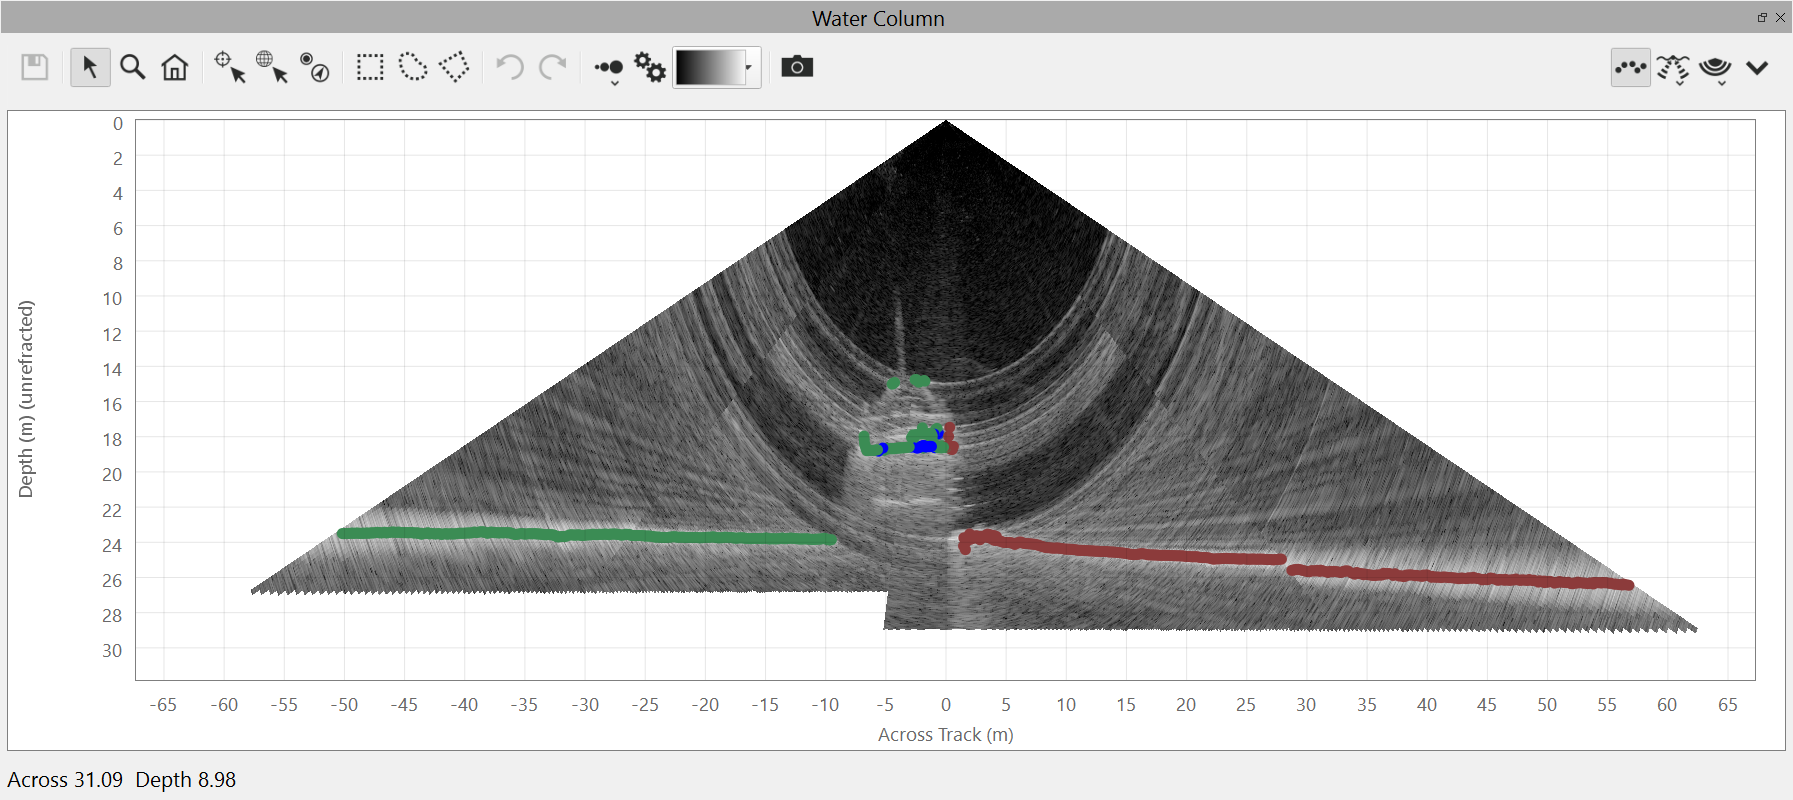
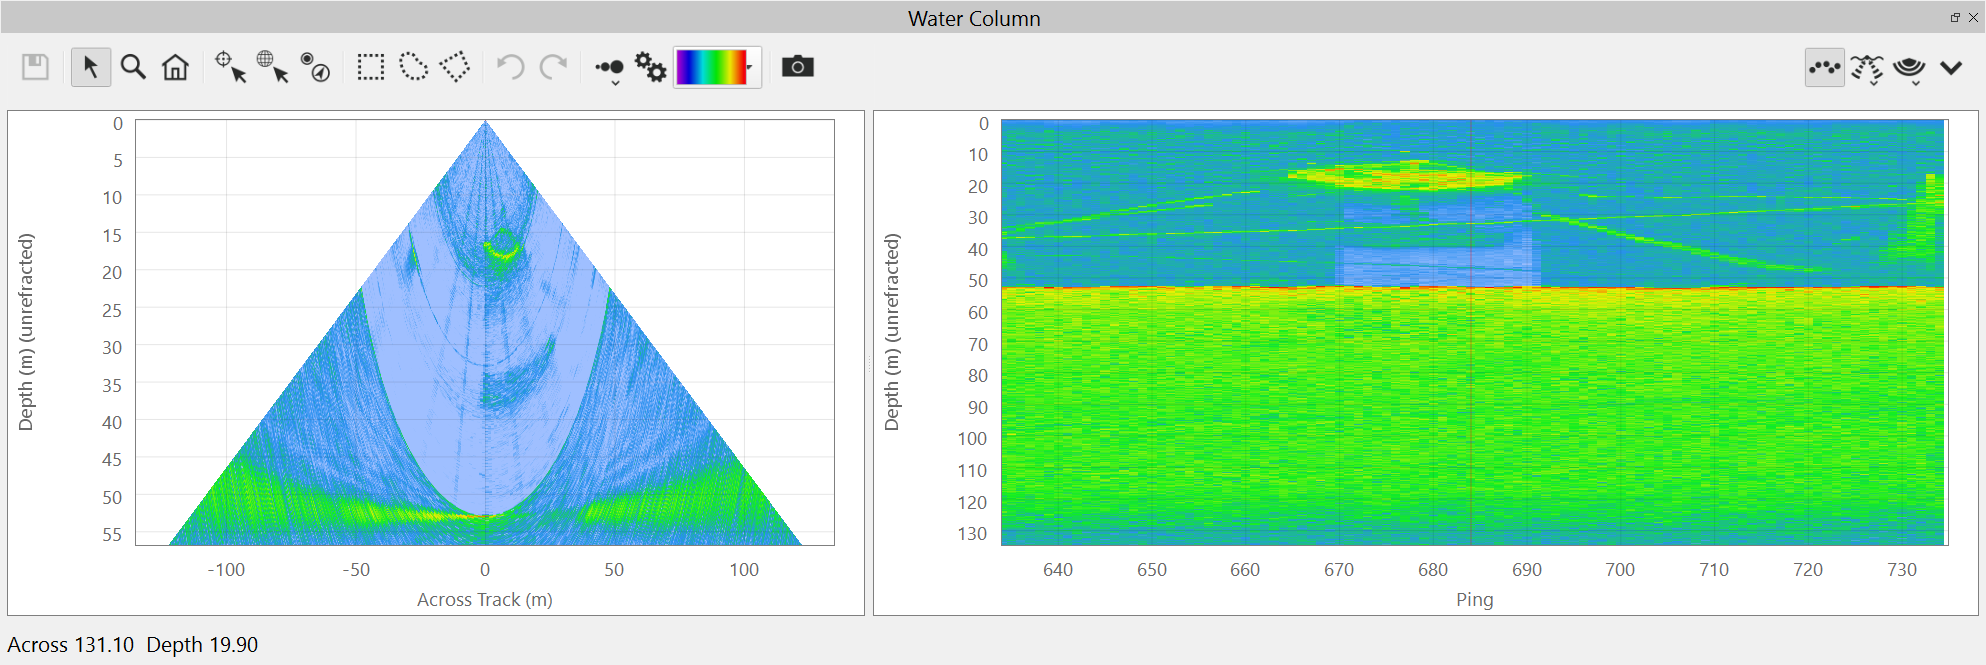
Side View - Entire Line
This option works the same as the one above, except it will show the stacked side view of the entire line. If you are also stacking the fan view, you will see dotted lines alongside the red ping indicator line to show you the ping range in the current fan stack.
Single Ping Fan View
Stacked Fan View
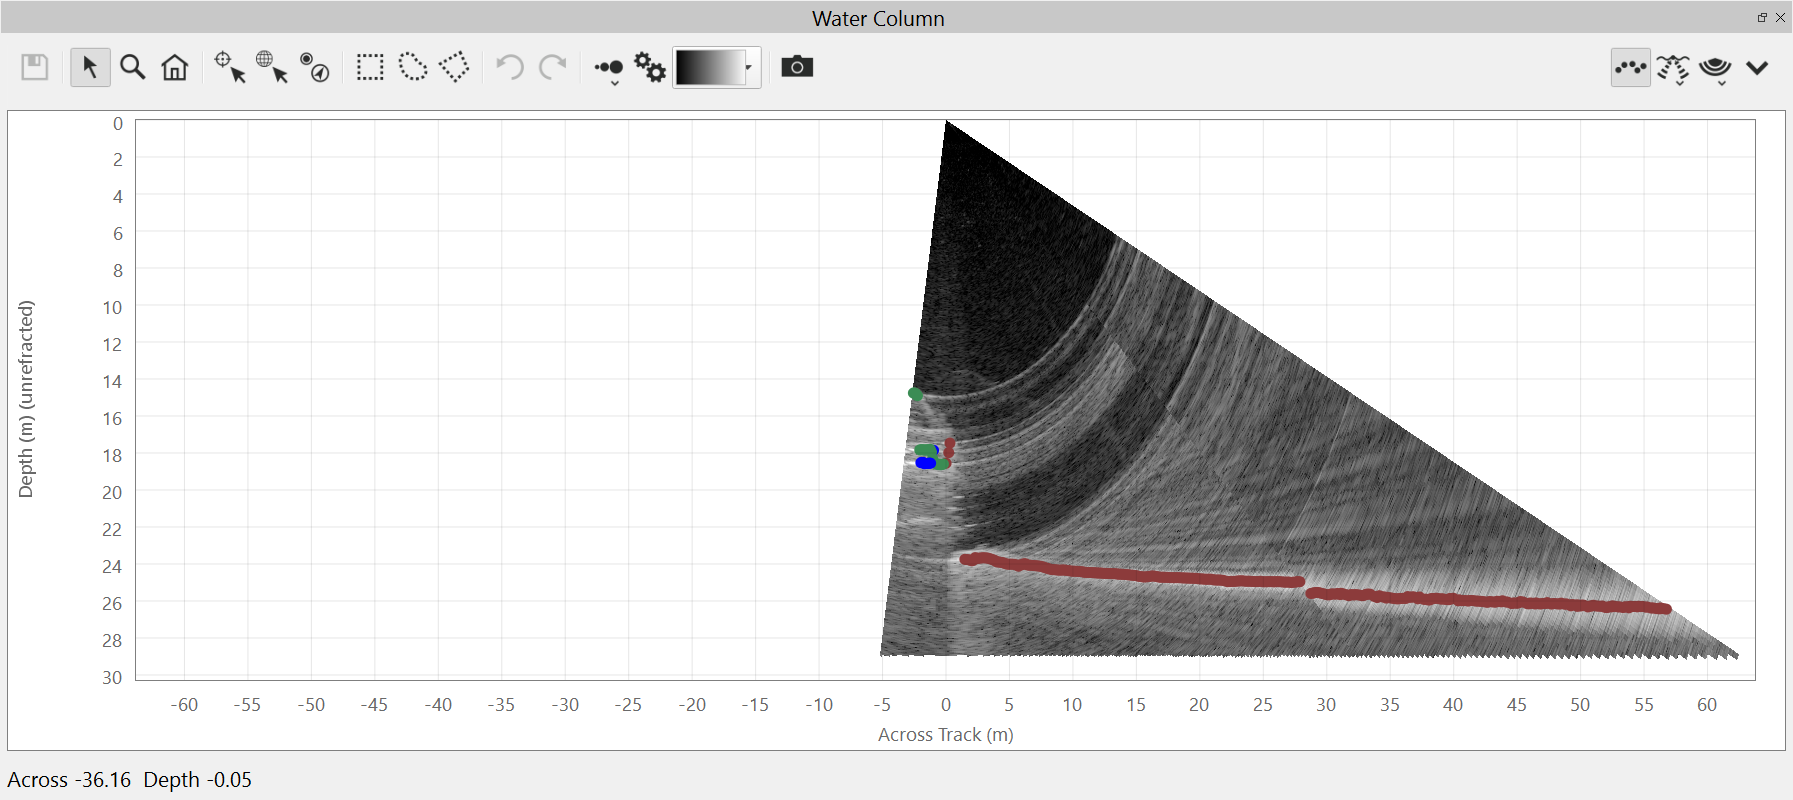
Side View - Stacked by Range
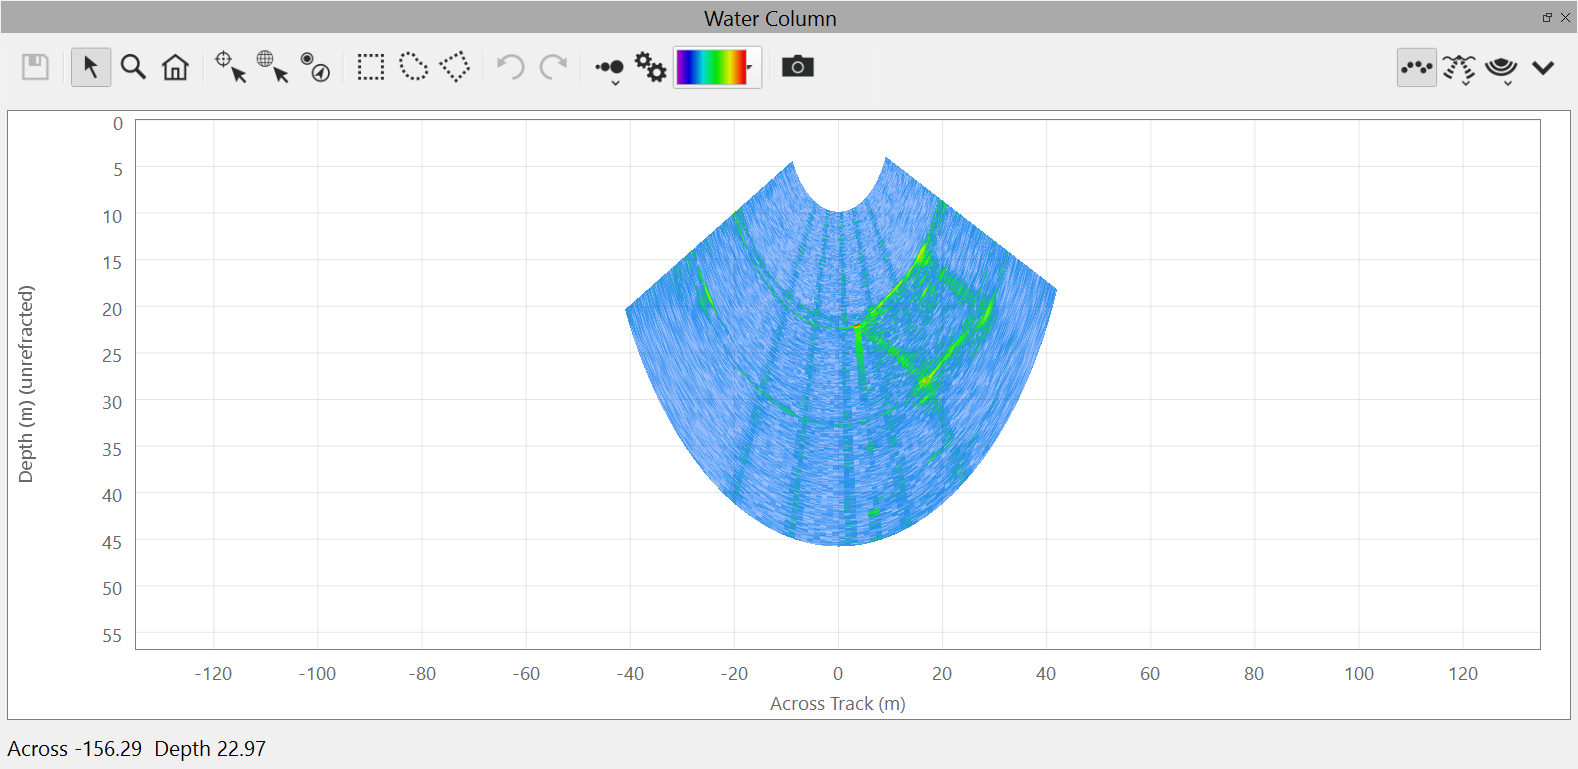
This option will show a range stack in the Side View. Range stacking will display the maximum value from each beam at the same range. This will distort the image as show below.
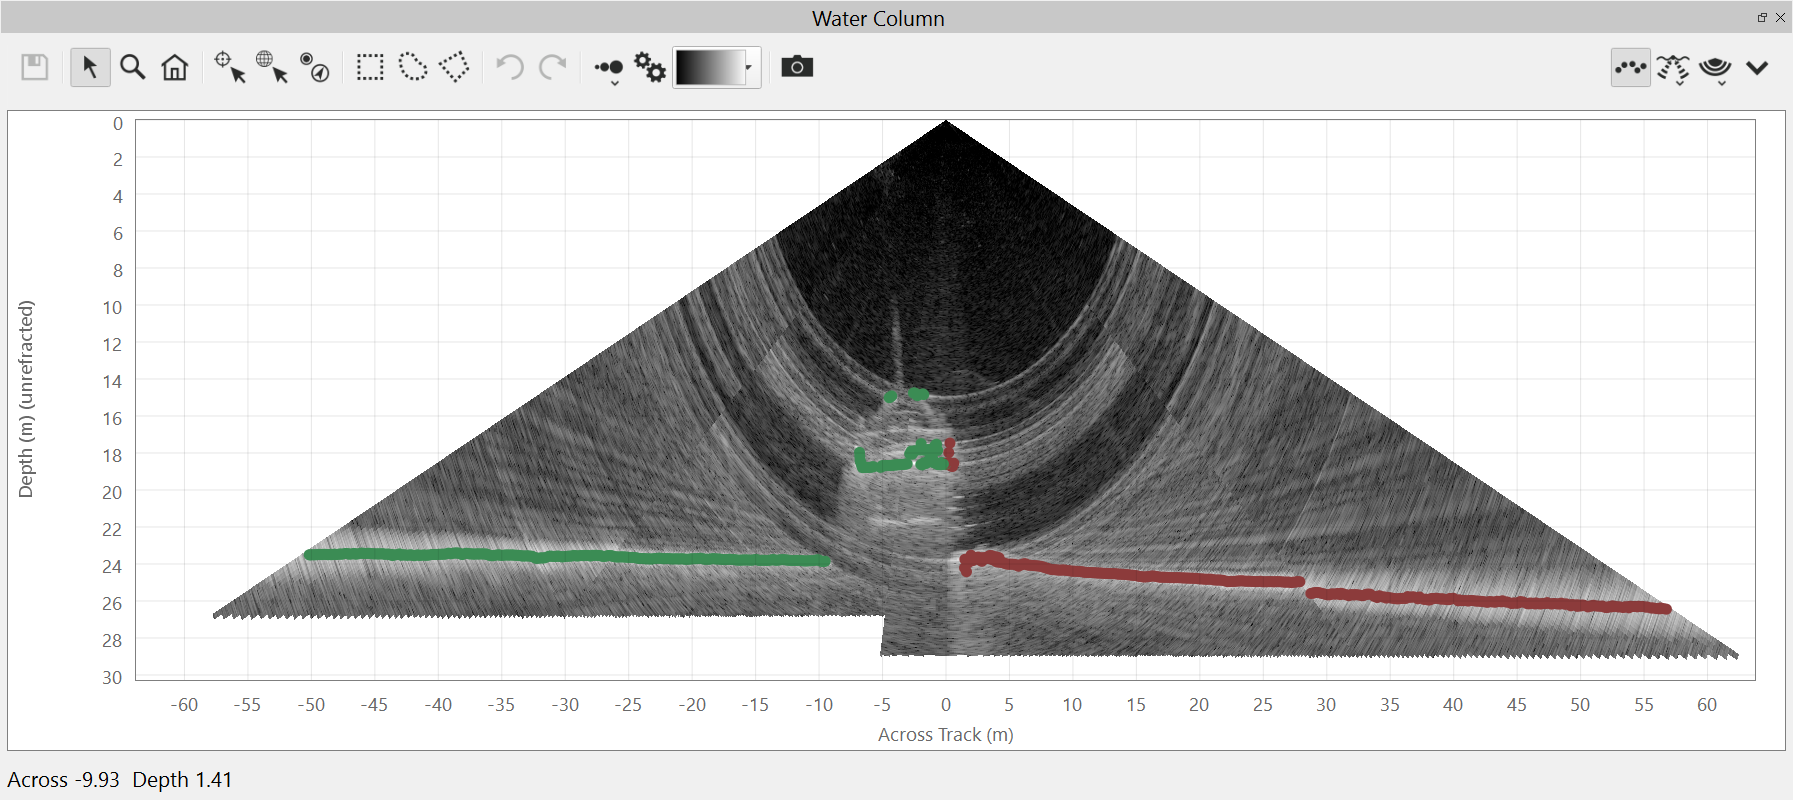
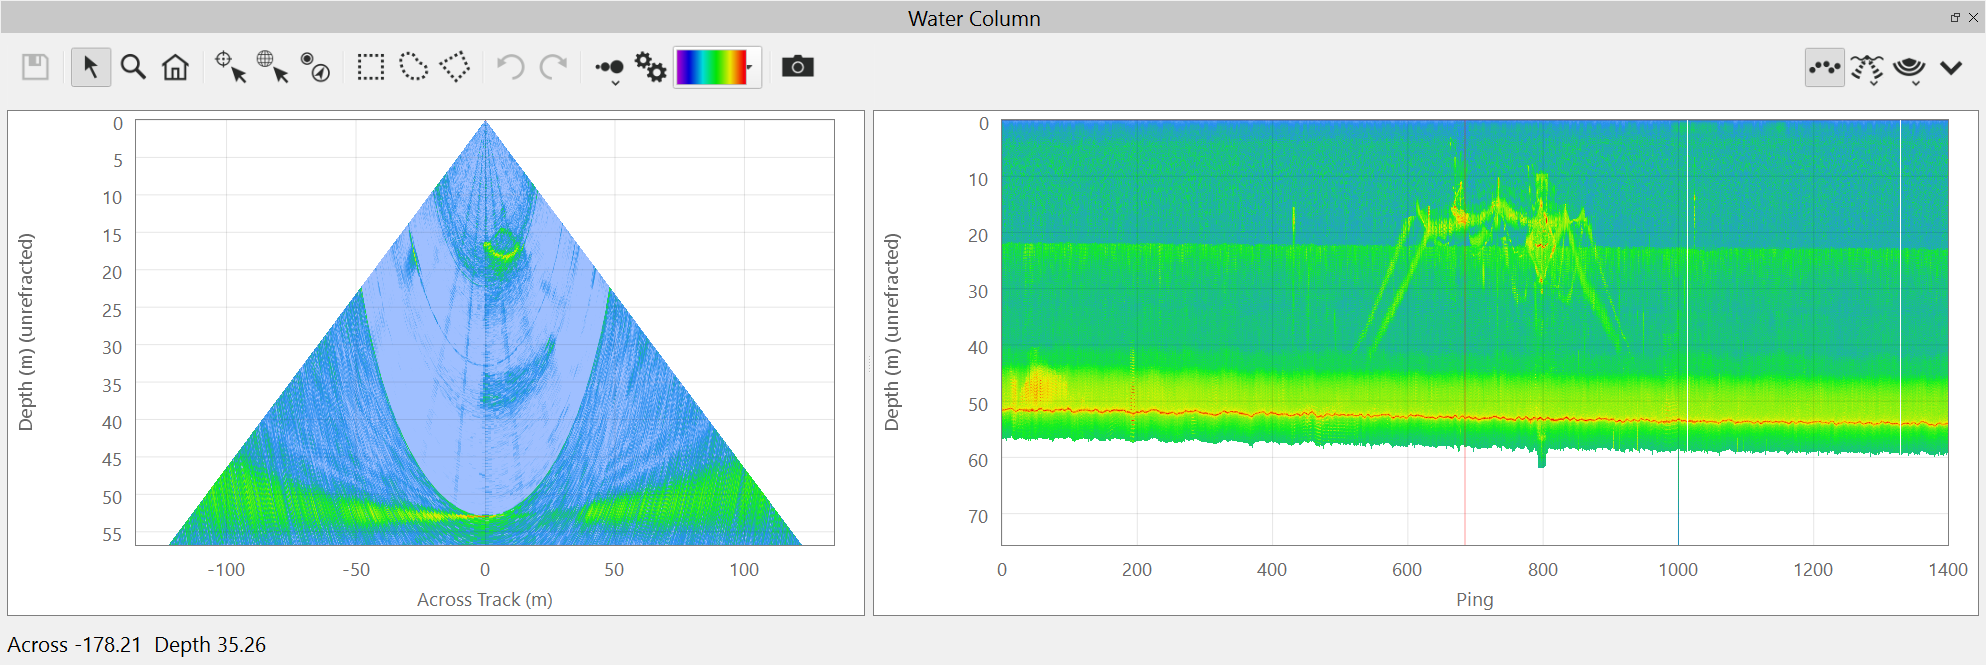
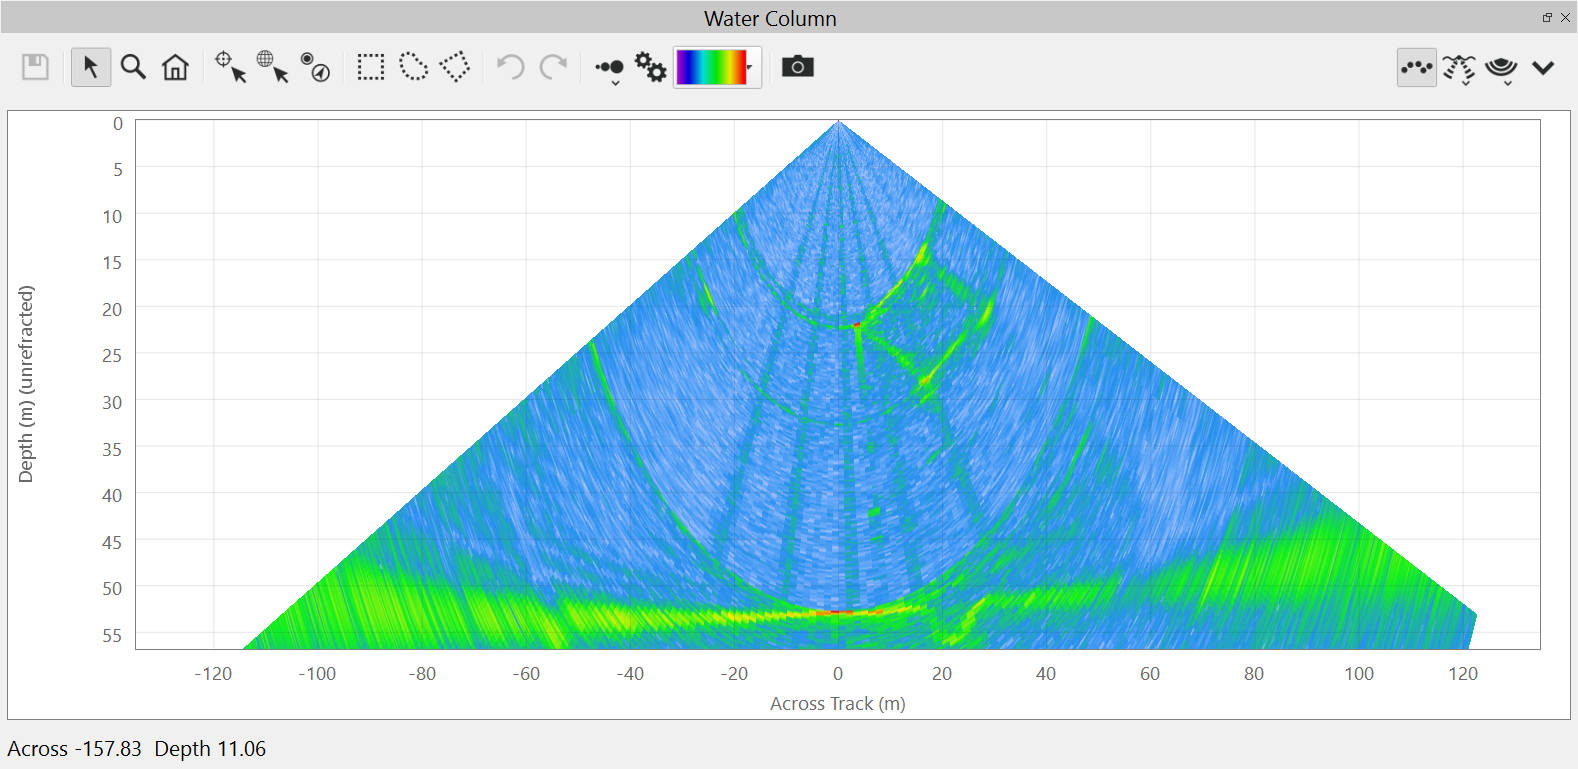
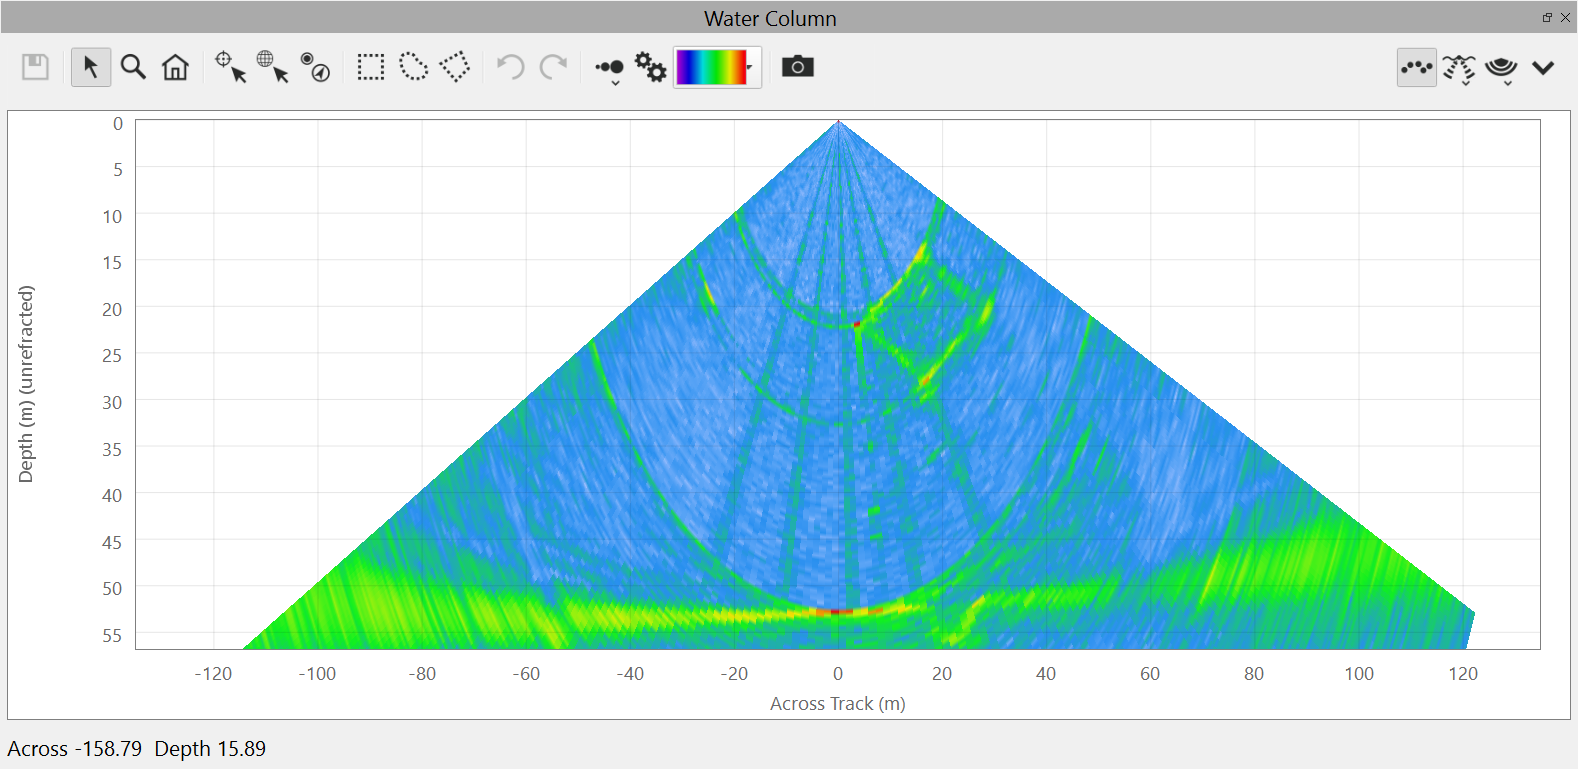
Side View - Stacked by Depth
This option will show a depth stack in the Side View. Depth stacking takes the maximum value of each beam at a specific depth. This provides an approximate geo-corrected image as shown below. It is as if the view point is looking through the water column perpendicular to the direction of travel.
Set User Picks as Features
This option will automatically set the feature flag of all water column picks. This allows for quick workflows that use the feature flag markup, for example, CUBE processing can use the feature flag to generate custom hypotheses.
Add User Pick for ENC Point
This option will automatically add a user pick for the sounding selected as the ENC point object. This performs the same operation as the Add Sounding mode above.
Show Soundings
This option will turn all soundings on/off. It is also accessible via the toolbar button.
Normal
This option will show/hide the normal sounding solutions. They will be colored red (Port) or green (Starboard).
User Picks
This option will show/hide the user picked water column soundings. They will be colored magenta by default.
Additional
This option will show/hide the additional soundings found by the sonar. They will be colored blue.
Save Fan Image
This option will allow you to save a JPEG or PNG of the fan view to disk.
Save Side Image
This option will allow you to save a JPEG or PNG of the side view to disk.
Save Fan Snapshot
This option will allow you to save an SD object of the Fan view at the current ping. If you are in stacked fan mode, the imagery will be stacked. Any constraints applied by the Constraints dialog will also be shown.
Save Side Snapshot
This option will allow you to save an SD object of the Side view of the current buffer. The SD object will follow the track line. Any constraints applied by the Constraints dialog will also be shown.
Show Grid Lines
This option will show/hide the grid lines on the plot.
Sounding Views
The water column view can also show the sonar computed soundings as points on the plot. The soundings views are controlled by the menu.
No Soundings
Normal Soundings
Additional Soundings
User Picks
All Soundings
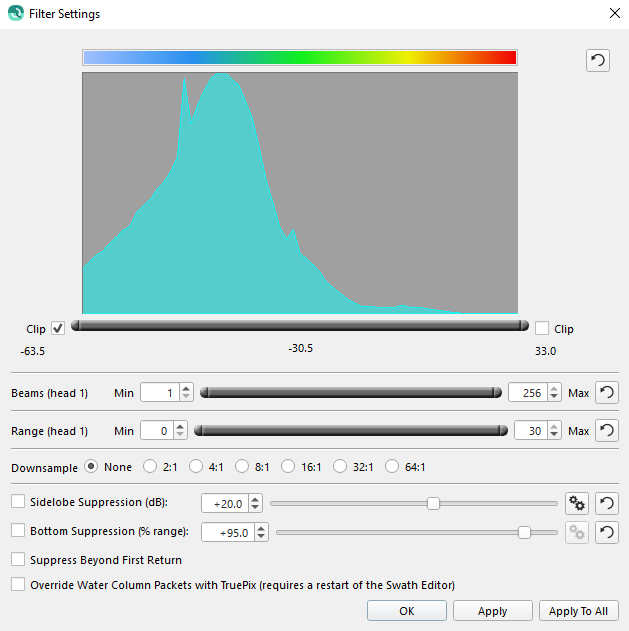
Filter Settings Dialog
This dialog controls the display of the water column data within both the Fan and Side views of the data. It consists of a current histogram control, beam limit control, range limit control, down sample control, and specialized filtering.
Histogram Control
At the top of the histogram control is the current colormap that is used in the water column display. These are the colors that are mapped across the stretched histogram.
The next section of the panel is the histogram display. The cyan histogram is the base histogram for the currently loaded file. As you change the composite slider below the histogram, you will see a blue histogram that represents the "stretched" part of the histogram that you have selected. The vertical cyan dotted lines represent the portion of the main histogram that you are stretching.
The Clip check boxes on the left and right of the histogram allow you to either clip or clamp signal values outside of the minimum or maximum of the composite slider. This allows you to clip or clamp data to the minimum and maximum limits. Clamping keeps the data, while clipping eliminates the data. During minimum clamping, if a value is less than the minimum limit, the value is set to the minimum value. During maximum clamping, if the value is greater than the maximum limit, the value is set to the maximum limit. Clipping results in a "no data" assignment to the samples that are clipped, resulting in a transparent view in image and snapshot products. This also allows for easier selection of particular targets since the signals that are not of interest are ignored when selecting areas in the views.
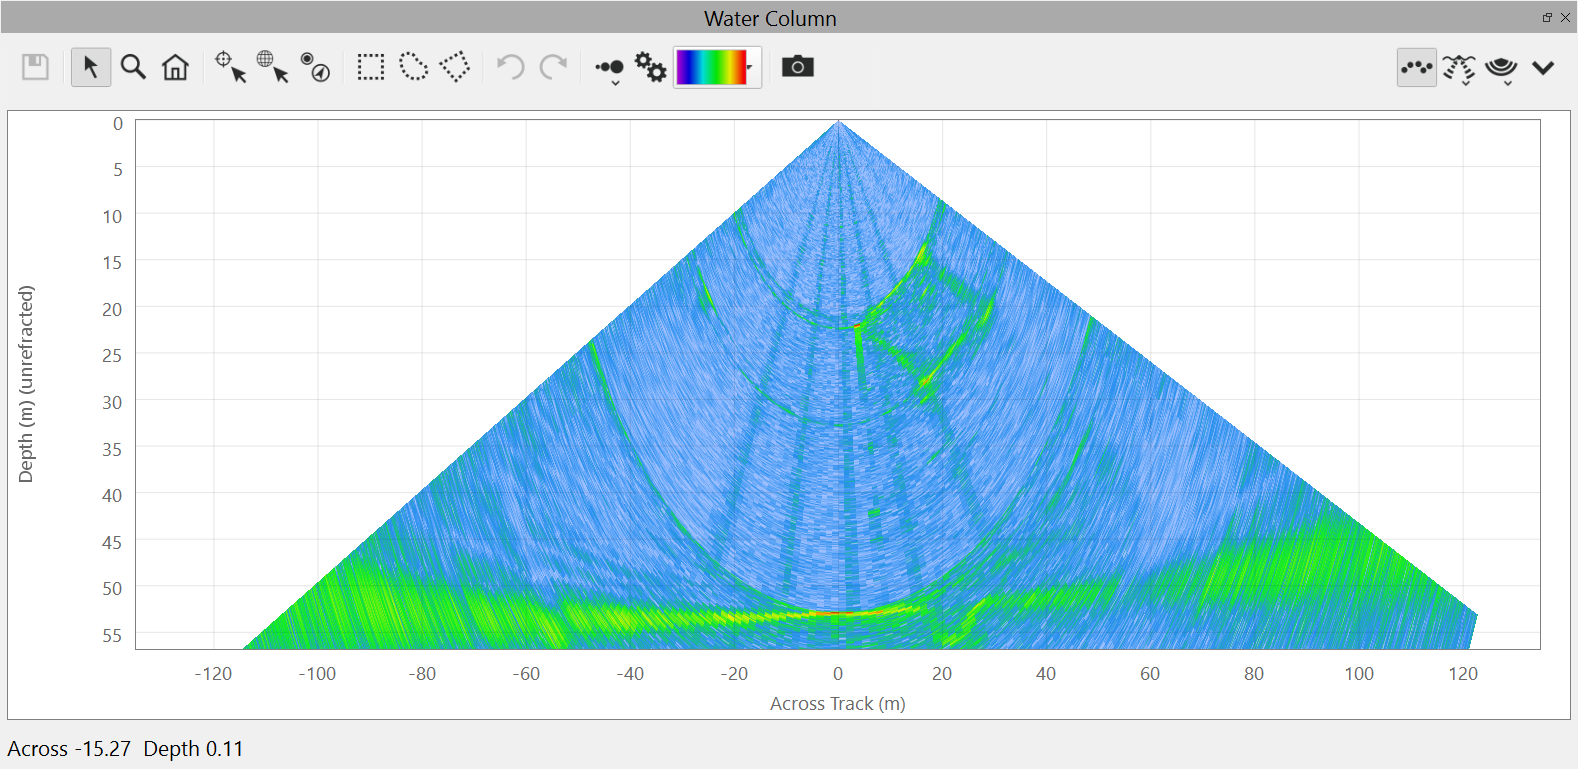
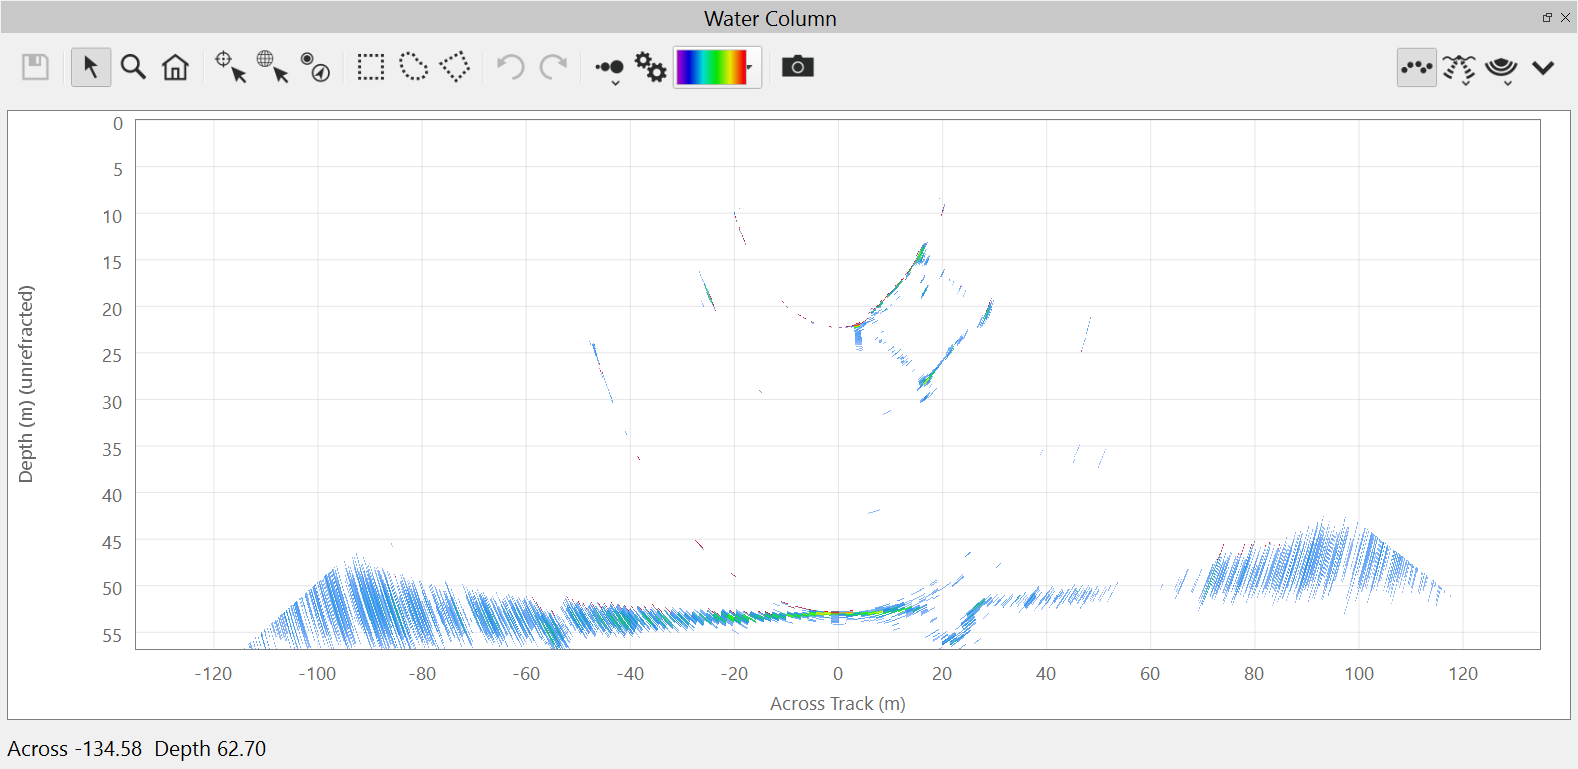
The composite slider at the bottom of the panel is used to set min/max thresholds limits for the water column data. Each end of the slider can be click-dragged to change either the minimum or maximum value of the threshold. The center of the control can also be click-dragged to move the entire min/max over the desired range. The examples below (before/after) show the result of the histogram settings of -33dB to 0dB.
Beam Limit Control
The beam limit control allows you to change which range of beams are viewed in the water column display. If you have dual head data, you will have 2 controls. The composite slider works that same as the one in the histogram in that it allows you to set the min/max limits of the beam numbers. An example is shown below (before/after) using beams 31-134.
Range Limit Control
The range limit control allows you to change the range of samples viewed in the water column display. If you have dual head data, you will have 2 controls. The composite slider works the same as the one in the histogram in that it allows you to set the min/max limits of the range. Range is an approximate computation utilizing the sample number, sample interval and head sound speed. An example is shown below (before/after) using a range of 10-46.
Downsample Control
This allows you to reduce the amount of data that is plotted in the display. Some sonar's have very high resolution time series data. If you find that plot times are slow, you can change your downsample amount. By default, Qimera will do no downsampling to the data. The examples below show no down sampling, 2:1, and 4:1. When downsampling, the resulting resolution of your picks will be downsampled as well. Downsampling is useful for speeding up exploration of data, but returning to a setting of None allows you to select data at the highest sampling resolution.
Sidelobe Suppression
The sidelobe suppression filter will attempt to remove sidelobe artifacts in the water column data. The slider can be used to adjust the cutoff value of the filter. By default, this is 20dB. An example (before/after) is shown below with an 8dB cutoff.
Bottom Suppression
The bottom suppression filter will remove all time series data below the bottom detection. The slider is used to set a range percentage at which the filter starts. By default, this is 95% of the detected bottom. An example (before/after) is shown below using 90% range. This is useful for removing strong returns from the bottom when a weak return from the water column is desired. This is particularly useful in areas of strong topography.
Suppress Beyond First Return
This option will find the first return, typically the nadir return, and suppress water column data beyond that range.
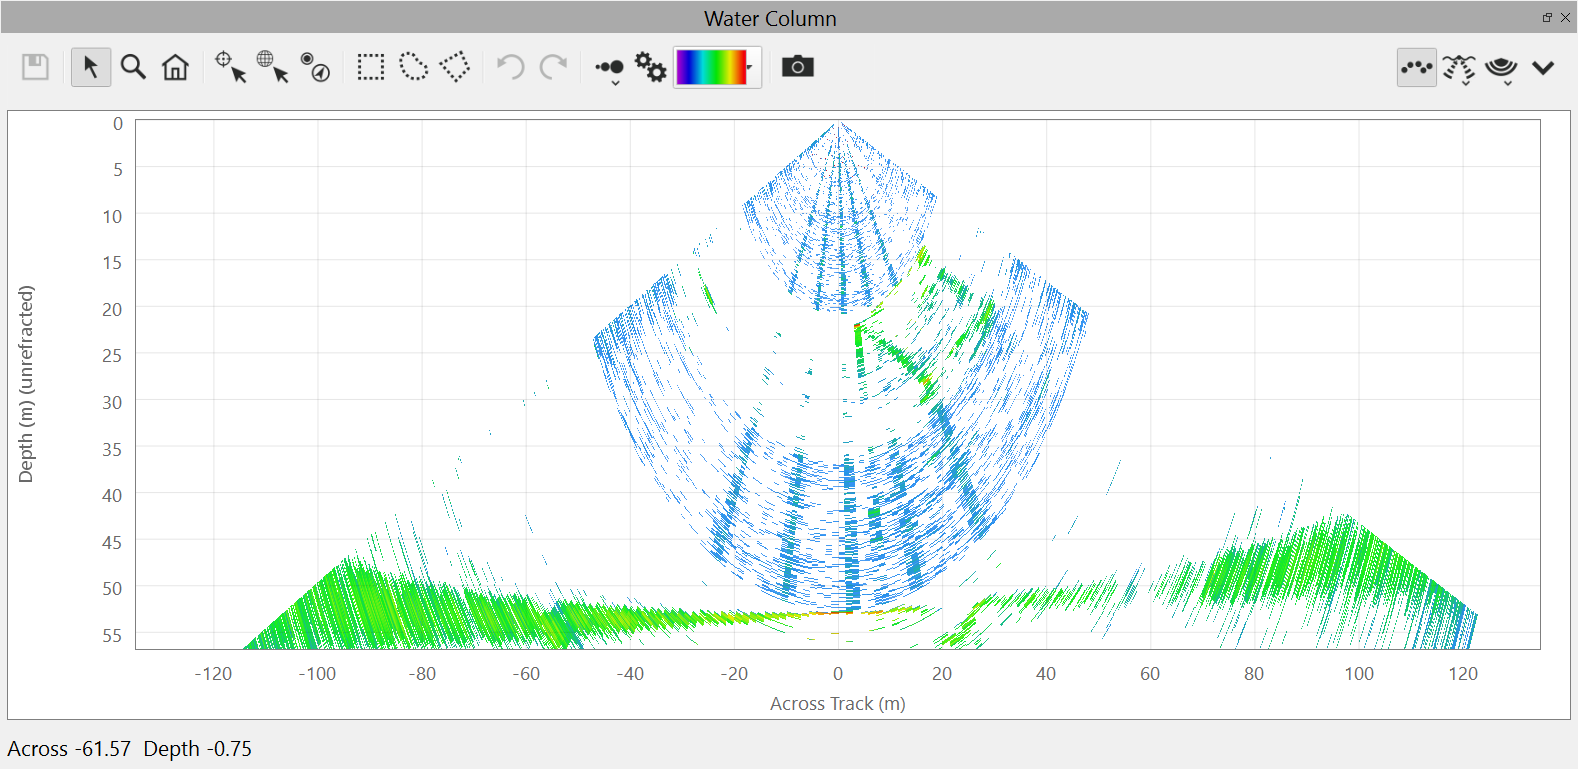
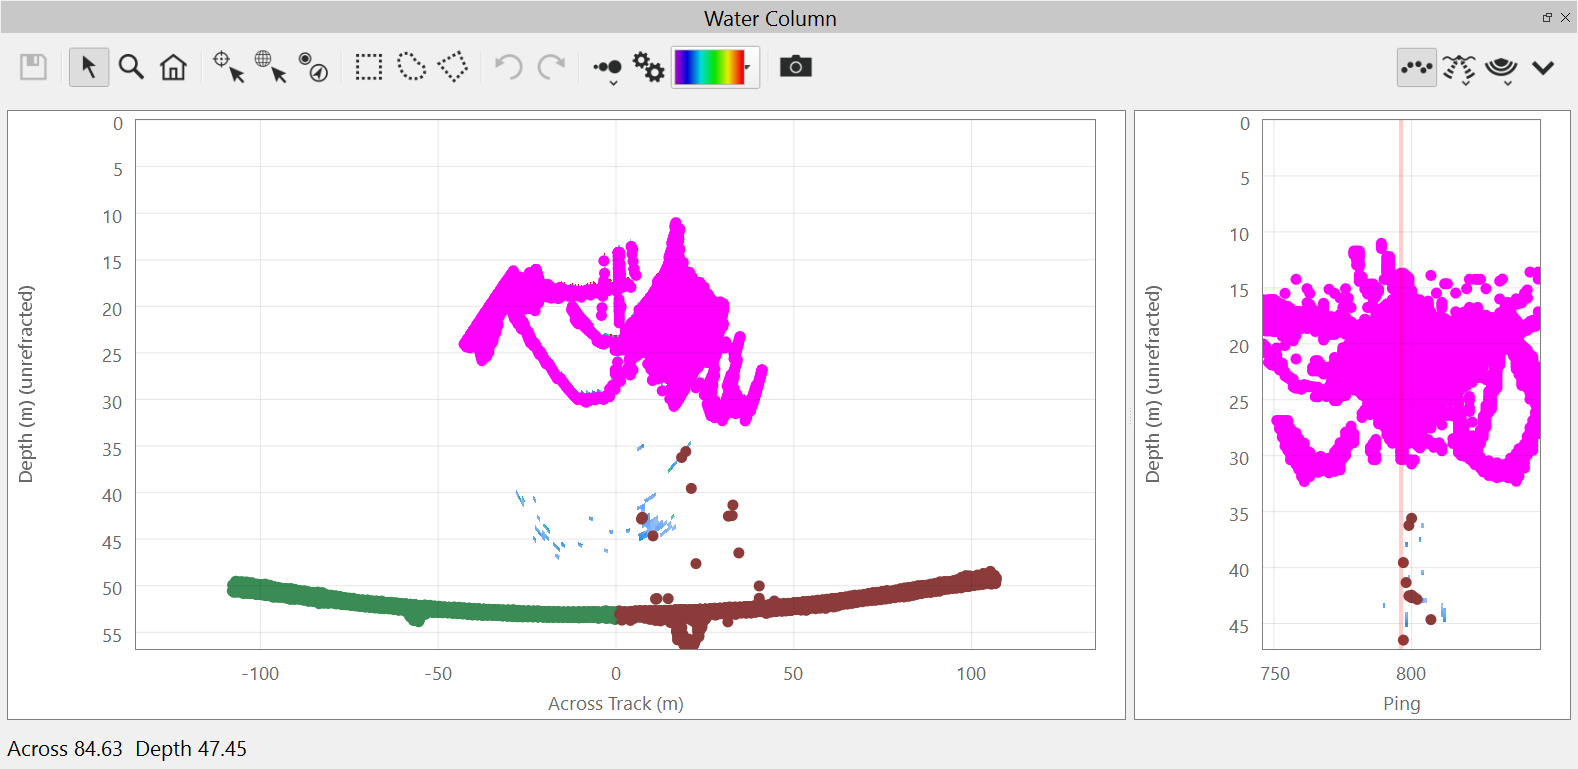
Below is an example using the settings shown in the dialog above. The Fan is in Stack mode and we are left with 2 views of the water column contacts that can be easily selected as additional soundings in either view.
Override Water Column Packets with TruePix (requires a restart of the Swath Editor)
As of Qimera 2.0, the water column viewer can display R2Sonic TruePix packets. TruePix packets (TPX0) will be displayed automatically if R2Sonic Water Column (WCD0) packets are not present in the raw file. If the raw file contains both TruePix and Water Column packets, the Water Column packets will be displayed by default. To override this behavior and view the TruePix packets, check this box and restart the Swath Editor. At this time only TruePix packets containing D1 (16-bit magnitude and direction data) is supported for water column viewing.
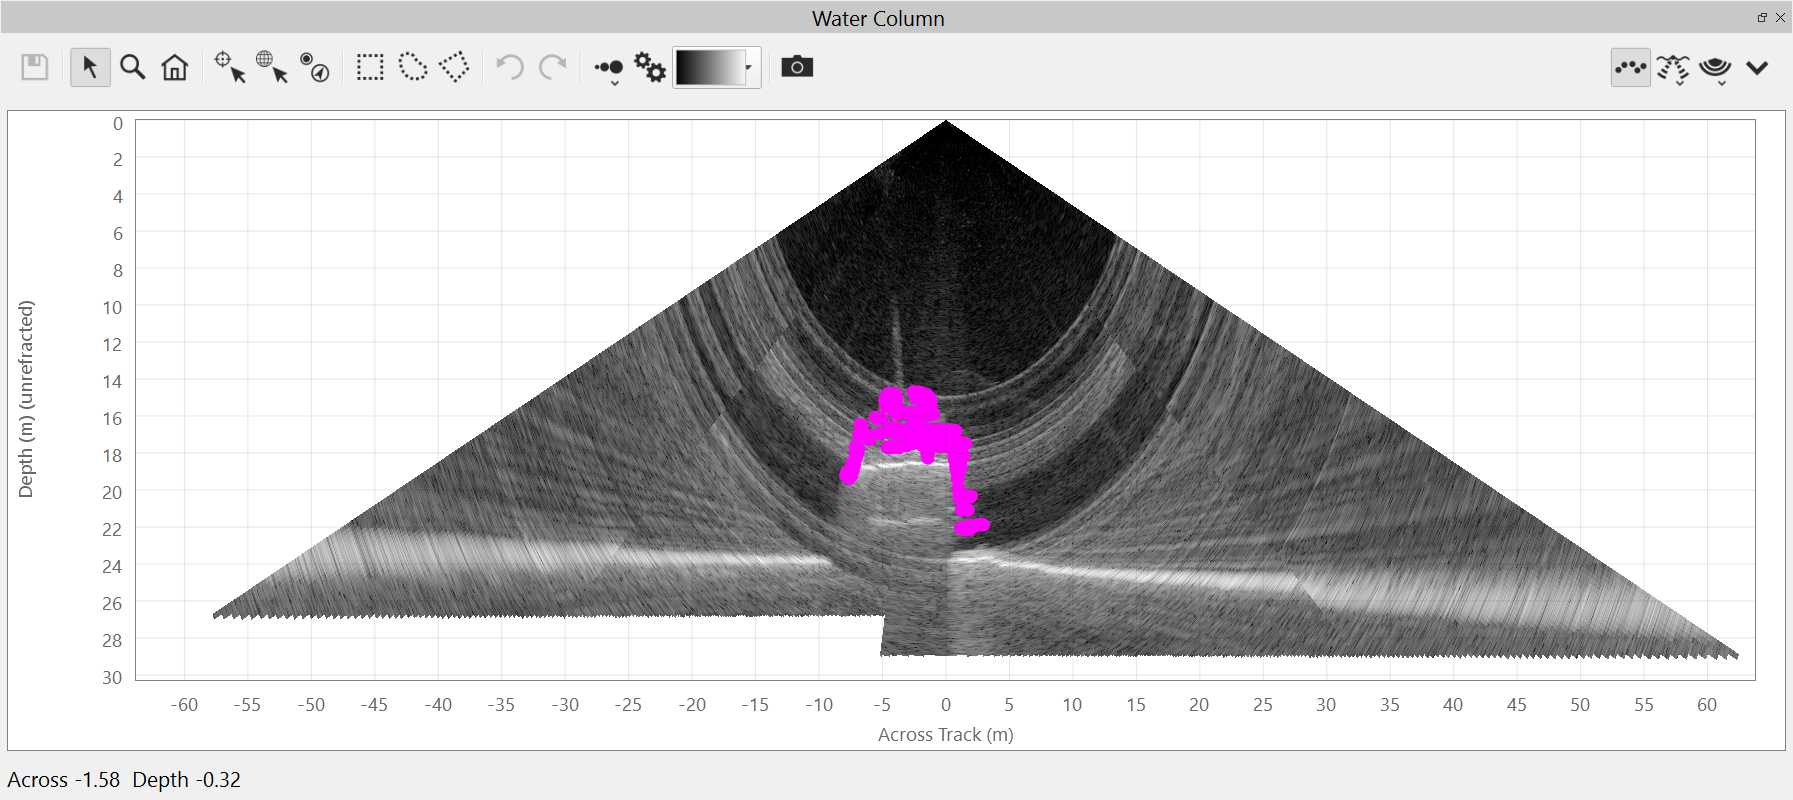
Sounding Extraction
Using the Filter Settings dialog to limit the amount of samples that will be considered for extraction, you can then use one of the selection tools to add soundings to your loaded line. The examples below show the water column data before and after adding user picks. Once you have done all of your picking, you must save the results using the Save button. The raw sonar file will then become "dirty" and will await re-refraction. To do this, simply exit the Swath Editor and click on the Auto Process button. Your user picks will then be refracted and added to your QPD. If you choose to include user picks in a dynamic surface, these will be updated as well. You can also use the Export menu for Raw Sonar Files to export these soundings to an SD Point or SD Cluster object for further processing and analysis in Fledermaus. You can also export your newly created soundings into a text file from the Export menu for Raw Sonar Files under the to Processed Points option. In this last option, the dialog that launches will allow you to choose which types of soundings to extract from the Filter Setup option in the dialog.