FMGT - Tools Menu
The tools menu contains advanced tools allowing finer control over the output mosaic products.
Tools Menu
Beam Pattern Correction
The Beam Pattern Correction menu option opens the dialog shown in the Beam Pattern Correction Dialog figure. It displays the beam pattern of the current virtual "patch" of data, the current theoretical model beam pattern and the beam pattern correction plot which is the difference between the actual and theoretical curves.
To begin, use the Edit Segment tool to select a portion of a track line as show in the Edit Selection Tool figure. When you initially activate the Beam Pattern Correction tool, it will read the selected pings into a virtual patch that can be used by the ARA inversion algorithm. Once the dialog is up, you can either manually select a bottom type or use the FMGT ARA algorithms to compute the proper classification. After computing, the dialog will be updated as show in the Beam Pattern Correction - After Classification figure.
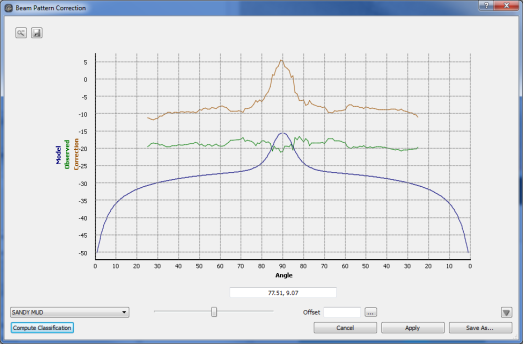
Beam Pattern Correction Dialog
Once the desired beam pattern correction has been defined, the user can either save it to an external file using the Save As button or apply it to the current project using the Apply button. Once applied, the user must re-process the backscatter data for the file.
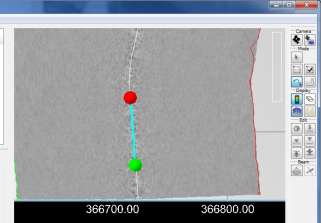
Edit Selection Tool
It is important to note that the beam pattern correction file contains the difference between the current backscatter value and the desired theoretical model value for each angle (0..180).
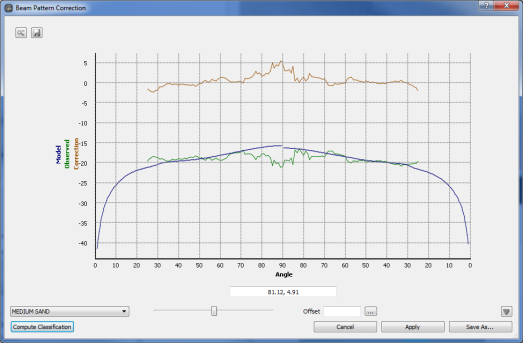
Beam Pattern Correction - After Classification
Beam Pattern Viewer
The Beam Pattern Viewer menu option opens the dialog shown in the Beam Pattern Viewer figure allows the user to view the previously applied beam pattern for the project.
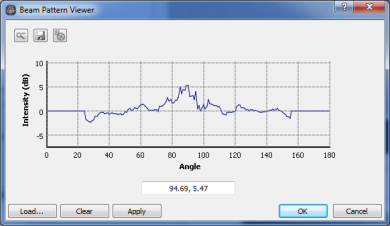
Beam Pattern Viewer
The user can then load another external beam pattern correction file or clear the beam pattern correction for the currently loaded project.
Patch Analyzer
The Patch Analyzer menu option opens the Angle vs. Range dialog shown in the Angle vs. Range Analysis Dialog figure and is used to view and edit the output of the ARA Inversion stage of FMGT processing. If the user has not run ARA Inversion, the default characterization will be shown by the blue line. At this point, the user could manually select the appropriate values or run the model for the current patch.
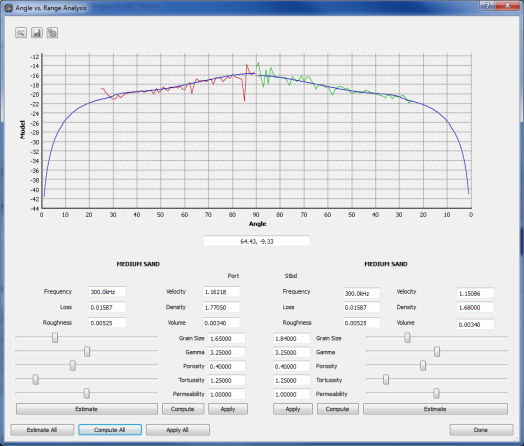
Angle vs. Range Analysis Dialog
Angle vs. Range Analysis (ARA) is a method of seafloor characterization which compares the actual backscatter response to expected acoustic response curves based on a mathematical model (the Jackson Model). Due to the nature of the process, we prefer to use the term characterization rather than classification. For this process, you have a mathematical model (The Jackson Model) which generates an expected acoustic response curve as a function of grazing angle vs. returned backscatter intensity. This is a complex model where acoustic frequency and many sediment properties contribute to the overall modeled curve. As the parameters are adjusted the resulting modeled curve changes accordingly. The goal of the ARA is an attempt to characterize the measured response curve from the survey data using a best fit to the modeled curve. If a good match is found, we expect that tells us something about the sediment properties. However, many things can effect the veracity of the results starting with the quality of the system calibration and the appropriateness of the radiometric corrections applied. Many systems that have been well calibrated have shown good correlation between the characterized sediment types and measured sediment types. However, the ARA process is still in its infancy and much more ground truthing work needs to be done. One shouldn't automatically assume that because the process worked well for one sonar (an EM300x for example), it will automatically work as well for all systems. As stated above, good calibration is key to any hope of reasonable results from the ARA. The survey environment will also effect on the results, as using ARA requires a wide coverage of grazing angles. In deeper water where you often have limited grazing angles the process will not work or not work very well.
Line Backscatter Adjustment
The Line Backscatter Adjustment menu option opens the dialog shown in the Line Backscatter Adjustment Dialog figure. It allows the user to offset the processed dB value for the currently selected line. This is useful if you have a line where the overall brightness level is different from the surrounding lines. After selecting a line, FMGT will create a dynamic mosaic of the currently selected so that the user can interactively adjust the dB offset of the selected line and see the overall effect in the mosaic. If the mosaic has been tiled, the dialog will contain just the data for the tile that was selected at the position of the line selection. The offset is stored for further use in generation of future mosaics.
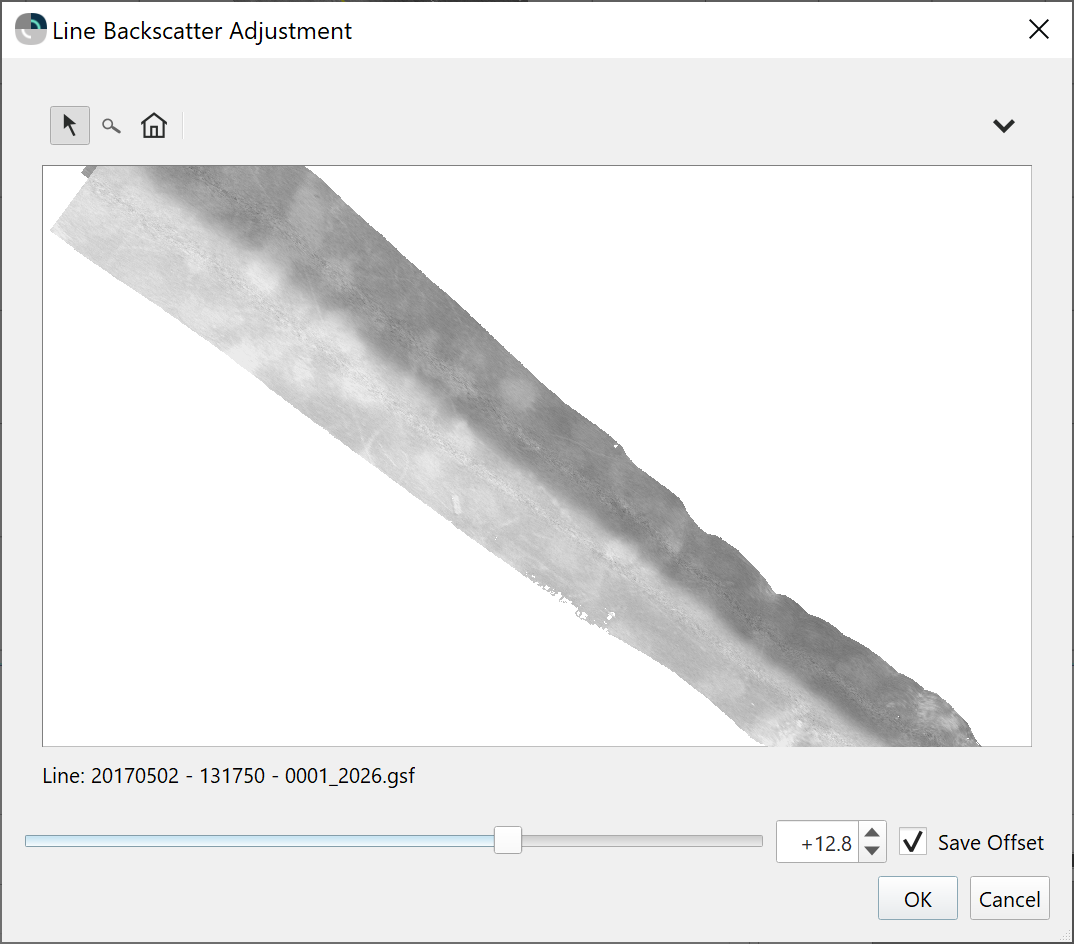
Line Backscatter Adjustment Dialog
Simply use the Bias slider to change the offset value that you want to apply to the line. Once you hit the OK button, FMGT will apply the offset and refresh the currently selected mosaic. The tickbox option to Save Offset will save the resulting line bias offset to be used for further processing with other mosaics that are created after the line adjustment is done. It is saved in the same data field in the project as the offsets that are calculated using the Cascading Backscatter Normalization Tool. This allows the user to use either tool to adjust the results of the other.
Intra-Vessel Backscatter Adjustment
This tool augments the original Backscatter Adjustment Dialog by allowing level adjustment across multiple line configurations. This capability is typically required in a multi-vessel project. It allows you to more easily adjust the levels of files from multiple vessels by utilizing the processing settings to persist the adjustment level required to continue processing of additional lines. Then as lines are added and configured to use the correct settings, the adjustment is automatically incorporated during processing.
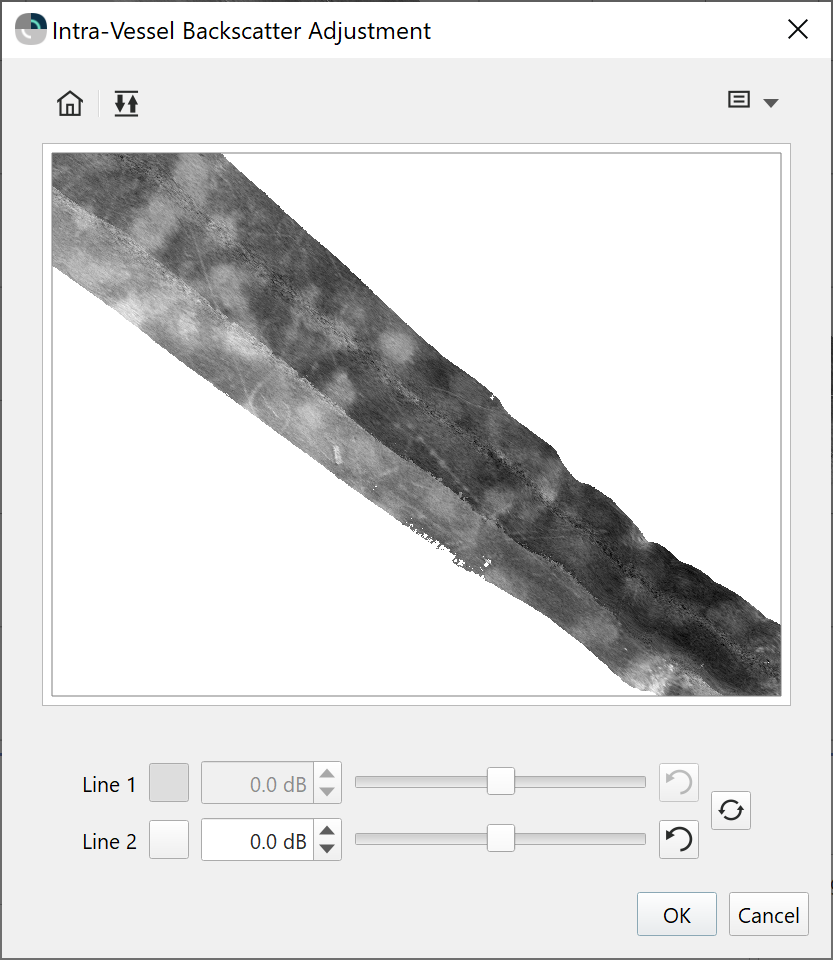
Intra-Vessel Backscatter Adjustment Dialog
Before using this dialog, you need to ensure that the lines you are trying to match are configured to use different Processing Settings. You can see this by right clicking on a line and selecting the Set Settings option. You can also see how many configurations you have by looking in the Settings->Processing Parameters menu.
In order to run the dialog, you need to have 2 lines you want to use to determine the adjustment level checked in your project tree view. You also need to have a mosaic tile selected. This mosaic must contain data from the two lines of interest, otherwise the adjustment will not work. If your mosaic has only 1 tile, you can just select the mosaic. FMGT will then extract the backscatter data per line and separate the lines as separate layers in the tool. You can zoom into the display using the mouse wheel or click-drag to pan around the display. Click on the home button to zoom back out to the extents of the data. You can also change which line is on top by using the layer swap button.
Either line can be adjusted manually using the slider bar or the spin box. The levels will be saved into the configurations of both processing settings. If you want to use one of the lines as a reference, simply click the lock button next to the line of choice. You can also attempt automatic level matching using the Auto Match Levels button when you have chosen a reference line. Once you are satisfied with the adjustments, click OK to exit. This will cause FMGT to save the offset value in the Head 1 and Head 2 Bias options of the specific Processing Settings. You will then be warned that these changes require complete reprocessing of your data. If you want to replace your current mosaic, simply click the Mosaic button to proceed with processing. The resulting mosaic will have your adjustments applied to all associated lines. The two images below show a simple before and after result.
Before Level Adjustment | After Level Adjustment |
If you are evaluating the dB difference between different sonar modes for Kongsberg sonars, you may want to move the resulting Head dB offset to the appropriate location in the sonar specific mode corrections in the Processing Parameters dialog. Be sure to set the Head 1 and Head 2 dB bias back to zero when you do this.
Cascading Backscatter Normalization
The Cascading Backscatter Normalization tool allows you to normalize the backscatter across an entire survey to compensate for occasions when different survey lines have different backscatter levels. The tool is semi-automatic in that you must select one or more reference lines and then the dB offsets are calculated for all other survey lines relative to the selected reference lines. A snapshot of the tool in action is shown below, with a before and after image showing the result.
You run the tool by selecting a mosaic in the Mosaics node in the Visual Objects dock. It will load up the tool and will list all of the survey lines that contribute to the mosaic in the Source Item table.
The next step is to choose a reference line that you want to normalize, or balance, all other survey lines against. You can middle click in the map view to pan (or left-click and drag) and you can zoom with the scroll mouse. As you move your mouse over the map, the survey line that falls under the cursor position is listed immediately below the map, along with the color code that is used in the Plot Color column of the table view. If you find a survey line that you like, you can left click on the map and the Source Item table will scroll down to that particular line. You can then tick the Reference checkbox to set the selected line as a reference. Note that you can select multiple reference lines, these lines will then not have an offset applied and all other lines will be leveled against them, to the best of the algorithm's ability.
Once a reference line is chosen, click the Compute Offsets button at the bottom of the dialog. The process will launch and a status bar will be shown on the bottom section of the dialog as the algorithm goes through various stages. Once complete, the Offset column will be populated with dB offsets per line. The map view will also be updated with a preview of the result. You can zoom/pan to isolate areas that did not get adequate compensation and you can left click to isolate the associated line. You can then untick the Reference tickbox for that line and manually adjust the offset in the Offset column. The map will visually update to give feedback on the manual adjustment.
Once complete, you click Ok to apply. The mosaic that was selected to start the process will then be updated and the dB offsets are saved for each line in the project folder, as long as the Save Cascading Normalization line offsets checkbox is checked. They are also used in any subsequent creation of new mosaics. You can adjust the offsets individually after this by using the Line Backscatter Adjustment tool.
Some tips:
The recommended workflow is to create a lower resolution mosaic to work on, the recommendation for lower resolution is so the offsets can be computed more quickly and displayed in the preview pane. Also, user tweaks to the offsets can be done in a more responsive manner with a lower resolution mosaic.
Make a mosaic named 'before' and one named 'after', then run the tool on the mosaic named 'after'. This allows you to easily compare the results, and you can export both mosaics for reporting.
When choosing a reference line, it should be one of the longer lines in the survey and it should be free of artifacts from problem sources like bubble washdown or uncompensated sonar settings.
For the interested reader, the algorithm works like this:
For each selected reference line, search all other lines and determine the one line that overlaps the most.
Repeat step 1, but with the line that was just found.
Do this until all lines have had a matching overlap line. Note that it is possible that some lines do not overlap at all, thus they will have no matching line to compare against.
Start back with the reference line, compare mosaic layer of that line with that of its matching line by cross-correlating the histograms of each mosaic. The point of maximum correlation gives the dB offset.
Repeat step 4, going through the cascade sequence of matching lines.
Plot Roll/Pitch
The Plot Roll/Pitch option displays the roll and pitch plots for the currently selected line as shown in the Plot Roll/Pitch figure. This dialog is also accessible from the context menu of the source file tree.
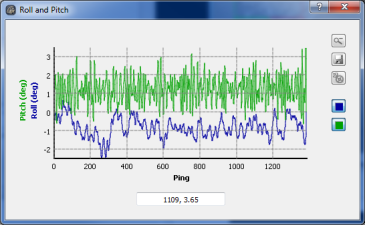
Plot Roll/Pitch
Plot Heading
The Plot Heading option displays heading plot for the currently selected line as shown in the Plot Heading figure. This dialog is also accessible from the context menu of the source file tree.
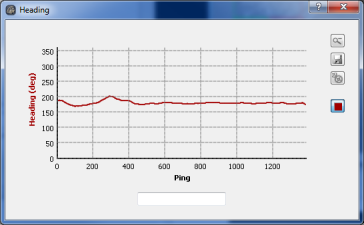
Plot Heading
Plot Heave
The Plot Heave option displays the heave plot for the currently selected line as show in the Plot Heave figure. This dialog is also accessible from the context menu of the source file tree.
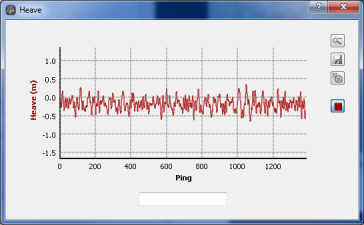
Plot Heave
Plot Power/Gain
The Plot Power/Gain option displays the power and gain plots for the currently selected line as show in the Plot Power/Gain figure. This dialog is also accessible from the context menu of the source file tree.
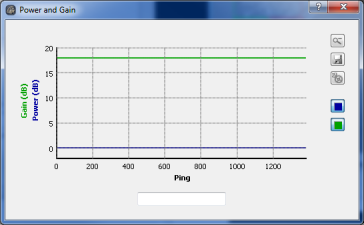
Plot Power/Gain
For more information about Plot Roll/Pitch, Plot Heading, Plot Heave, and Plot Power/Gain please see our Plotting Widgets section.
Examine Backscatter
The Examine Backscatter option allows you to view the raw backscatter data stored in a file external to your current project. This works just like the context menu of a source line except it allows you to view information about files external to your project. It brings up the dialog shown in the Backscatter Dialog figure that display a "waterfall" like image of the data.
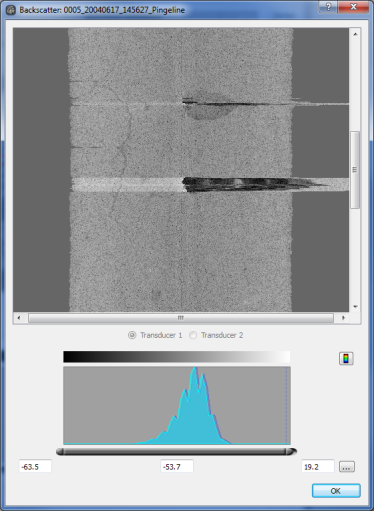
Backscatter Dialog
Use the scroll bar to scroll up/down through the data. The first ping is at the bottom of the display area and the last ping is at the top. You can change the histogram settings to bring out features but the dialog will have to re-render the waterfall. You can also change the color map by clicking on the color map button.
Examine Beam Average
The Examine Beam Average option allows you to view the raw beam average data stored in a file external to your current project. This works just like the context menu of a source line except it allows you to view information about files external to your project. It brings up the dialog shown in the Beam Average Dialog figure.
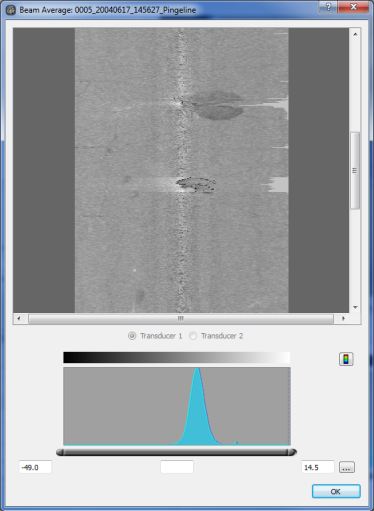
Beam Average Dialog
Use the scroll bar to scroll up/down through the data. The first ping is at the bottom of the display area and the last ping is at the top. You can change the histogram settings to bring out features but the dialog will have to re-render the waterfall. You can also change the color map by clicking on the color map button.
