
How-to Fledermaus - Pipeline Inspection
This How-to documentation will help users to setup an interactive pipeline object which provides functionality for analyzing, visualizing and reporting on pipelines within a Fledermaus scene.
These steps assume that you have the data required for creating the scene and each of its related objects.
Since version 7.7, the user is able to bring the pipeline data into Fledermaus either individually or as a batch import. This page will go through the steps of both processes.
Individual Import Step-by-Step
Step 1 - Create or Import a Dynamic Surface
You can either open a dynamic surface created by Qimera or create a new one in Fledermaus.
To Open up a Dynamic Surface from Qimera just click on Open Data Object/Scene and choose the SD file that you want.

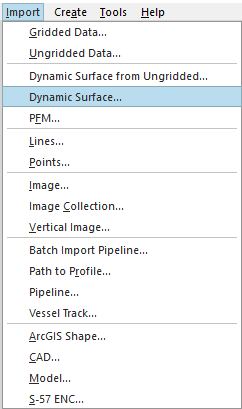
If you want to create one from Fledermaus you need to go to either the Import-Dynamic Surface or Import-Dynamic Surface from Ungridded options, select the files you want to use to create the Dynamic Surface (basically any file type you can use for importing Ungridded Data into Fledermaus).
You will then be asked to give the surface a name, specify a project folder, give it a cell size and a colour map.
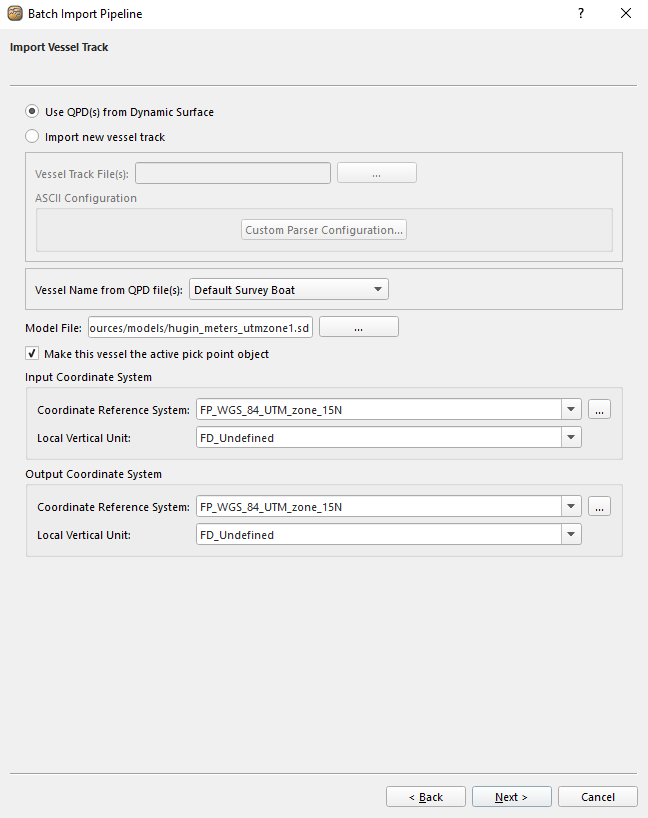
Step 2 - Import a Track File
The track file is required to give the scene a time frame and thereby associate future events to a time and fill in the time line.
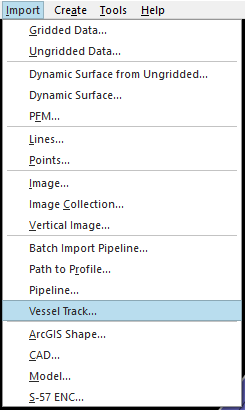
From the Import menu click on Vessel Track and select an xyt file. The parser should be set up correctly.
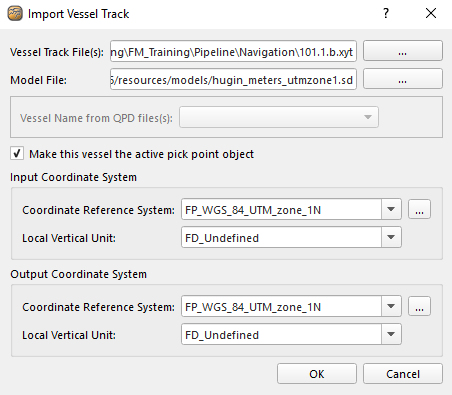
Then select an sd file for the model. If the .sd is in the same file location as the vessel track, Fledermaus will select it as the model file for you.
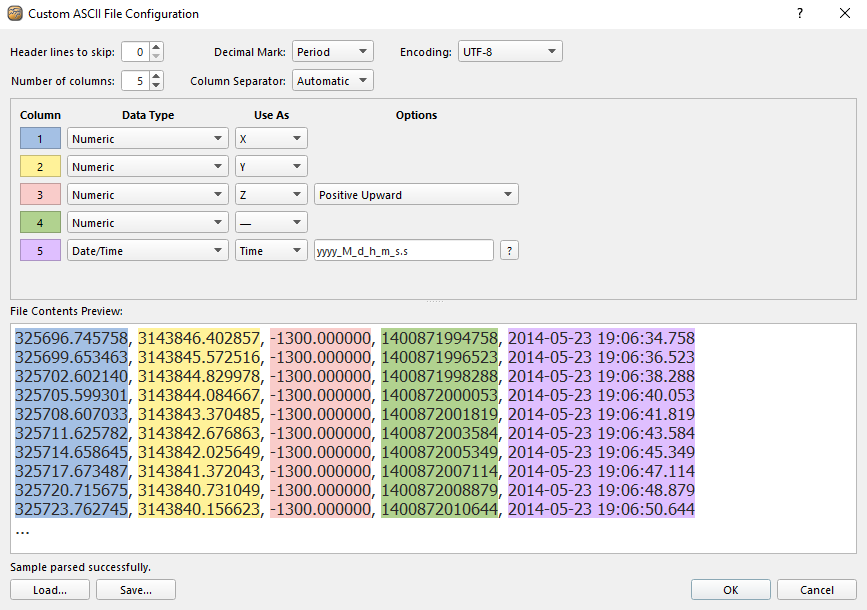
The input and output co-ordinate systems should already be correct, but make sure to double check. Once all inputs are verified, the ACII file configuration window will pop up, allowing the user to check that their file will be brought in correctly.
Additionally, it is recommended that you set a vertical exaggeration of 1x as we are dealing with models.

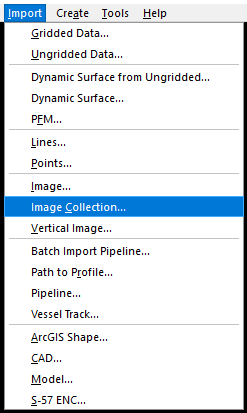
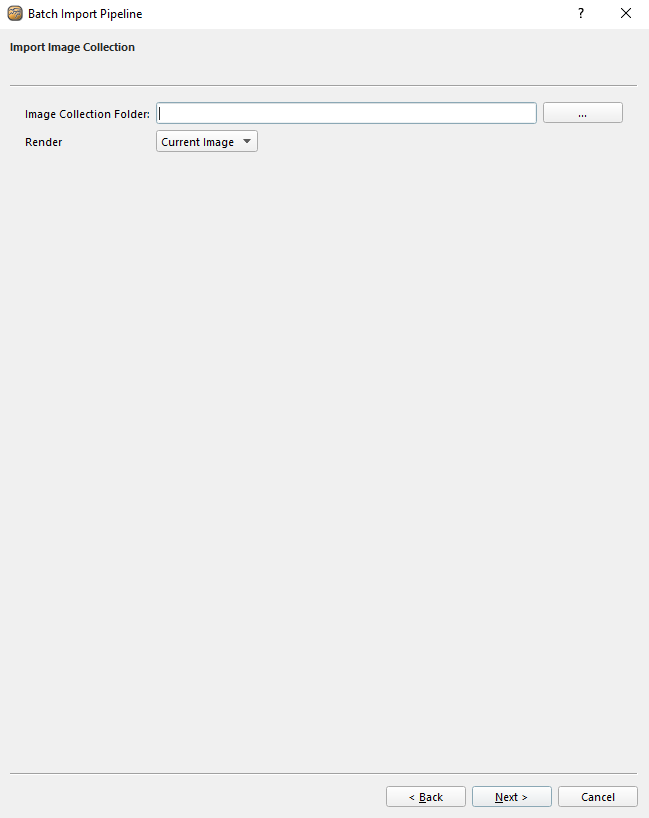
Step 3 - Add the Image Collection
To choose the image folder select Import – Image Collection and select the Images folder.
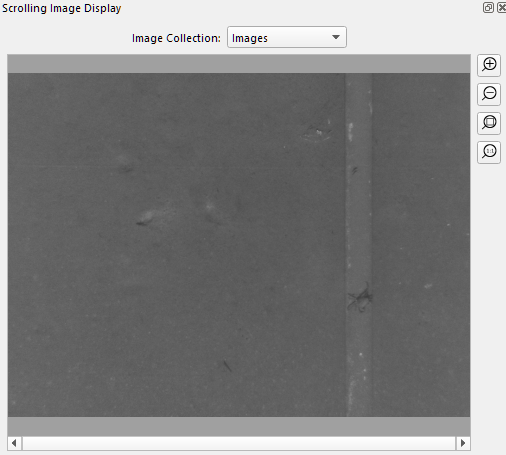
There should now be an image showing in the Image Display Window. (This window can be turned on and off in the Controls drop down menu)
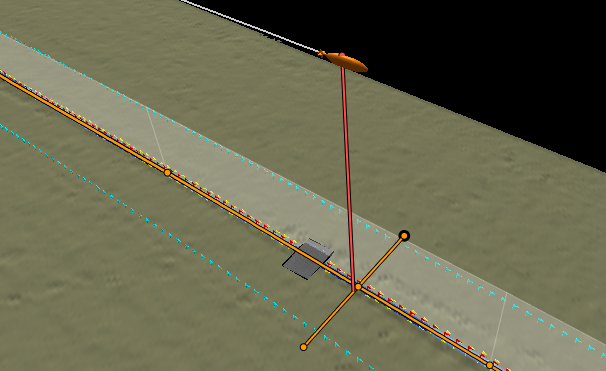
And also the same image in its location – but not draped.
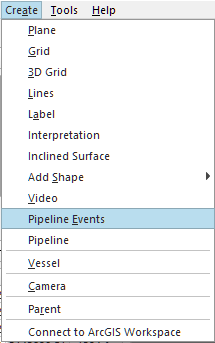
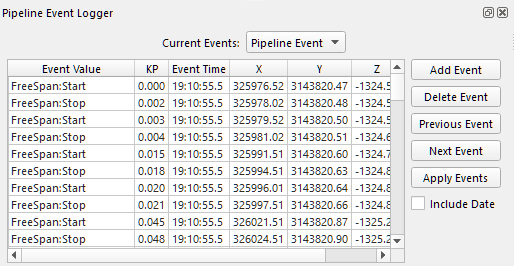
Step 4 - Create a Blank Events File
This is to store the event data that we will create.
From the Create menu, choose Events.
Step 5- Manually Digitise a Pipe
From the Create menu select Pipeline. You will then be asked to choose the dynamic surface that you want to use to digitize the pipe onto.
This will create an object called Pipeline1.
Click on the Edit Settings button to set the pipeline diameter and the reporting interval (delta KP), normally every meter. Set the turn violation to the correct value.
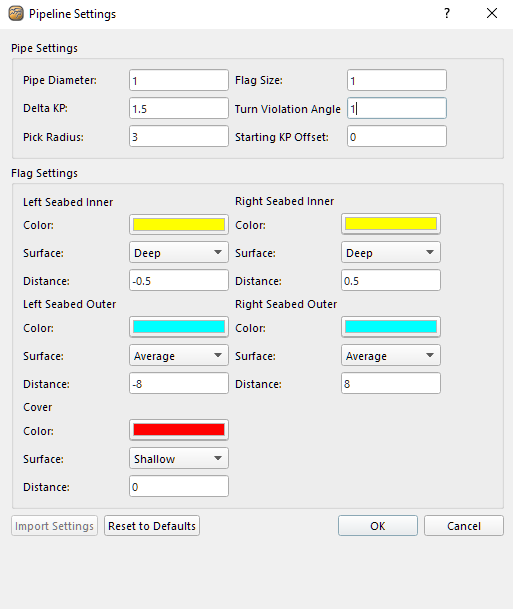
The distance to the Inner flags should be just longer than the radius of the pipe. The Outer flags is normally specified in the survey and depends on whether the pipeline is trenched or not, i.e. if it is they need to be further out as these flags represent natural seabed. Normally 5 meters for pipelines on the seabed.
Now it is time to digitize the pipe. When you click on the pipeline object a new set of icons appears at the bottom of the icon list.

We will be using the icon with the + to digitize points. If you make a mistake then choose the icon with the – to delete the point. The <-> icon allows you to move the control point – it doesn’t allow you to move at the interval points, only the grey control points.
Make sure the dynamic surface you said you were clicking on is visible, use the shallow surface and then click the Add Pipeline Control Point button and start clicking. Remember, you have to click on as many times as you need to represent the pipe. The program will draw a straight line between the points so make sure it is clicking on the top of the pipeline to ensure that the pipeline follows the surface. It does nothing fancy here, just straight line between clicks. Sometimes it is useful to use the standard deviation surface to highlight where the pipeline is. The dynamic surfaces can be used in the same way as in Qimera, i.e. you can change colour map, change the color by etc..
Once the pipeline has been digitized it will automatically try and work out where the freespans are and where any burial is. To review and validate the events you have to choose the Review Violations option from the Tools menu in the pipeline object.
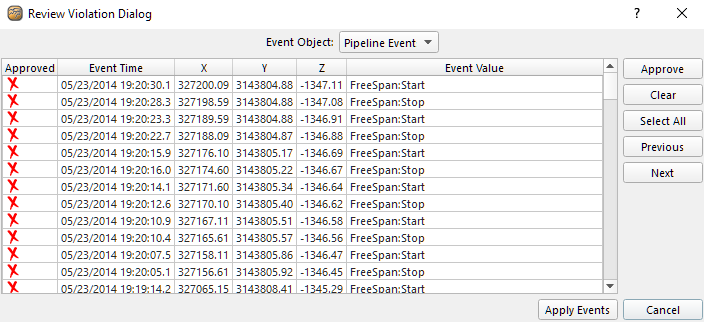
Double clicking on a specific event will take you to that location on the pipeline. You can either click on Approve on the Start or Stop of the freespan. This will generate an event and you will see it in the Events window and in the time line.
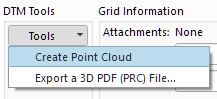
To help with determining the extents of a freespan or if it is a boulder or debris or…. you can use the point cloud display.
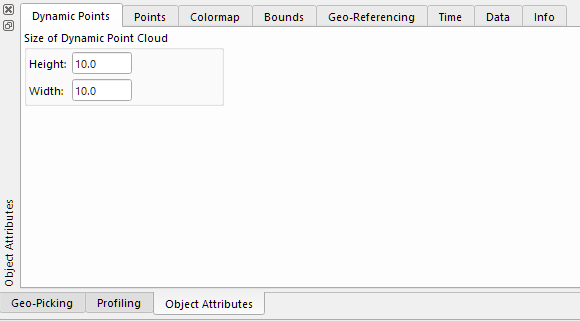
Click on the Dynamic Surface you want to see the underlying points of and from the DTM Tools menu select Create Point Cloud object. Then click on the Point Cloud 1 object that is created and change the size of the box if you want. Height is along the pipeline and width is across. You can rename the Point Cloud Object name to make it more relevant if you have say a multibeam dataset and a laser dataset.
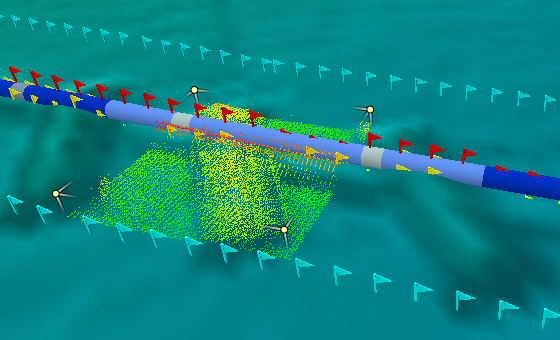
When you go to select mode you can click anywhere on the Dynamic Surface and it will show you the points in that box. You cannot manually draw a box. If you click on an event it will automatically open up the box around the event
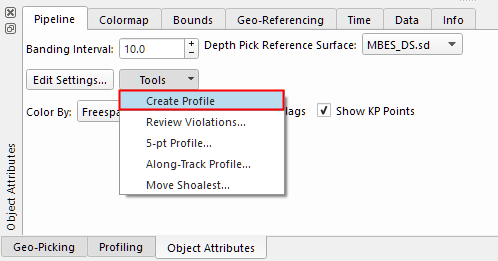
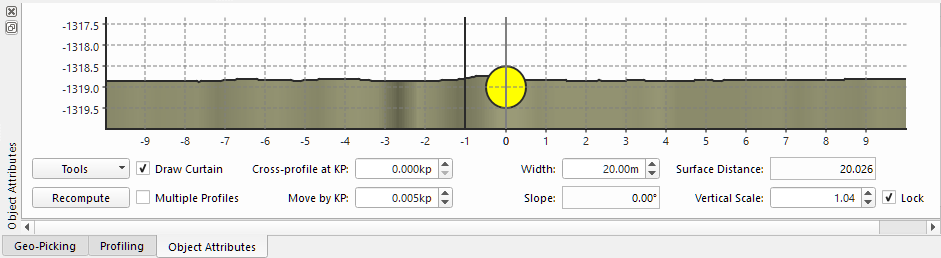
Step 7 - Creating Profiles
The long and cross profiles are created by selecting Create Profile from the Pipeline Object Tools menu. The long profile will be created automatically along the route and displaying whatever surface is shown in the Dynamic Surface. You can recompute if you want to see what the laser dynamic surface looks like along the pipeline.
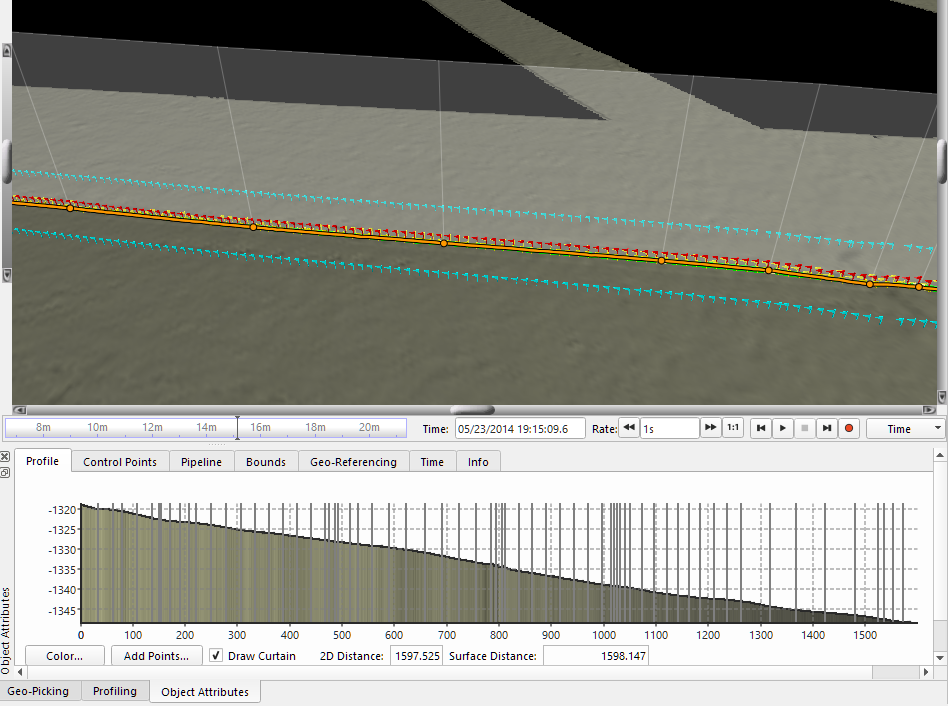
Clicking on the arrow next to the Profiler1 object will open up the Cross-Profiler1 object. The cross profile will automatically go to where the event has been double clicked. You can also go along the pipeline by first selecting Move By (this would be the interval required for the survey specification – 1m is normal).
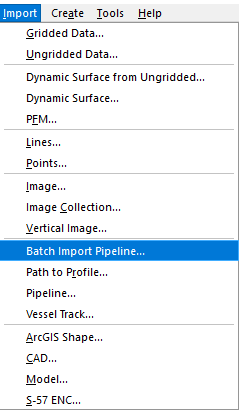
Batch Import Step-by-Step
In order to import your pipeline data in batch, navigate to the import drop-down menu and select the Batch Import Pipeline option.
Next you should follow the steps that the import wizard brings you through. First you specify which types of objects to create, as well as what type of source data is to be used.
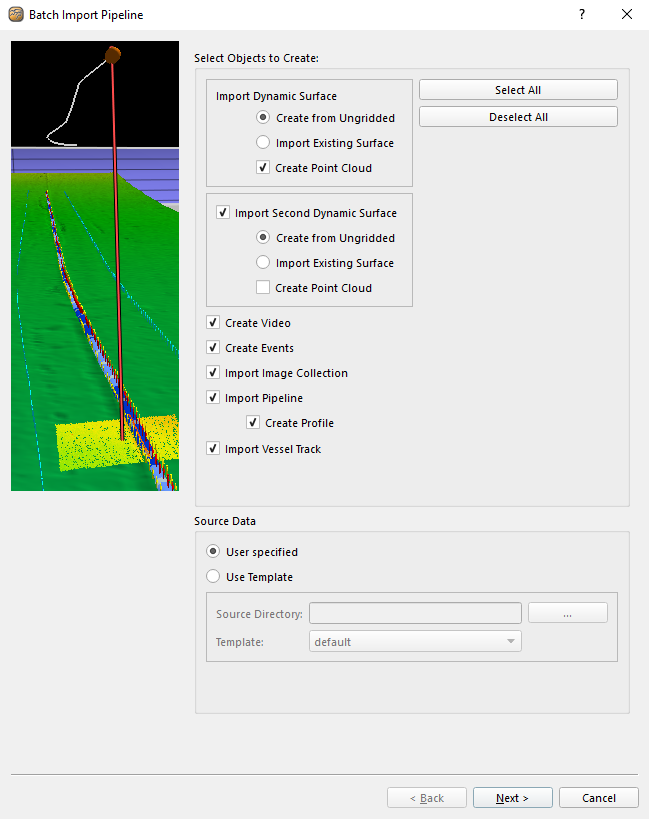
If you selected the Use template option, you will skip through the rest of the batch import wizard, as the template will tell Fledermaus all the inputs it needs to conduct the batch import. Custom templates can be created on the final stage of the wizard. Templates files (.tpl) are located here: C:\Users\<username>\QPS-Data\Templates.
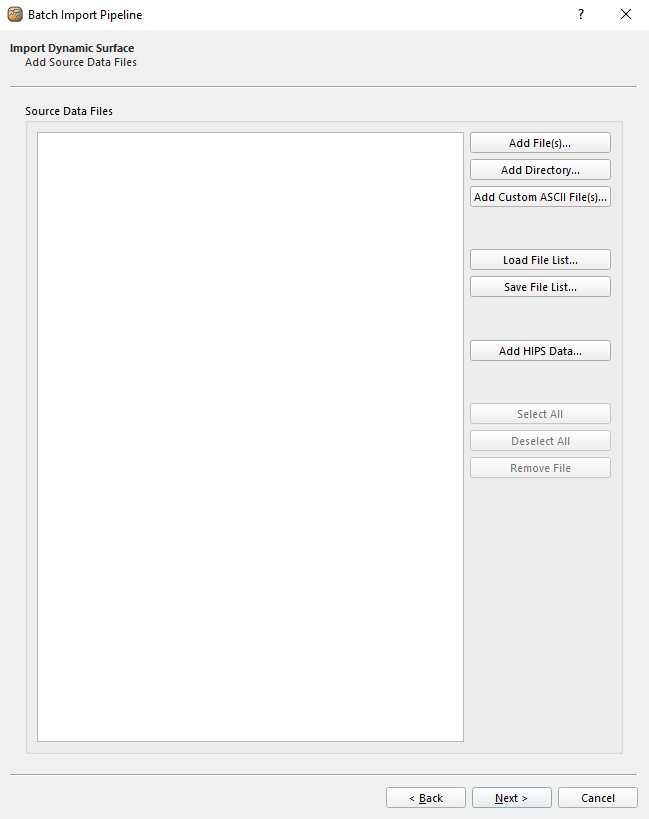
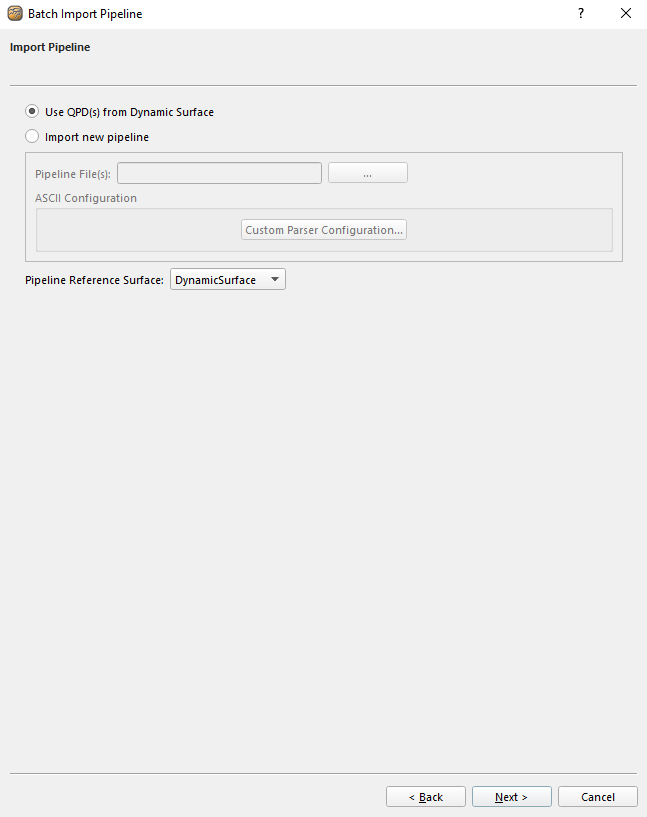
If you selected the User specified option in the source data section, you will continue through the wizard, and be prompted to bring in files for the import, including files to create dynamic surfaces, an image collection, a vessel track, and a pipeline file.
Fledermaus will then give you a summary of the batch import, to ensure parameters are set correctly. It is at this point in time that you can save these parameters to a template.
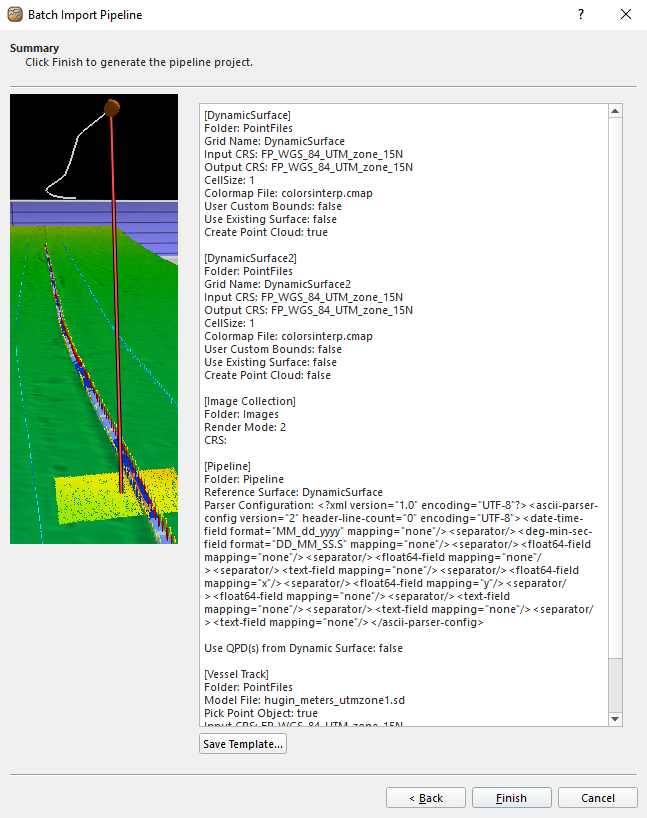
For more information on the batch pipeline import tool, visit our reference manual: Batch Import Pipeline