
Profile Dock
Profile Dock
The Profile Dock allows you to view a profile line over one or more surfaces in order to get detailed or comparative information along the line. To enter profiling mode, click the 
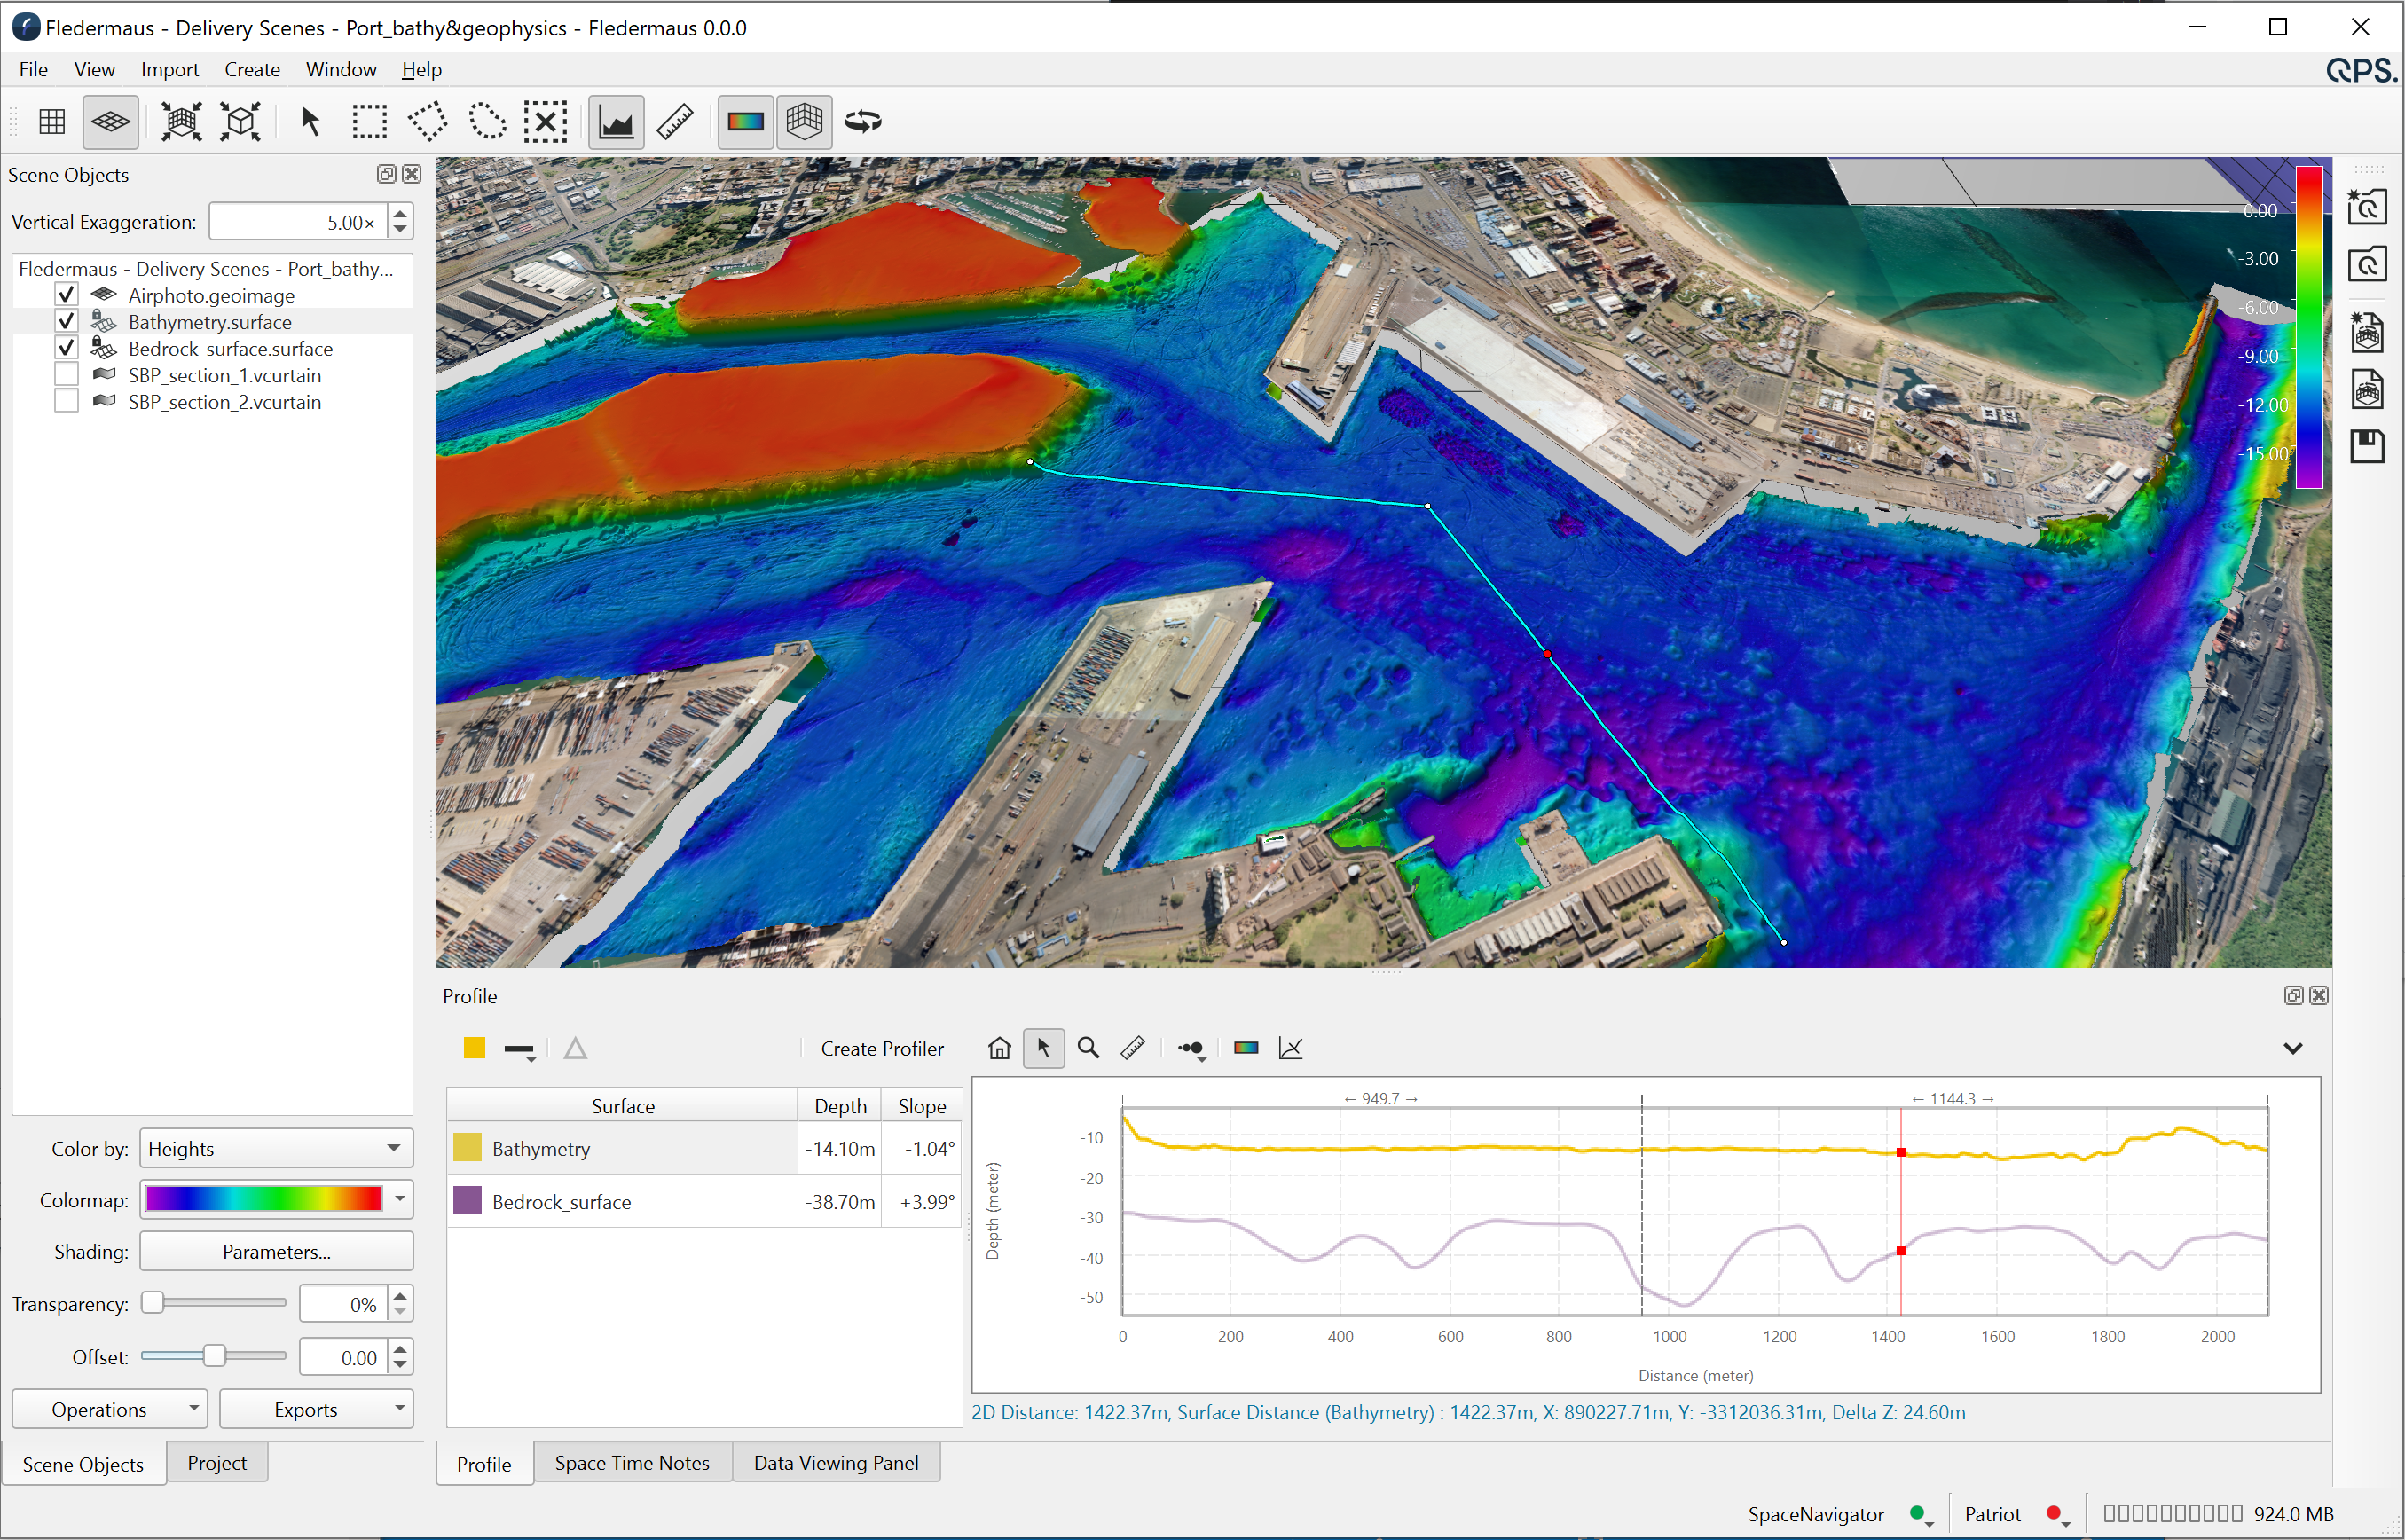
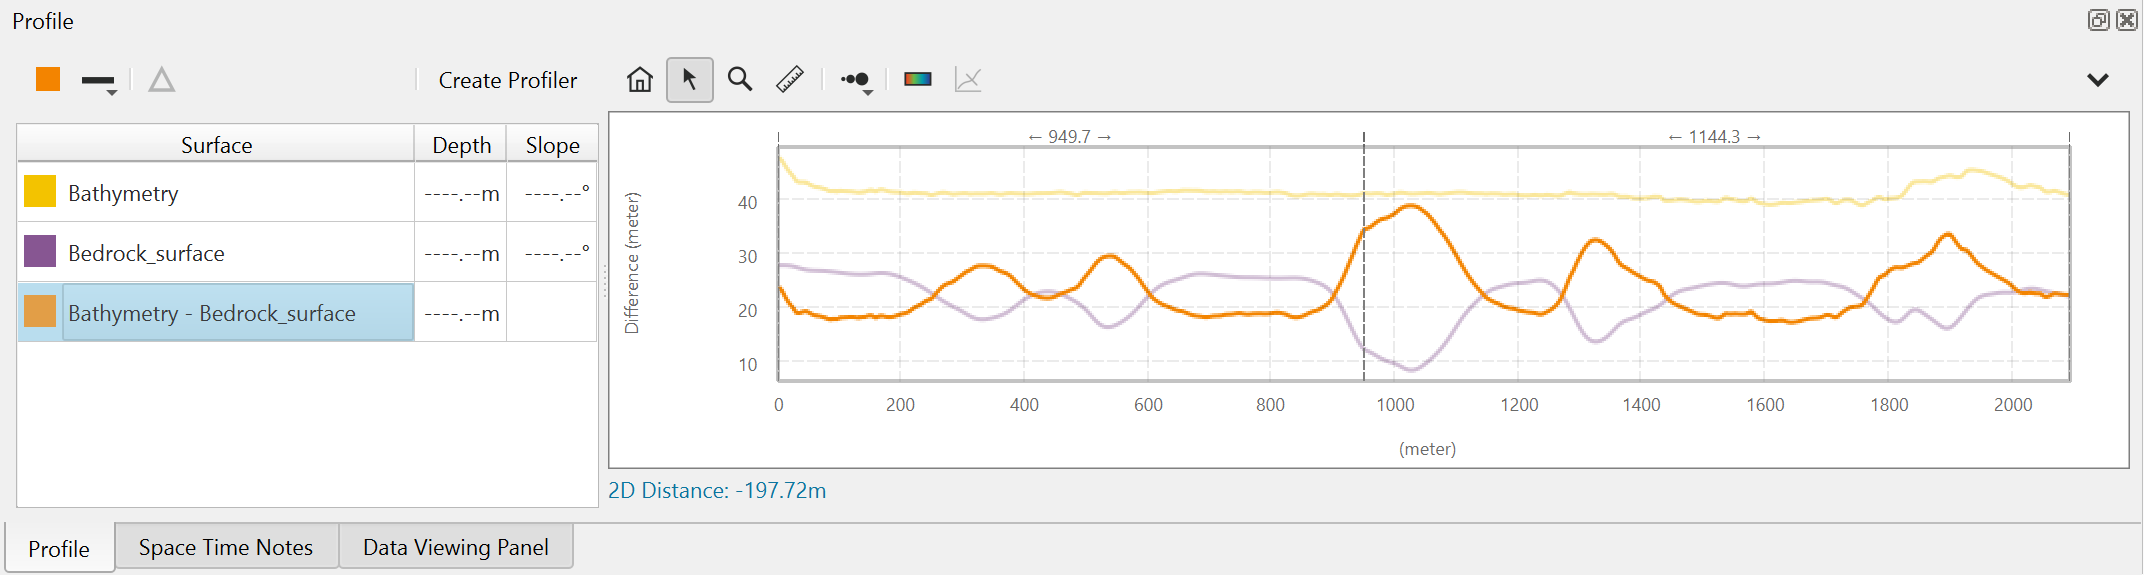
Overview of a profile selection and the profile dock view
In the example above, there are two surfaces, a bathymetry surface and a bed rock layer surface which is below the bathymetry surface. A two segment profile was selected and the results are shown in the profiling dock window.
In the profile dock there is a tool bar across the top, a section along the left side for the list of active profiles, with the main graph of the profiles plotted on the right side. Just below the graph is an information line which shows information from the cursors position in the graph and various details when using some of the tool modes. When the cross profiling mode is activated a secondary profiling graph is shown to the right of the main profile graph. The profile plot surface displays the locations and span distance between each control point in the profile segments using a vertical dashed line in the plot. The vertical axis is the profile z (height) range and the X-axis is the 2D distance along the profile. As one moves the cursor along the profile plot, you will also see the 2D and 3D Surface Distance reported below the plot. The profiles in the dock are a live analysis of the objects in the scene. If you turn on or off the visibility of surfaces then appropriate results will be added or removed from the list of dock profiles in response.
In the Scene 4D main visualization window, the profile draws as a draped line on the topmost surface. White markers are also drawn at each segment endpoint. A single red marker (the pipper) appears along the plot correlating to the location of the cursor in the plot area of the Profile Dock.
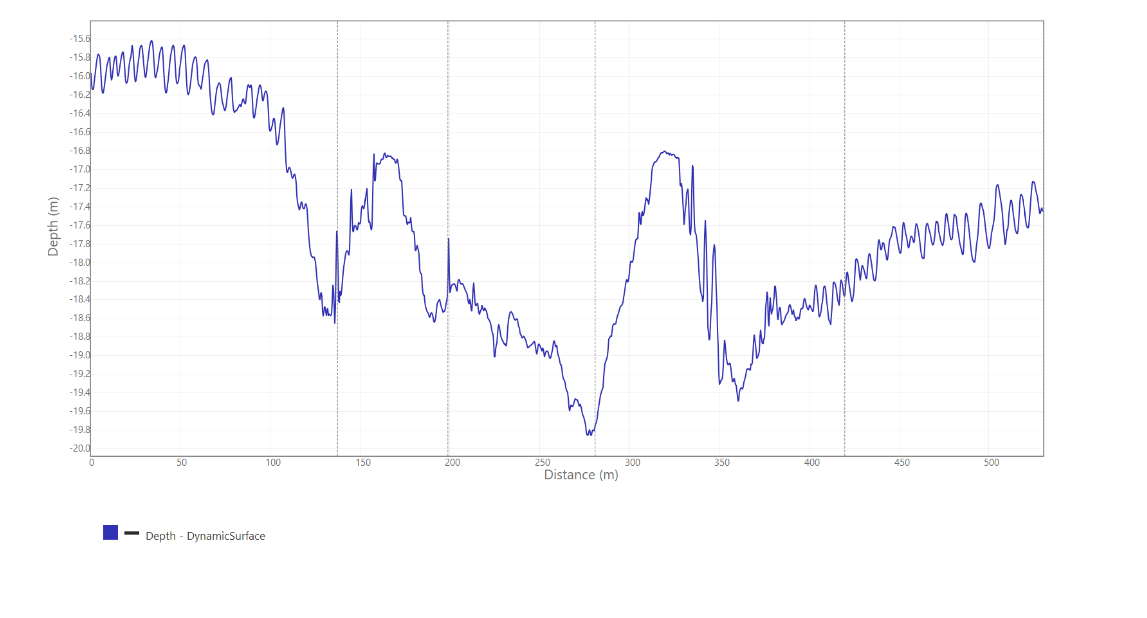
If you have a profile which goes over a Dynamic Pipe object, a cross sectional view of the pipe/cable will be shown in the profile plot as a black dashed circle. Be aware that the circle stretches vertically with the plot exaggeration. If the profile is close to parallel with the Dynamic Pipe, no indicator will be visible.
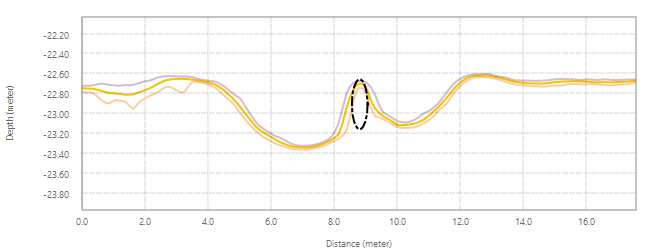
A Dynamic Pipe indicator in the profile plot
The Profile Selection Control
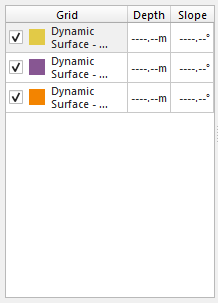
The Profile Selection Control Area
At the left side of the profile dock is the selection control area. For any visible surfaces in the main scene a profile will be created for each layer of the surface, added to this list, and shown in the profile display. The checkbox on the left controls the visibility of that layer in the profile plot, and the profile is drawn in the plot with the color shown. When you have multiple profiles the selected profile will render a little more brightly than the others to help highlight it. When the cursor moves over the profile red dots will appear on the profile at the selected location and the profile depth and instantaneous slope at that point is shown in this control. You can select multiple profiles be holding down the Ctrl key when clicking on a profile name.
Profile Dock Toolbar

Profile Dock Toolbar
The tool bar along the top of the dock control three areas of controls. On the far left are controls that apply to the profile selections. The middle set controls the profile display mode and some viewing states and operations. Finally at the right hand edge is controls for the vertical exaggeration of the profile and cross profile graphs, as well as a drop down menu of additional operations and options to export profile data and imagery.

This button is used change the color of the currently selected profile line in the graph.
 Line Pattern Button
This button will change the line pattern of the currently selected profile. If you click and hold the button, you will see a drop down list of the choices. If you simply click, it will cycle to the next line pattern. The choices are dots, dashed line, dot-dash line, dot-dot-dash line, and solid line as shown below.
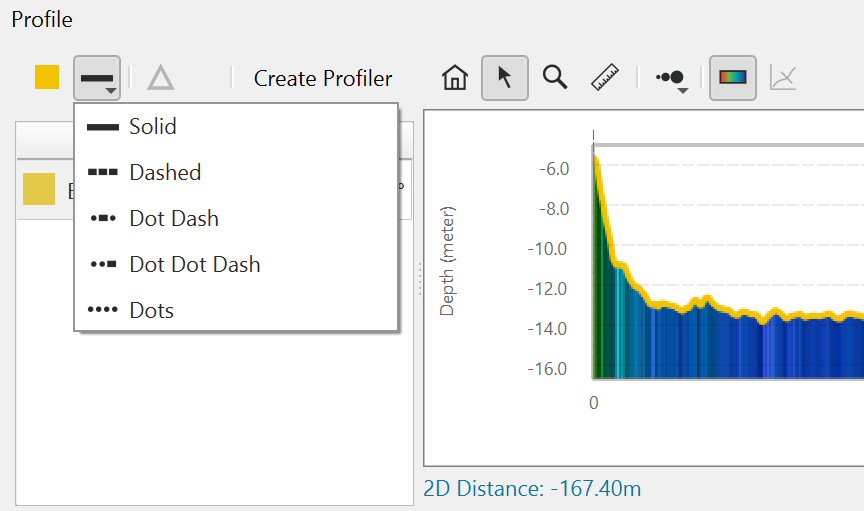
Profile Line Styles
 Delta Button
This button will compute the difference between two selected profiles in the table view. To select a second profile hold the Ctrl Key down while clicking a second profile. Once you select the two profiles, click on this button to generate a difference profile to plot. This will create a new profile representing the difference with the (first profile - second profile) as a result. The name given to the profile tells you how the difference was constructed. In the example below the Bathymetry surface profile was selected first and the bedrock surface second so you are seeing the amount of sediment in the difference between the two layers.
Sample Difference Plot
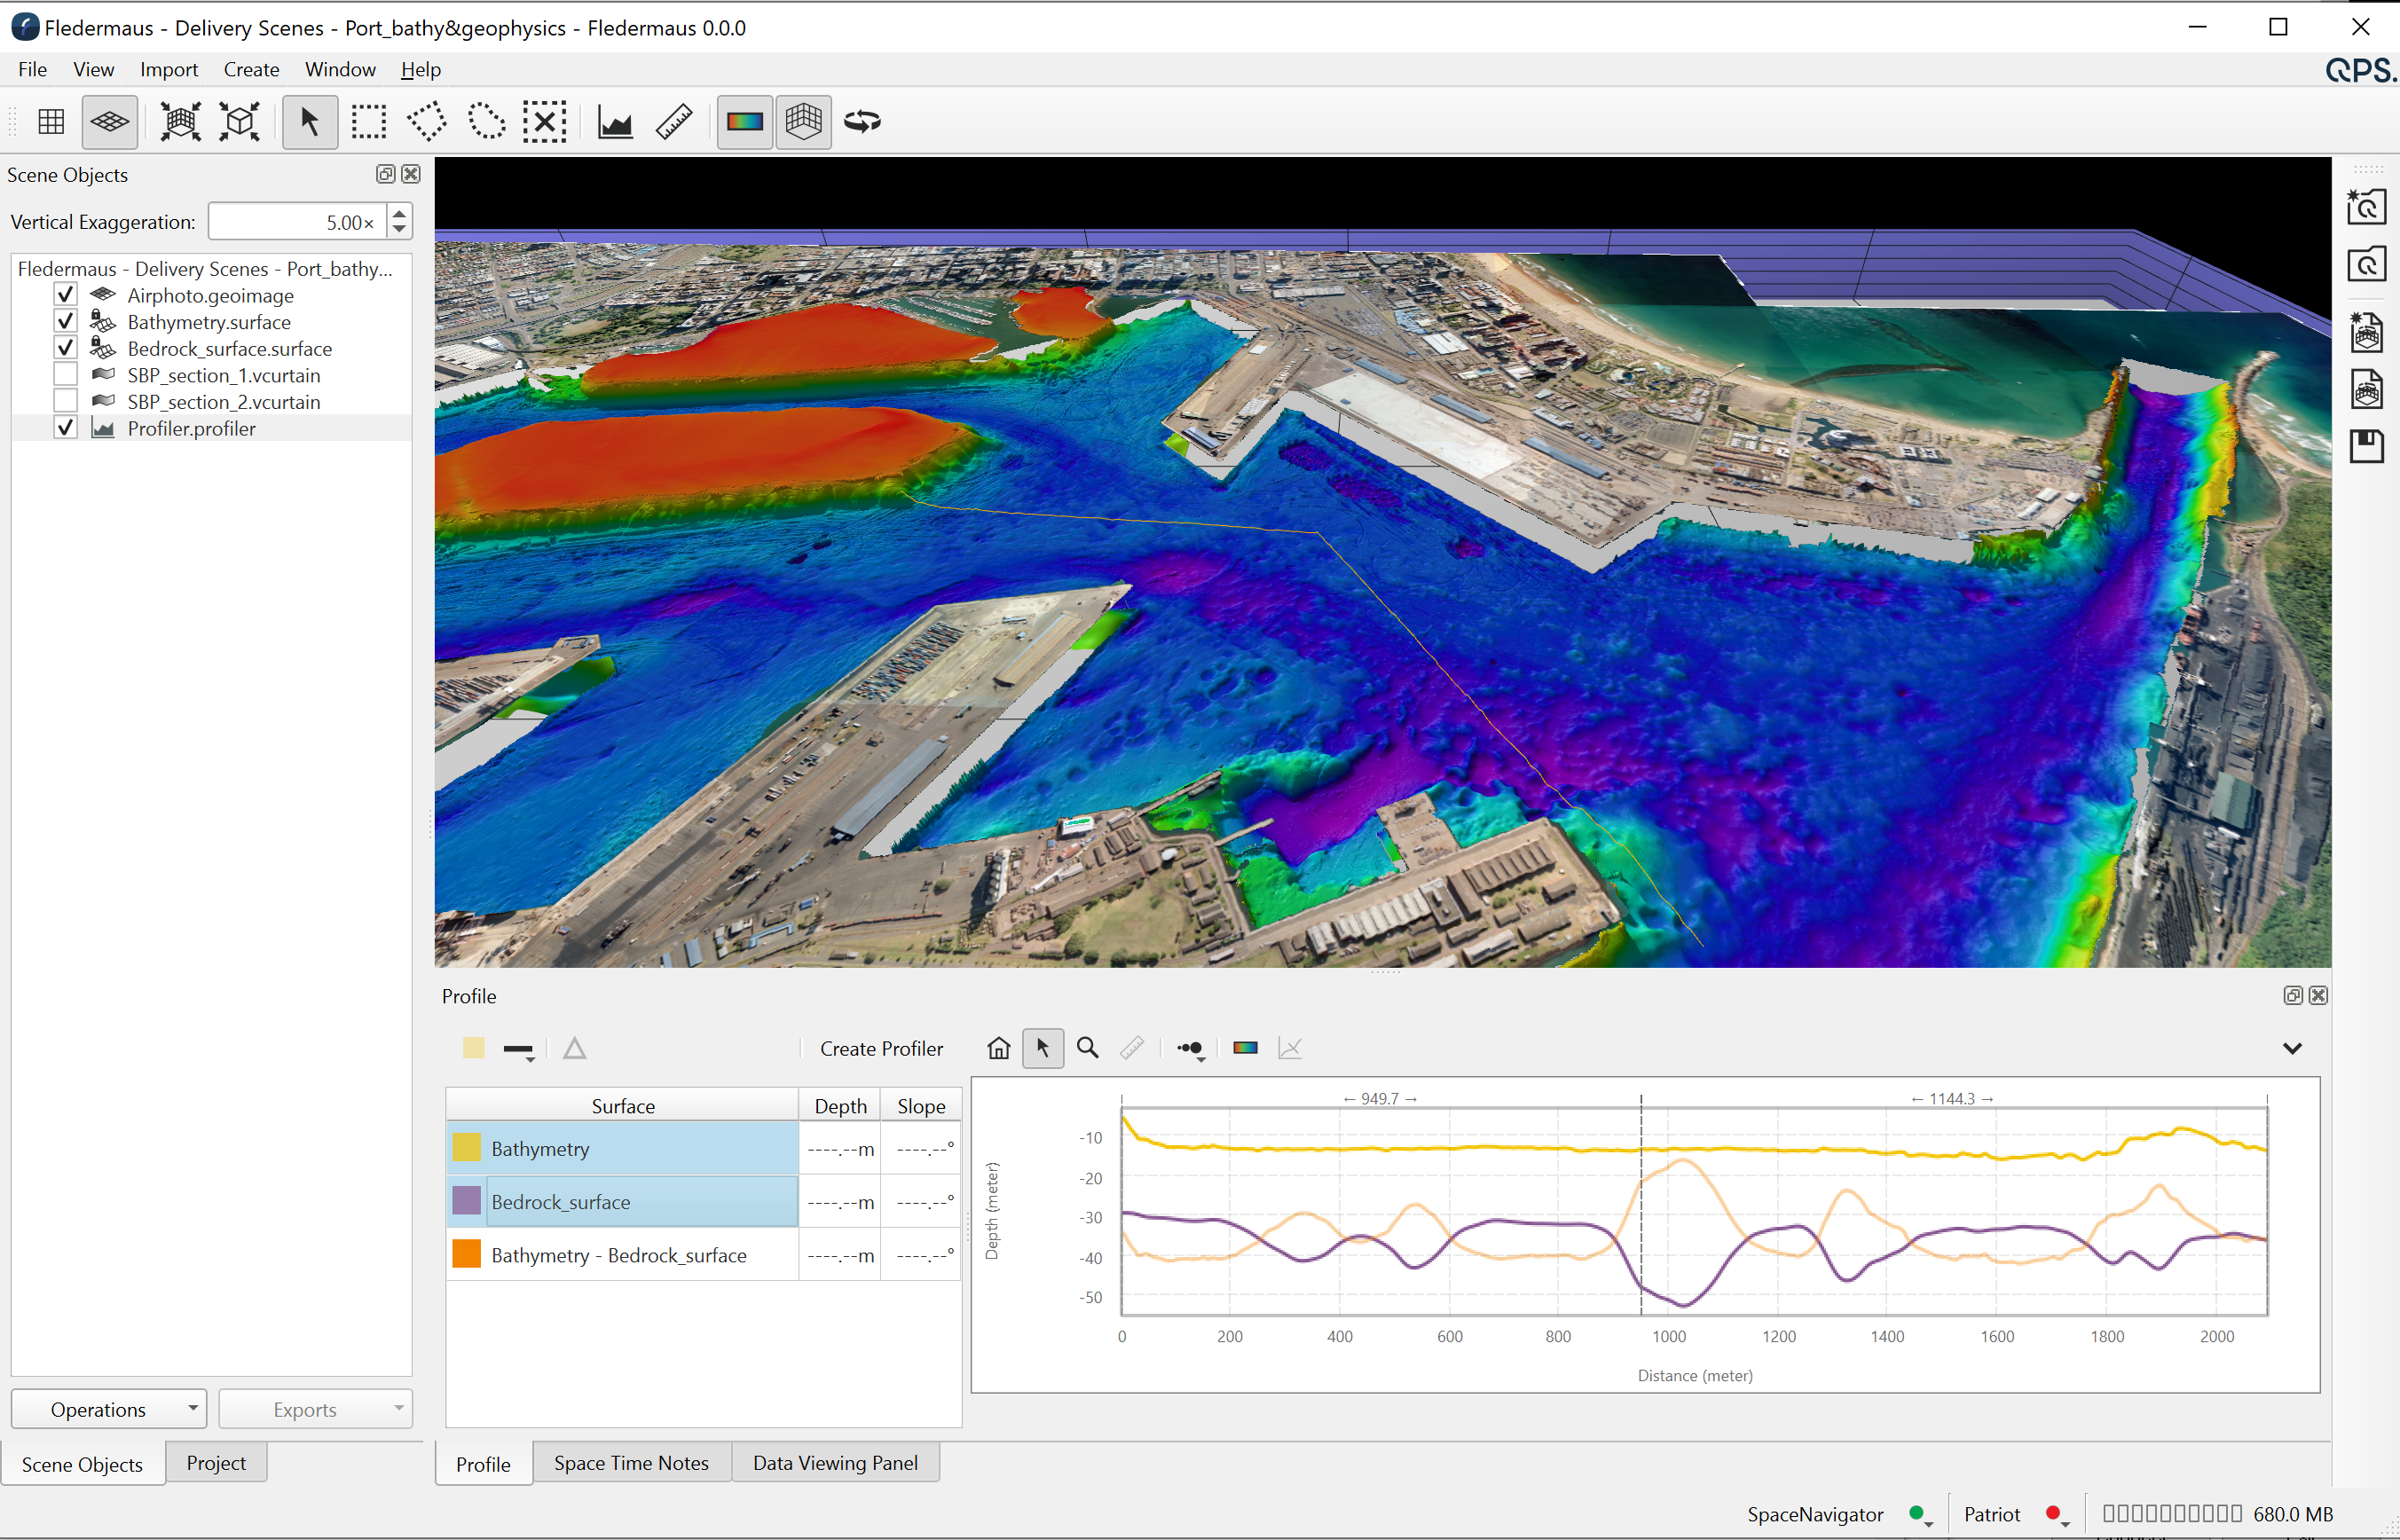
Normally the depth values of the surface difference are significantly different than the profiles it is generated from. To make it easy to visually compare the results the difference profile is plotted on the graph with it own range superimposed on top. When you select the "Difference" entry from the table view, the Y scale will change for the plot showing you the vertical extents of the difference data as shown below.
Difference Plot in Profile Dock
Any difference analysis done is saved as part of a scene. They only last while the profile is loaded into the dock. If you create a new profile or select a different profiler object then any difference plots created will be cleared.
 Create a New Profiler Button
Profile paths that are loaded into the dock for analysis can come from two sources. They can be from a profile path created when using the profiling tool from the main display or they can come from a saved "Profiler" object which is a saved profile path that appears in the scene object list.
When a profile path is created using the profiling tool this button lets you create a profiler object from the current path. When clicked you will be asked for a filename to create the "<userGivenName>.profile" file and it will be added to the current scene's object list. Any number of profiler objects can be created and when selected in the scene list that profile path will be loaded into the profiling dock for analysis. You do not need to be in the "Profiling Mode" for the profilers path to be loaded and shown. In the main 4D display profiles created via the profile tool are shown in a light blue/aqua color whereas profiles from a profiler object are shown as a light orange line. For details on editing of the profile path see the profile tool selection of the manual. Note that if you are viewing a profiler object's profile you can drag the profile and move the control points in the main scene but you can not start a completely new profile path. Unselect the profiler object to create a new one. Profiler objects can also be created from existing 3D line objects by right clicking on the line object and selecting the Create Profiler... operation.
 Zoom Out Button
When in zoom mode, simply click and drag an area of the plot to zoom into. Click the Home button here to return to the full extents of the data. For more information on plotting surface navigation, see the appendix section found here.
 Explore Mode
This is the default mode for the profile dock. When in explore mode, simply left click and drag to translate the plot around. To zoom in/out use the middle scroll wheel. To return the graph to the full extents click the Home button above. A For more information on plotting surface navigation, see the appendix section found here.
 Zoom Mode
When in zoom mode, simply left click and drag an area of the plot to zoom into. Click the Home button to return to the full extents of the data. At any time, you can shift-click to drag the plot to a new location. For more information on plotting surface navigation, see the appendix section found here.
 Measure Mode
This mode will allow you to measure along a profile. First, you must select a profile from the table view. Then left-click and drag in the plot area to measure between 2 points on the profile. As you drag, you will see corresponding red markers indicating the start and end of your measure in the plot and 4D View. The 2D distance and change in depth will be shown in the plot window. Below the plot you can see more specific details about the measurement. These include 2D Distance, Surface Distance, Line-of-Sight Distance, Line-of-Sight slope, and the change in X/Lon, Y/Lat, and Z/Depth.
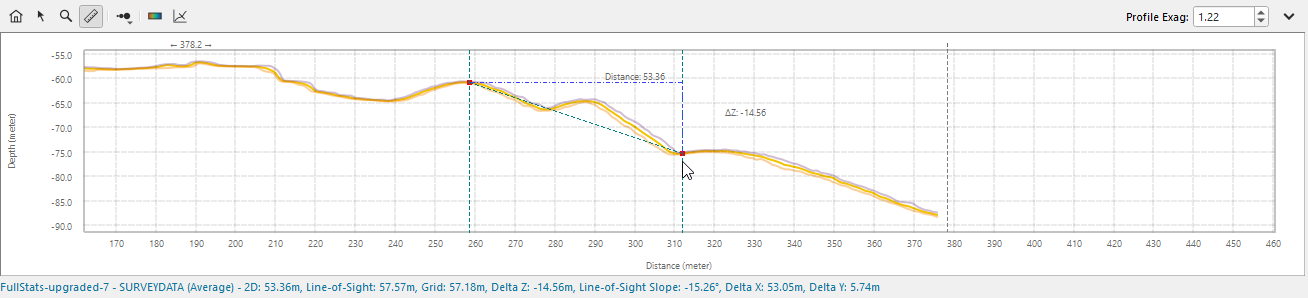
Measure Mode in Profile Dock
 Point Size
This button will allow you to change the size of the plotted points and lines. Sizes range from Small to XX-Large. Clicking on the button will cycle to the next size. Click and hold to get a dropdown menu of sizes to choose as shown below.
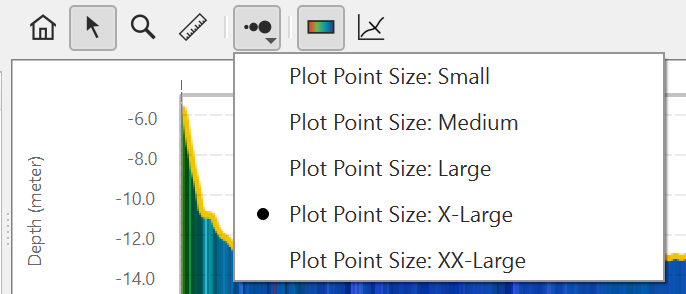
Profile Point Size Selection
 Show Profile Colors
When turned on, this mode fills in the space below the selected profile with the color from the surface that the profile is crossing. It can be helpful in corelating the profile points with their location in the scene. This mode works well with single profiles although with multiple profiles it can make other profile lines hard to see.
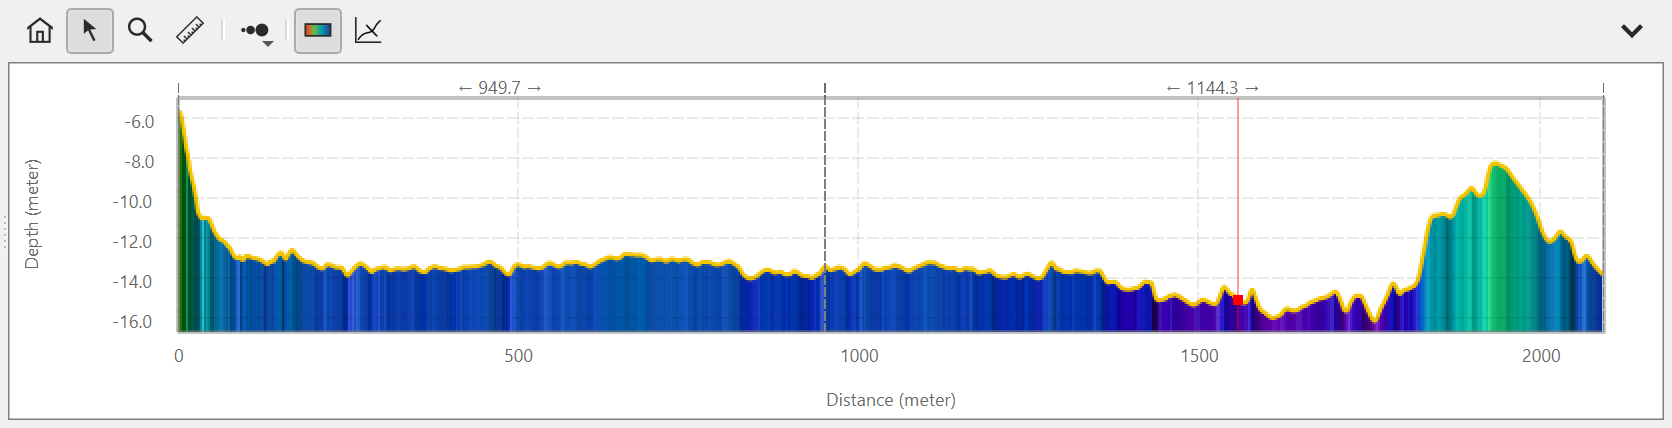
A Profile when the show profile colors tool bar is toggled on.
 Show Cross Profiler
The profiling dock has a built in cross profile analysis tool which is activated by pressing this button. In order to activate cross profiling mode you must be in the profiling tool mode for the 4D display. If you want to analyze an existing profiler object simply select it then enter profiling mode before clicking the cross profile analysis button.
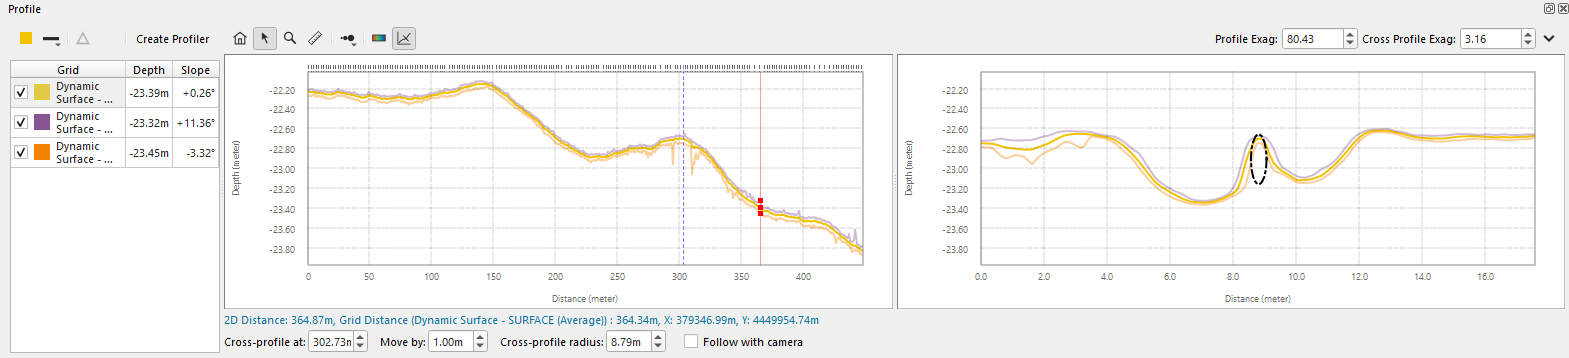
Clicking this button opens the cross profile graph which is designed to show a perpendicular profile from a selected point on the active main profile line. It will show a secondary profile graph to the right of the main profiling graph. This graph shows cross profiles for any profiles in the main display. Initially the cross profile will be positioned at the start of the main profile line. Several additional input controls are shown below the graphs to show and set the current cross profiling KP point (distance from the start of the profile), a move by amount and and the radius length of the cross profile. You can enter values to setup the cross profile as desired.
The cross profile will also be shown in the main 4D window with control points at the ends of the cross profile and one where it intersects the main line. One can click and drag on these control points as well to visually position and size the cross profile.
One can also set the KP of the cross profile by left clicking in the main profile window which will move the cross profile to that location. The cross profile location is shown in the main profile graph with a dashed vertical blue line. If you are using the generate cross profiles functionality of a profiler object, left clicking the main profile window will instead select the nearest generated cross profile to the position clicked. For more information on the generate cross profiles functionality, see the attributes section of the Profiler object page.
Finally as you move the cursor over either graph, the position of the cursor is shown by a red point in both the graph and the main 4D scene.
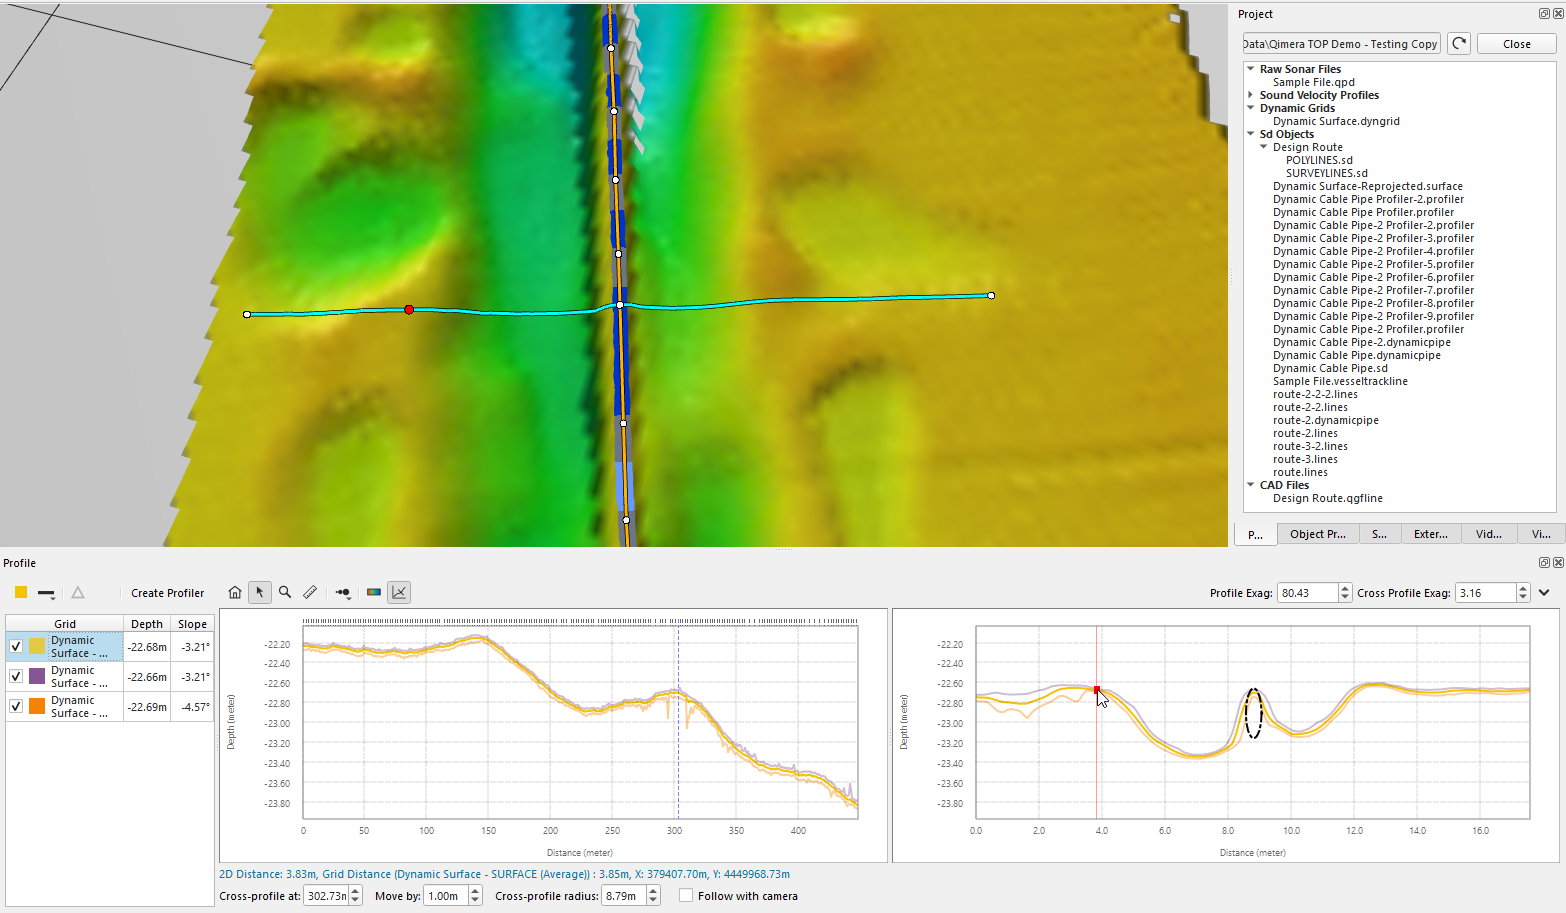
Cross profiling activated for the selected profile
The "Cross-profile at" field allows you to adjust the position of the cross profile, while the "Move by" field determines how far the profile will move with each click of the up and down arrow buttons. The "Cross-profile radius" field controls the length of the cross profile line. Finally, the "Follow with camera" checkbox will make the camera re-center on the middle of the cross profile whenever its position is modified via the "Cross-profile at" field.
 Profile and Cross Profile Vertical Exaggeration
These spin boxes on the right hand side of the toolbar control the vertical exaggeration scale for the profile and cross profile graphs. The scale factors for the profile and cross profile are independent, so each graph can be adjusted individually. Using the Zoom Tool or clicking the Zoom Out Button will automatically adjust the vertical exaggeration scale to fit the selected area or default view accordingly.
Vertical exaggeration scale cannot be adjusted while Lock Depth Scale is turned on.
 Profile Menu
The profile menu at the far top right of the profile dock includes the following options:
Show Statistics
Turning the show statistics option adds a set of profile stats at the right edge of the profile. This include the min and max point, the average, and +- 1 standard deviation as shown below.
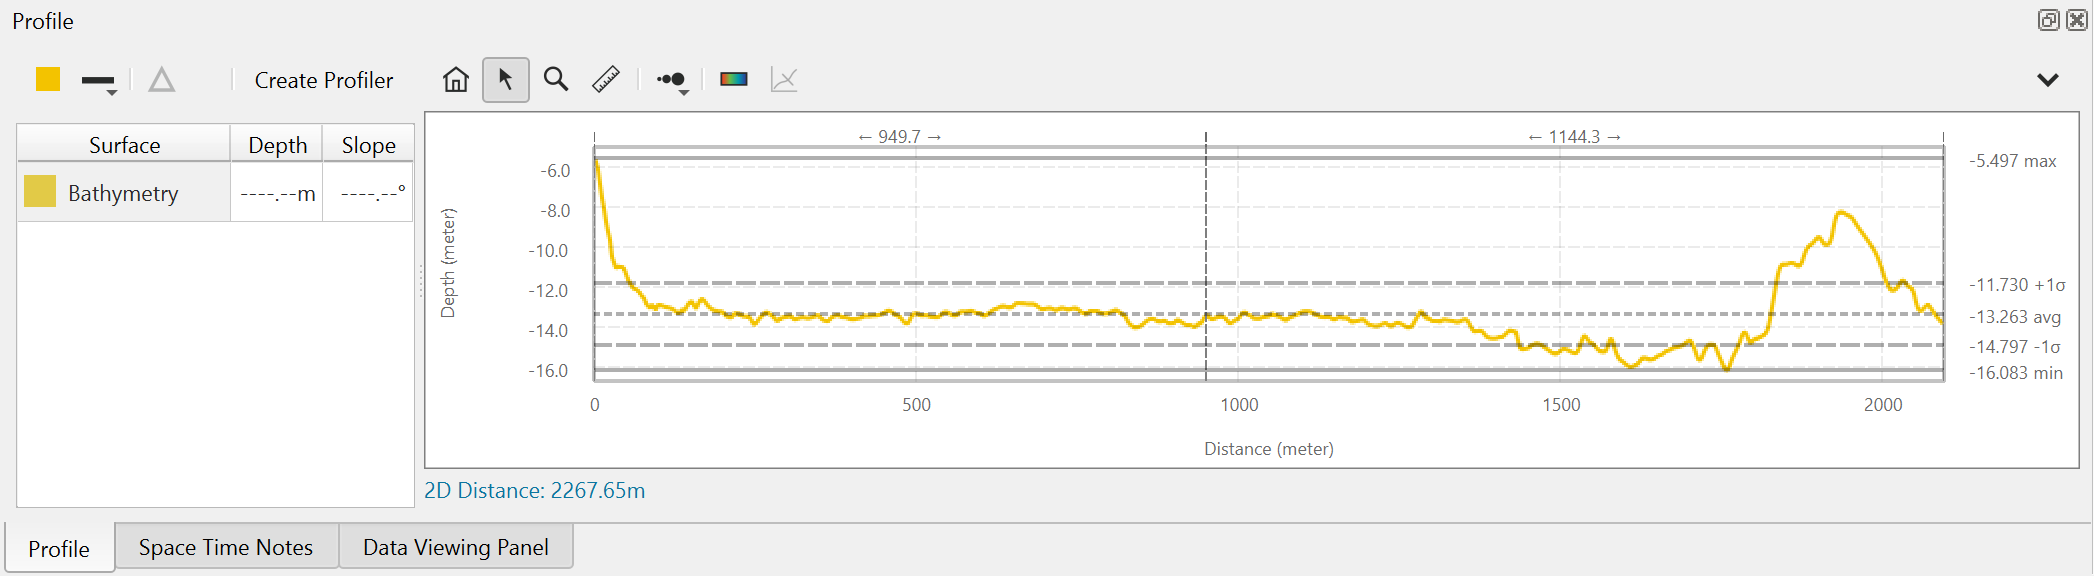
In addition to the values horizontal line on displayed on the graph to help visualize the location of the statistics.
Export to ASCII...
Selecting this option will bring up a dialog box to control the export options which looks like:
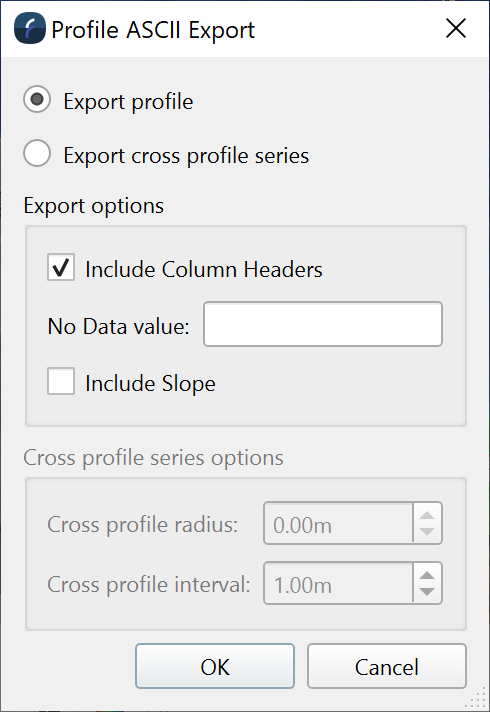
This includes options for exporting both a main profile and a whole series of cross profiles built from the main line as well. If the profile has no data gaps one can specify what value to export in its place and one can optionally include the instantaneous slope at each point along the profile. If the "Export cross profile series" option is selected a series of profile file will be exported based on the cross profile radius and stepping internal one selects. The file name given after one clicks Ok will form the base name and profile will be named with the basename_<distance_along>.txt. The exported ASCII file(s) will contain Sample Point, 2D Distance, Easting, Northing, and Depth and Surface Distance for each surface in the Profile Dock. A sample export is shown below.
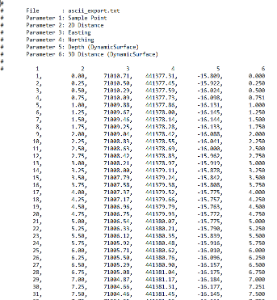
Ascii Export from Profile
Save Plot To Image
This will save the current Profile Plot to an image file. The file type by default is PNG. The first image below is the configuration of the Plot before export. The next image is the exported image. Notice that Fledermaus includes the color and line pattern legend as part of the result.
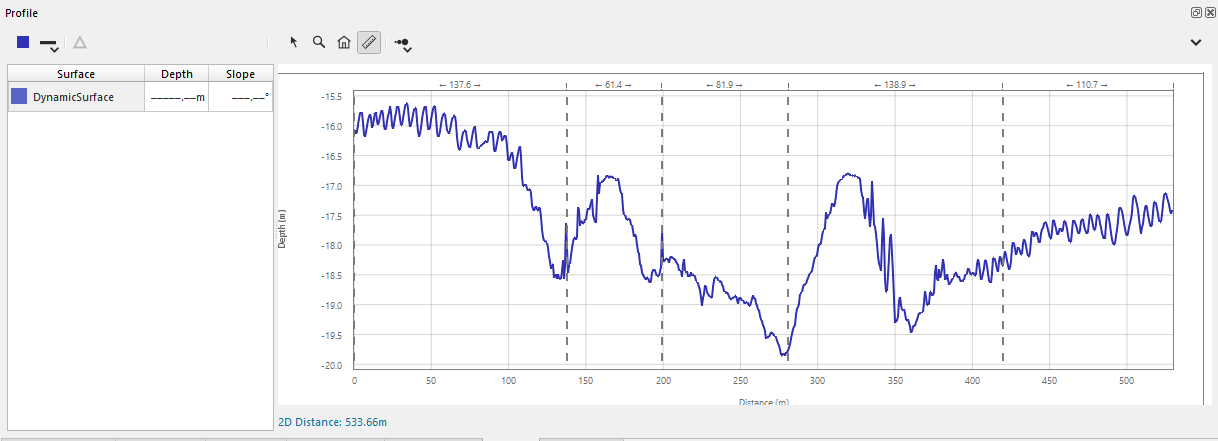
Profile Plot to Export
Exported Profile Plot
Save Cross Profile Plot To Image
If you have a cross profile open this option will be available and is identical to the above one expect the cross profile image will be saved.
Show Gridlines
This option will show/hide the grid lines in the plot area.
Disable Vertical Exaggeration
This option disables the vertical exaggeration controls and locks the vertical exaggeration to 1.0x.
Lock Scale Depth
This will lock the current Y plot range (Depth) so that when you create a new profile over flatter terrain, it doesn't overly exaggerate small details. This allows you to more easily see areas of high depth range. If the new profile contains depths above or below your currently "locked" range, the range will be extended to encompass these new depths so that you don't have to zoom out to see them. Vertical exaggeration cannot be changed while this is active.
Clear Differences
This will clear the current difference plots from the Surface Table. If you create a new profile, difference plots will be automatically cleared.
Show/Hide All Profile Plots
Changes the visibility of all plots at once.
Reference Profiles
If you have a 3D line object loaded in the scene, one can right click to access the objects operations and choose to create a reference profile. This is normally done to compare an existing line consisting of many x, y, z points to the surface profiles from surfaces that follow the same path. The reference lines takes its full x, y, z points from the line and adds a reference profile to the graph. Then the line's x,y path is used to sample any surfaces to create profiles based on the given sampling locations from the reference line. One can then use the profile dock to compare results and/or use the difference tool for further analysis. If a new profile is created or a profiler object is selected then any existing reference line set in the profile dock will be cleared.