
Voting System Items Implemented
https://qpssoftware.atlassian.net/issues/?jql=project+%3D+FQI+AND+issuetype+%3D+%22New+Feature%22+AND+fixVersion+%3D+%22Qinsy+9.5.0%22+ORDER+BY+summary+ASC%2C+votes+DESC+++++
Console
Geodetic UI - Test and Batch conversion of coordinates
We have added the first phase of our Batch Coordinate Conversion Tool to this release to allow users to convert coordinates within the Geodetic Configuration of their project:
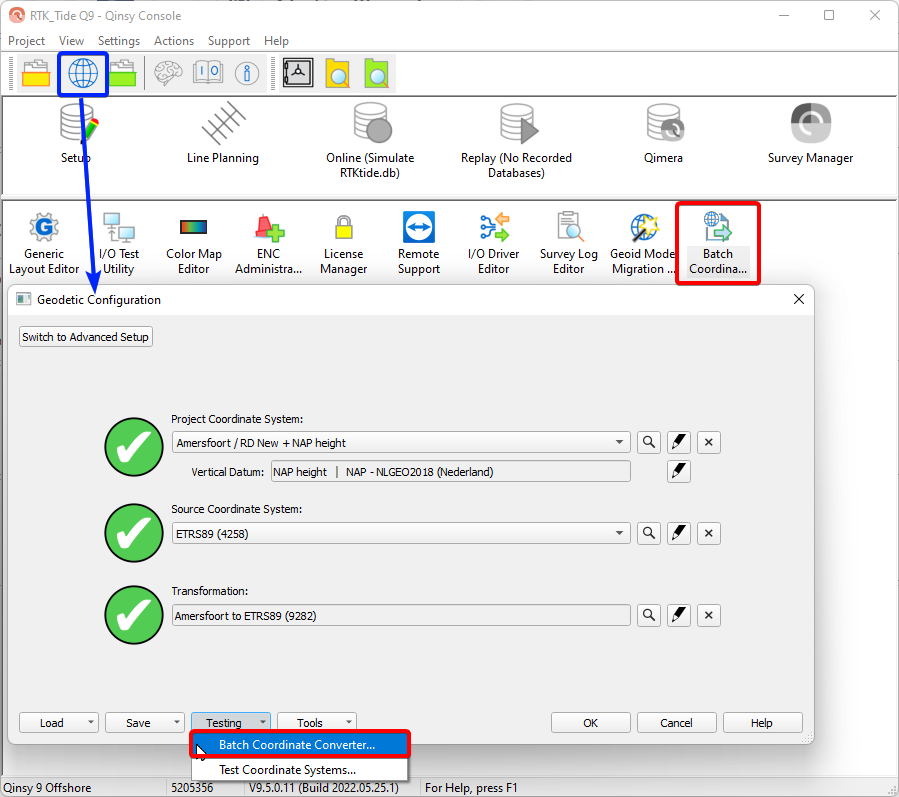
It can be found under “Testing” in the Geodetic Configuration or it can be started directly from the Console:
Drivers
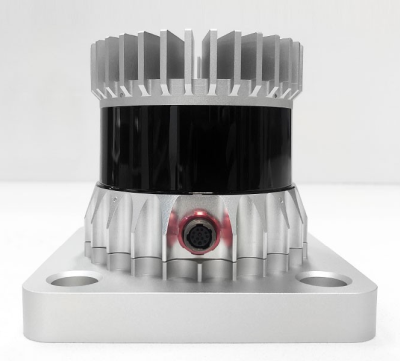
ADCP and DVL - Nortek DVL500

.png?cb=979f040a28900ccce3590230afc27f74)
The driver (was released on January 25th, 2022 with Qinsy 9.4.4.) supports the following formats:
-
DF3
-
DF21
-
DF22
The benefit of this system is that both the DVL and ADCP are supported at the same time and can be used and visualized Online.
For more information on what is decoded and how to set it up with Qinsy, please have a look at the Drivers manual: Nortek DVL 500
-
Interface types:
-
Serial
-
Network TCP
-
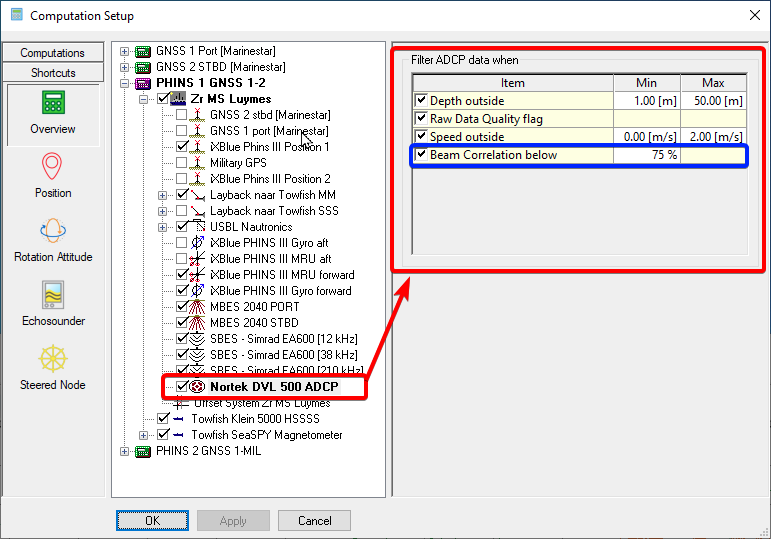
For Qinsy 9.5.0 we added a UDP version (for less time accurate applications) and we added additional filtering options to improve the results:
The ADCP results can now be shown in the Time Plot Display:
. 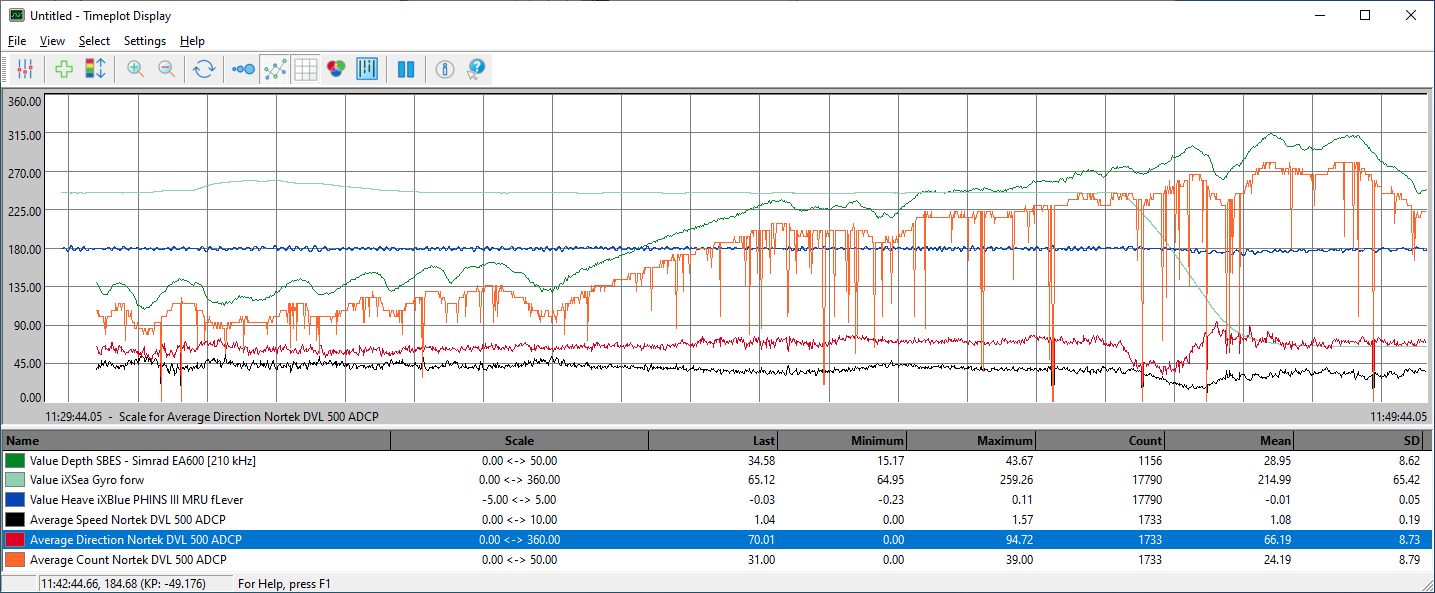
The Time Plot Display above shows:
-
Filtered cell count (orange)
-
SBES depth (dark green)
-
ADCP current direction (red)
-
ADCP current speed (black)
The ADCP Display is updated to support the Correlation flag .
Laser - Ouster OSx series
The Ouster laser was added to our wide range of supported laser systems.
The driver does not just decode the data steam, but also allows you to:
-
Set the Lidar Mode dynamically
-
Start/Stop scanning
-
Update session setup filename specifier
-
See log messages in event pane
-
Apply Vertical Area Masks
-
Apply Horizontal Area Masks
-
Select the sensor mounting orientation (mounting angle scenarios) to simplify calibration procedures
-
Use accurate timestamp from the message (GPRMC/Pulse).
For more detail please read our Ouster OSx drivers manual
USBL - Forssea VLOC


For further details please refer to the Forssea VLOC Drivers Manual
USBL - Kongsberg HiPAP - NMEA $PSIMSSB - Pitch Roll, Heading or Depth
We updated the Kongsberg /Simrad HiPAP driver to allow the user to set up the driver to decode additional observations that can be reported by a beacon:
-
Heading
-
Pitch / Roll
-
Depth
Check your USBL beacons for supported observations by that beacon.
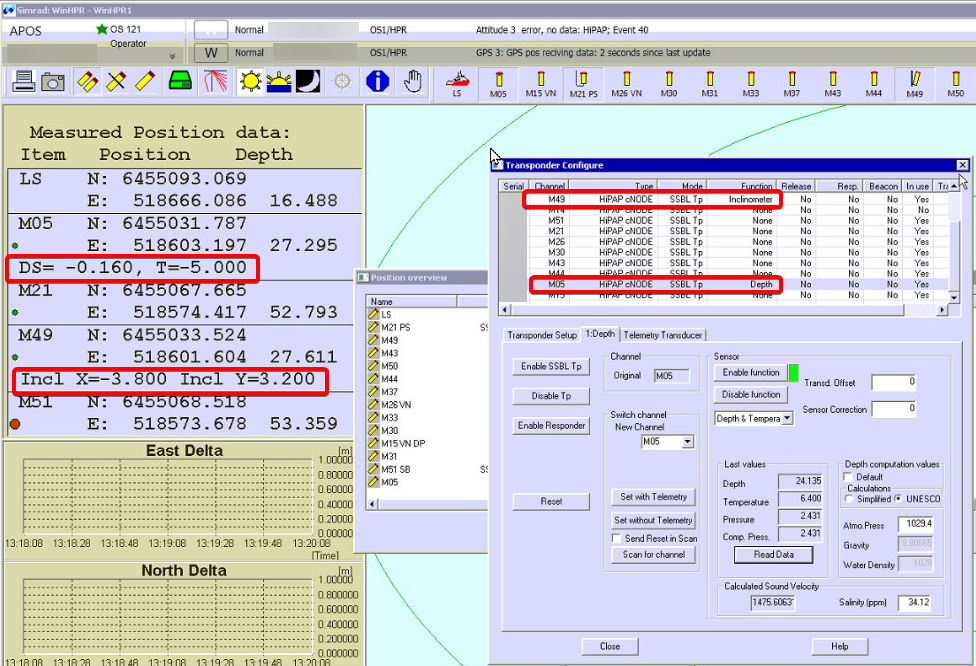
This will allow the user to make better use of the new (shallow) depth sensors in the upgraded cNode beacons.
For more details, please refer to the Simrad HiPAP (NMEA PSIMSSB Format) (UTC) drivers Manual
Online
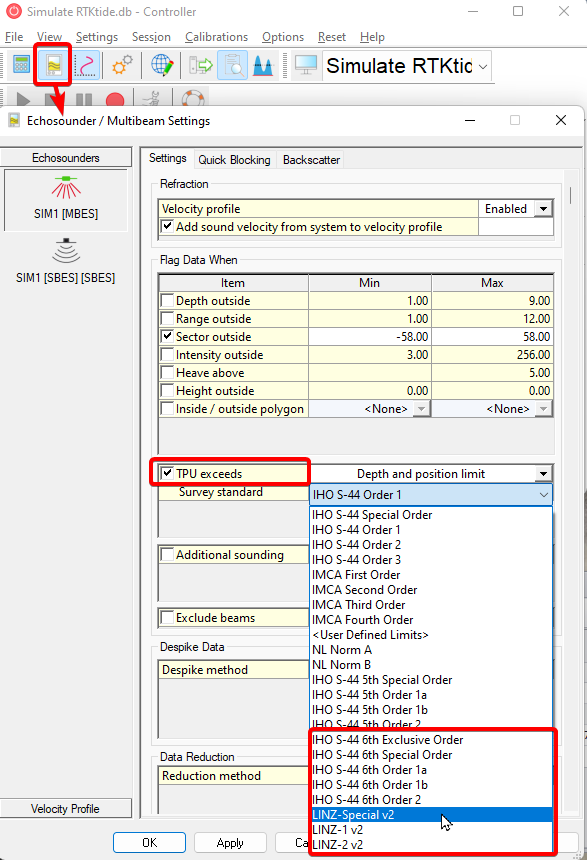
Echosounder Setting - TPU - IHO S-44 6th edition and LINZ v2.0
In both Qinsy and Qimera we added support for two new filters:
-
-
International Hydrographic Organisation - HO S-44 Edition 6.0.0
-
Land Information New Zeeland - LINZ v2.0 (PDF) to support HYSPEC V2.0
-
Displays
Navigation - Draw Area for recording
You can now easily draw an area in the Navigation Display and use this to automatically start and stop the recording:
When you Pause or Stop the Recording (manually or via abort mission) the auto recording will be disabled when you are inside one if the defined recording areas.
Navigation - Pre Plot Shapes - Planning of Multiple Objects and Locations
In the Navigation Display we have the option to Pre Plot a (Ghost) Shape of an Object (Vessel/ROV, etc.). This is normally used during positioning of an object (Rig, Pipe Lay Barge, etc.).
In this release these options have been extended with the following options:
-
Defining Multiple Pre Plot (Ghost) Shapes
-
Positioning, rotate (scroll button) and scale (Ctrl+Scroll Button) by Mouse
-
Manual Position Input
-
E/N
-
Lat Long
-
KP/Offset (See next item)
-
-
Manual Position Input
-
KP/Offset
-
-
Range Marker
-
Copy KP/Offset to Pre Plot Shape to guide to next location
-
-
Import Locations From Session - Line Planning
-
Import From Line Planning file (*.QGFline)
-
Planned in the Survey Manager
-
-
Export to (*.QGFline) file
Survey Manager
ERSI Shape (*.shp) Import and Export
We added the option to Export and improved the option to Import ESRI shape files.
To start with the Export, we made it possible to export to ESRI Shape files. As an example we show the export of Survey files:
The shape file will be exported in the Project Coordinate Reference System (CRS) and contains the labels of the survey lines. We showed this example with QGIS as it will allow all users to test and review exports with their local resources.
For the Import we not only added the import of a shape file in the Geodetic Configuration of the project, but we will warn the user if it's in a different Coordinate Reference System (CRS) and will re-project it for you when possible:
Contours and Soundings - New Contouring Engine
We replaced our previous 32 bits engine with a brand new 64 bits contouring engine.
Contours and Soundings - Contour layout file
The Graphical User Interface for Contours and Spot Soundings has been updated:
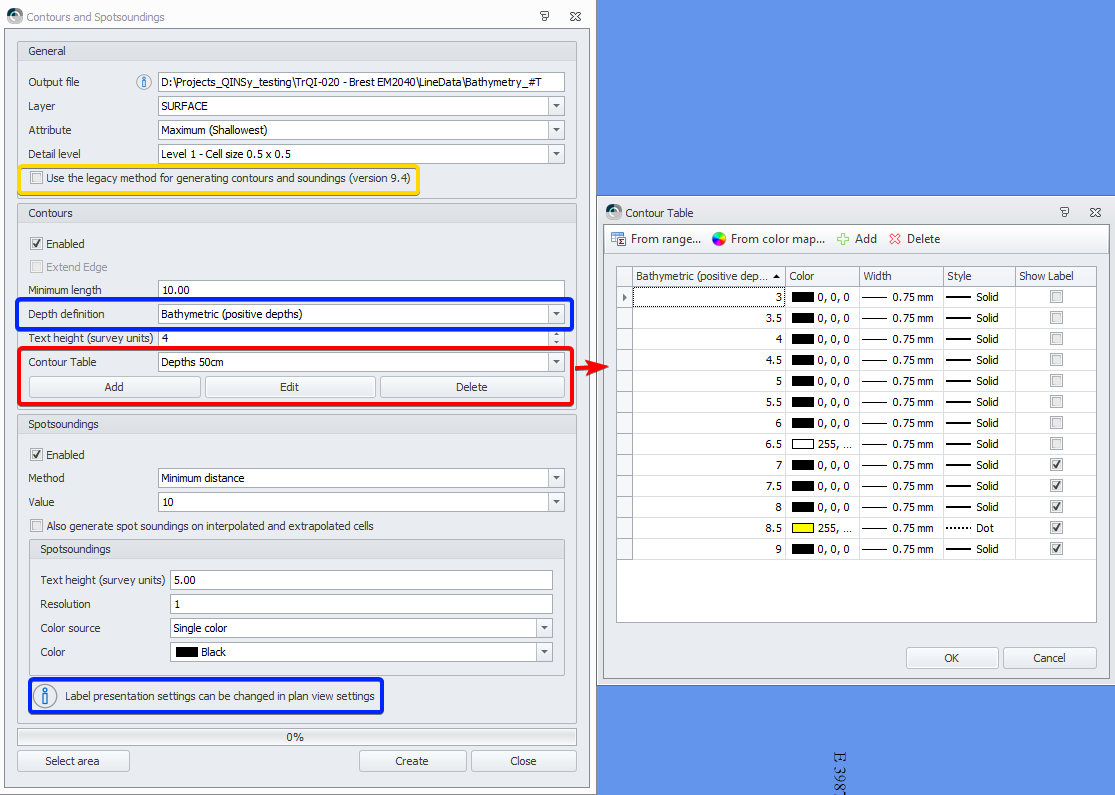
-
We merged the different pages into a single page user interface to give the you a better overview.
-
You can still choose to use the old engine if you want to proceed your project with the same contouring method
-
There is now the option to choose between Depth and Heights. Only the labels are modified.
-
We added the option to define the setting of your contours in a contour table.
Note: Contours and Spot Soundings are vertically always positioned on the related Height to prevent issues when exporting and displaying contours in 3D.
Planning of Multiple Objects and Locations
As in the Navigation Display you can now add pre plot shapes in the Survey Manager