
Editing & Exporting Events Stored in *.DB Files
On this page:
Starting the Event Editor
The Event Editor is a tool to edit events which were previously recorded in a Qinsy online session.
-
This executable is started from the Raw Data Manager (Replay).
-
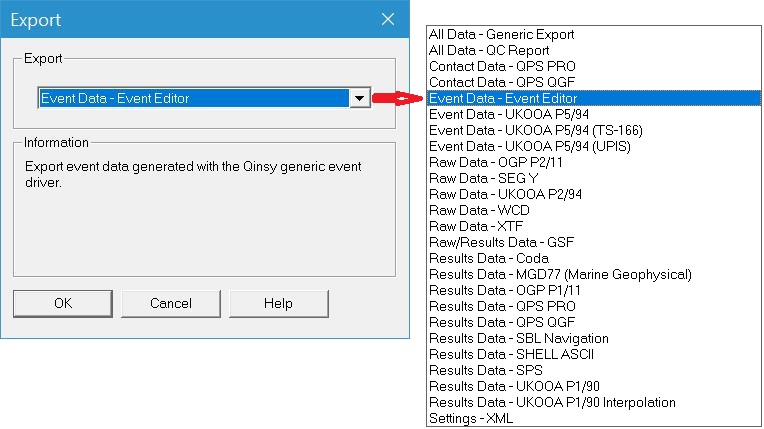
Select one or multiple databases and select Export from the Action menu.
-
Select Event Data - Event Editor as export.
Warning
In order to correctly edit events these files must be available in the Project data folders:
-
\Database - Raw database files (*.db)
-
\Results - Res Files (*.res)
-
\Linedata - Line Database with theoretical lines (*.qgfline), especially when using routes.
-
XML file (driver) that was used online (This is a MUST!!!). As noted above, this file is stored in the Qinsy Public Files Folder, accessed through the Console - Tools Menu. Typically the folder is C:\Users\Public\Documents\QPS\Qinsy\Eventing.
One or more functions in the Event Editor may be absent/not working if *.res or *.qgfline file(s) are not available.
-
Press OK to start the Event Editor.
The default view is the data view:
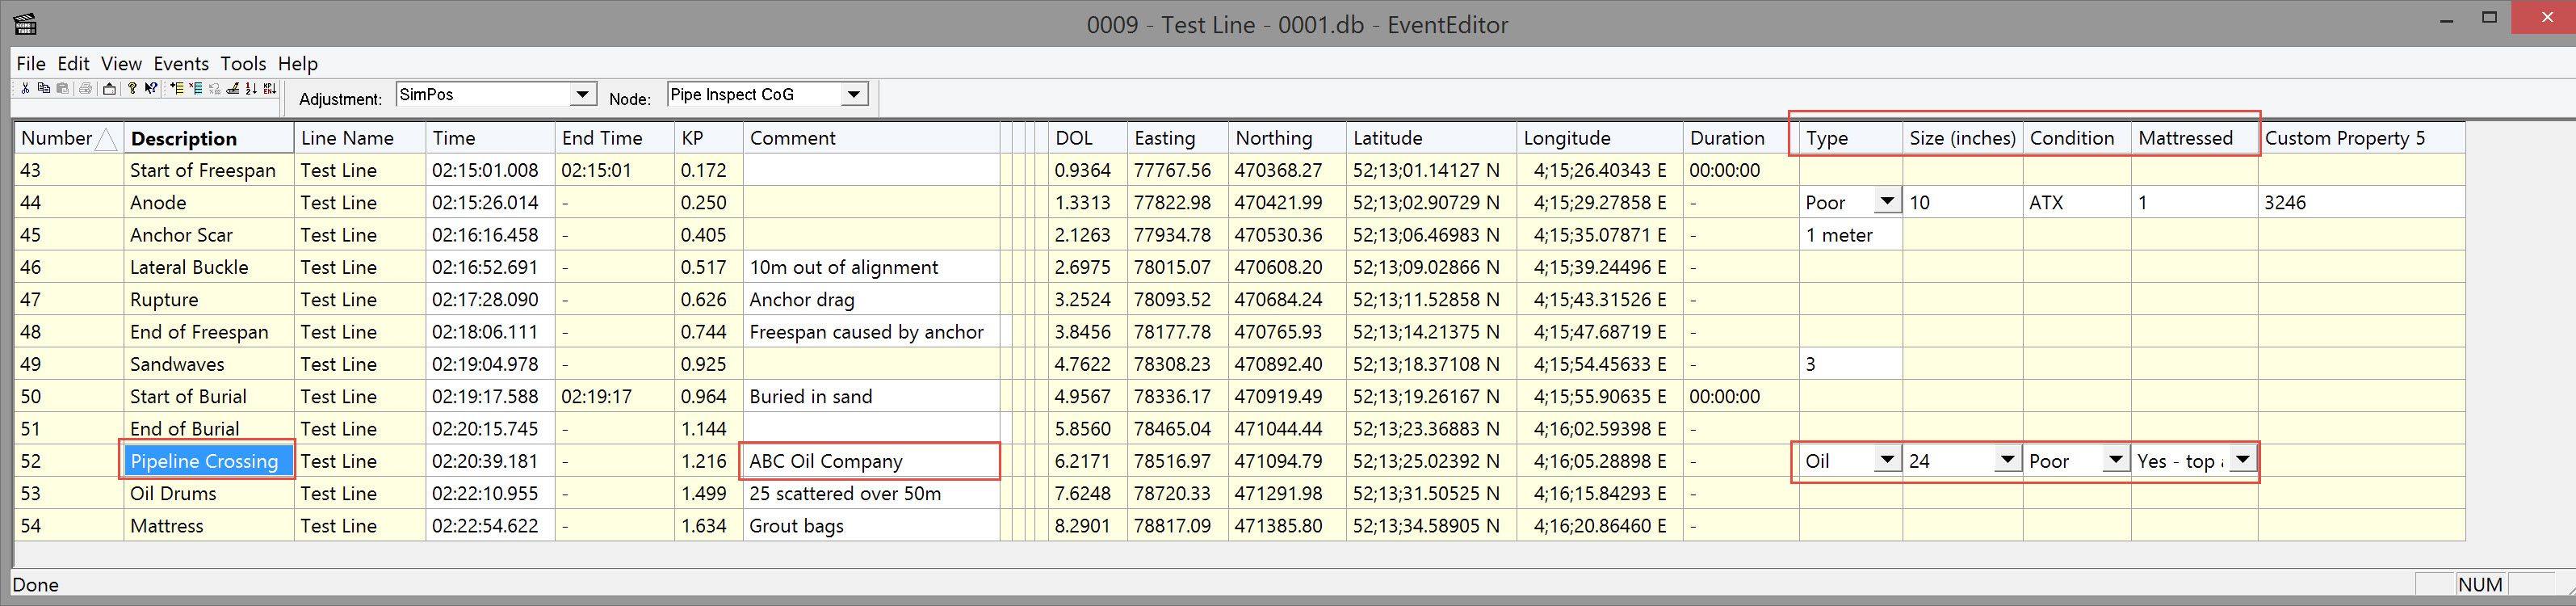
Fields with a white background can be edited.
Duration values are only available for start events which have a linked end event.
See for more information about the Event Editor its inline help.
|
Event Editor |
|
|---|---|
|
File |
Print and Save options for the report. Options are only active when the report is displayed, see View Menu-Show Report at the bottom of this page. |
|
Edit |
Cut, Copy and Paste options for editable (white) data fields of the events. Options are only active when an event is highlighted. |
|
View |
By using the Show Report you can switch to the so-called Report View.
Also switch on or off the columns to be shown. |
|
Events |
Add or delete events and renumber or recalculate events. |
|
Tools |
Export the events or set the general options and special option for reports. |
|
Help |
View the Help file for the Event Editor or check which version of the Event Editor you are using. |
Editor - View Menu
|
View |
|
|---|---|
|
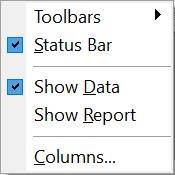
Toolbars |
Enable/Disable the display of one or more of the available toolbars. (See paragraph below.)
|
|
Status Bar |
Switches the status bar at the bottom of the display ON or OFF.
|
|
Show Data |
Show the events as they are stored in the database file. |
|
Show Report |
Show the events as they will be shown in the report. Note: When you adjust the settings under Tools, they will not be shown in the view on-screen but they will be printed. |
|
Columns |
Set how to show the columns of information in the report. (See paragraph below.) |
|
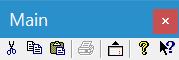
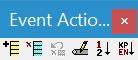
Toolbars |
|
|---|---|
|
|
The Standard Buttons for editing, printing and exporting the data can be found here.
|
|
|
The Event Edit Buttons are used to edit the events in the 'Show Data' view.
|
|
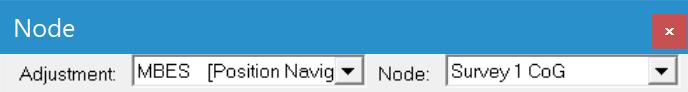
|
An Adjustment to the data can be done by selecting a different positioning system from the drop down list on the left.
|
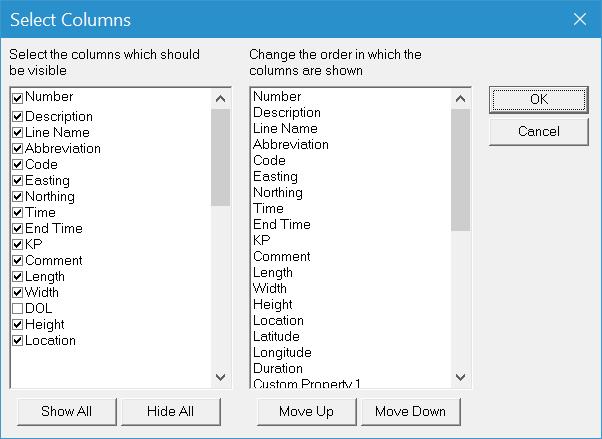
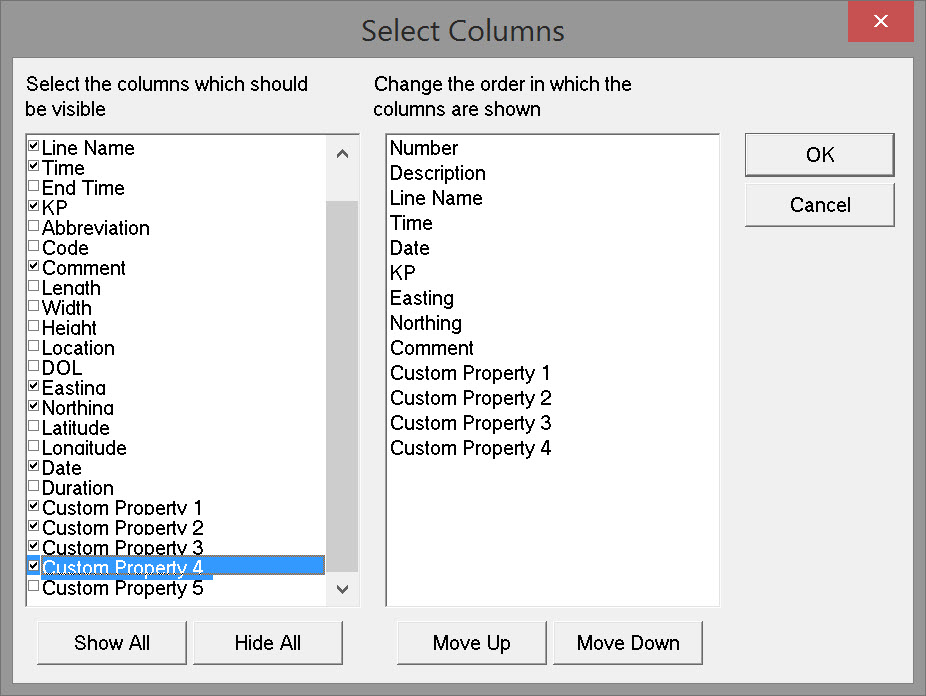
Columns
Select which columns to show by ticking them in the left pane.
When ticked in the left pane the column names will appear in the right pane where they can be re-ordered using the <Move Up/Move Down> buttons.
|
Select Columns |
|
|---|---|
|
Number |
Number of the event as assigned online as events are fired. |
|
Description |
The description of the event as entered in the I/O Driver - Event Output setup dialogs. |
|
Line Name |
Name of the line which was used as the mainline during recording of the event. |
|
Time / End Time |
Start and end time of the event. |
|
Abbreviation |
The abbreviation of the event as entered in the I/O Driver - Event Output setup dialogs. |
|
Code |
The code of the event as entered in the I/O Driver Editor - Event Output setup dialogs. |
|
Comment |
If a 'Comment' property has been assigned to an event when defining it in the I/O Driver Editor (Event Properties - Type tab), any text added when the event is fired online is shown in this column of the Event Editor. |
|
Length / Width / Height |
Dimensions of the event. |
|
Location |
Location of the event. |
|
DOL |
Distance Off Line of the selected node. |
|
Easting / Northing |
Coordinates of the selected node. |
|
Longitude / Latitude |
Coordinates of the selected node. |
|
Date |
Recording date. |
|
Duration |
Length of time the event took place. |
|
<Show All> |
Show all columns in the Data View and in the Report View. |
|
<Hide All> |
Show no columns at all in the Data View and in the Report View.
|
|
<Move Up/Move Down> |
Use these buttons to move columns in the left pane.
|
|
<OK> |
Close this dialog, saving the changed settings. |
|
<Cancel> |
Close this dialog without applying the changed settings. |
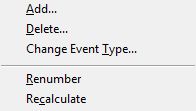
Editor - Events Menu
|
Events |
|
|---|---|
|
Add |
Add a new event.
|
|
Delete |
Delete a highlighted event from the list. |
|
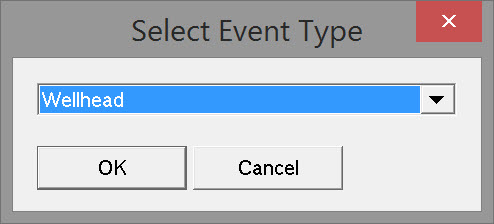
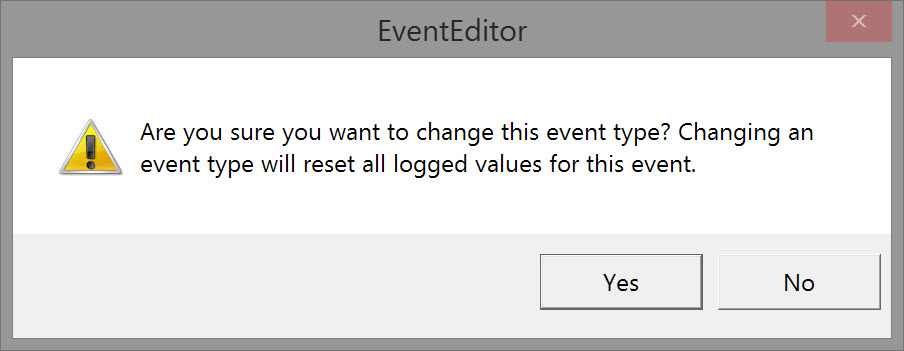
Change Event type |
Change the type of event.
A pop-up message warns of the consequences of editing: |
|
Renumber |
After adding or deleting events it might be useful to renumber the events starting from 1 again. |
|
Recalculate |
Line offsets and positions of events are recalculated based on the selected Adjustment and Node in the toolbar of the editor.
|
Editor - Tools Menu
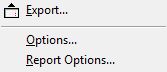
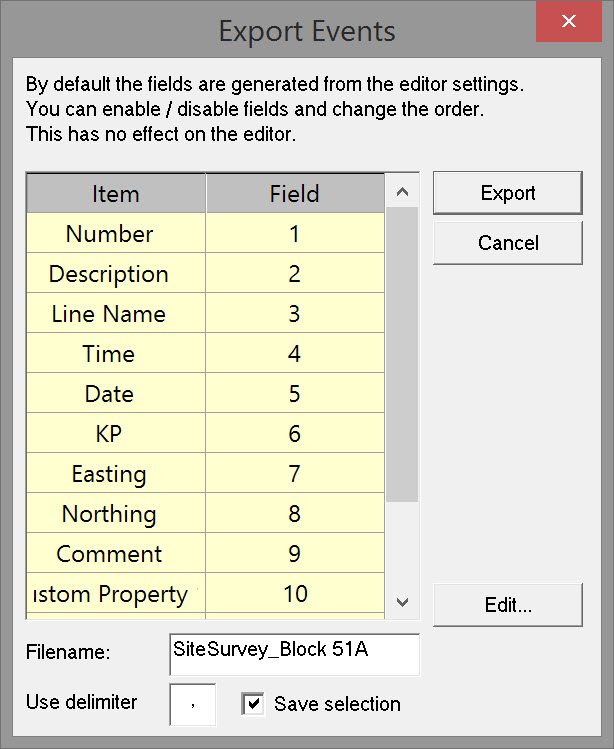
Export
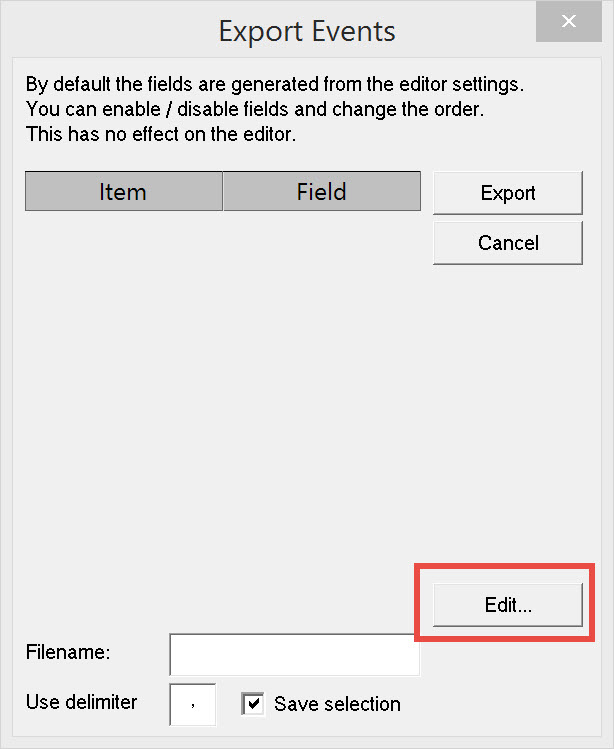
Start by using the <Edit> button to select which items to export.
In the Select Columns window check the columns for export in the left pane. Checked columns are listed in the right pane.
Change the order of columns using the Move Up/Down buttons:
Selections are listed back in the Export Events window:
|
Export |
|
|---|---|
|
Item |
Items from the Select Columns window as found under the View menu. |
|
Field |
Position of the item in the exported file. |
|
<Export> |
Export events to a text file |
|
<Cancel> |
Leave this menu without exporting anything. |
|
<Edit> |
Set the items and the order of the items to be exported.
View menu. |
|
Filename |
Enter the file name for the export file. The file will be stored in the Export folder of the current Qinsy Project. |
|
Use delimiter |
Enter the delimiter which will be used between the fields in the export file. |
|
Save selection |
The settings entered in this dialog will be stored for future export actions. |
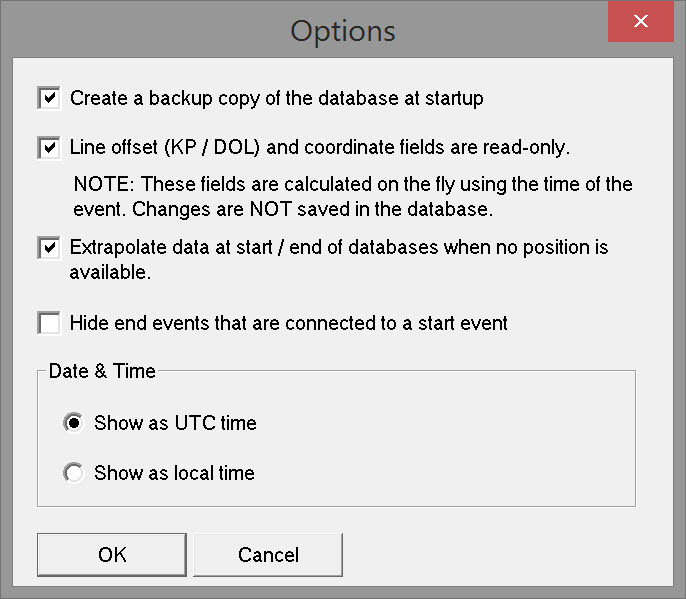
Options
|
Options |
|
|---|---|
|
Create a backup |
A copy is made of the original database. '_Backup' is added to the original file name.
|
|
Fields read-only |
When this option is ticked it is not possible to edit line offsets and coordinate fields. |
|
Extrapolate data |
Extrapolate positions in case the last event occurred after the last position update. |
|
Hide end events |
End events connected to a start event will not be shown when this option is ticked. |
|
Date and Time |
Select how the times in the editor should be displayed, either in UTC time or in local time. |
|
<OK> |
Close this dialog, saving the changed settings. |
|
<Cancel> |
Close this dialog, not saving the changed settings. |
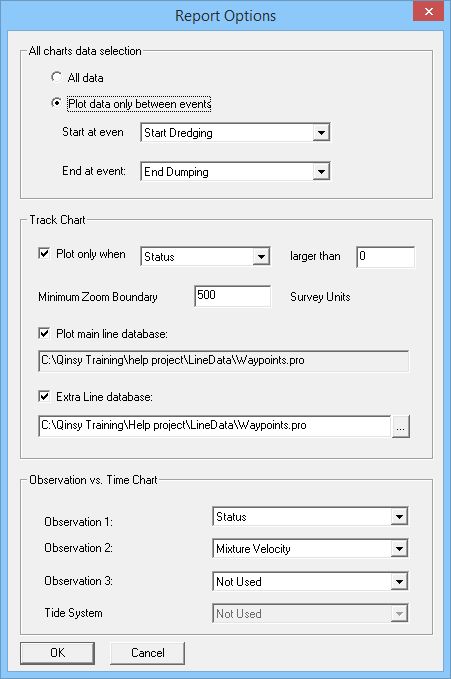
Report Options
Select the part of the data used to generate the report.
|
All charts data selection |
|
|---|---|
|
All data |
All available data is used in the report. |
|
Plot data only between events |
A selection of events will be used in the report. Choose a Start and End event in the lines below. |
|
Start at event |
Select an event from the drop down menu which lists all the events in the *.xml file. |
|
End at event |
Select an event from the drop down menu which lists all the events in the *.xml file. |
|
Track Chart |
|
|
Plot only when |
If necessary, set limits to what will be used for the Track chart in the report. Select an observation from the drop down menu. |
|
Larger than |
Enter a limit for plotting the observation. |
|
Minimum Zoom Boundary |
Enter which area will be shown in the track chart. |
|
Plot main line database |
Select to plot the database which contains the mainline used during recording. |
|
Extra Line database |
If necessary, set which database contains the extra lines used during this survey. |
|
Observation vs Time Chart |
Select the observations to be drawn in a time-plot graph in the report. |
|
Observation 1, 2, 3 |
Select an observation from the drop down menu. |
|
Tide System |
If a tide system was used during recording, it can be selected from the drop down menu. |
|
<OK> |
Close this dialog, confirming all settings. |
|
<Cancel> |
Close this dialog, leaving all settings as they were. |
View Menu - Show Report
By using the menu View\Show Report you can switch to the so-called Report View.
Select the correct report option to display graphics, etc.
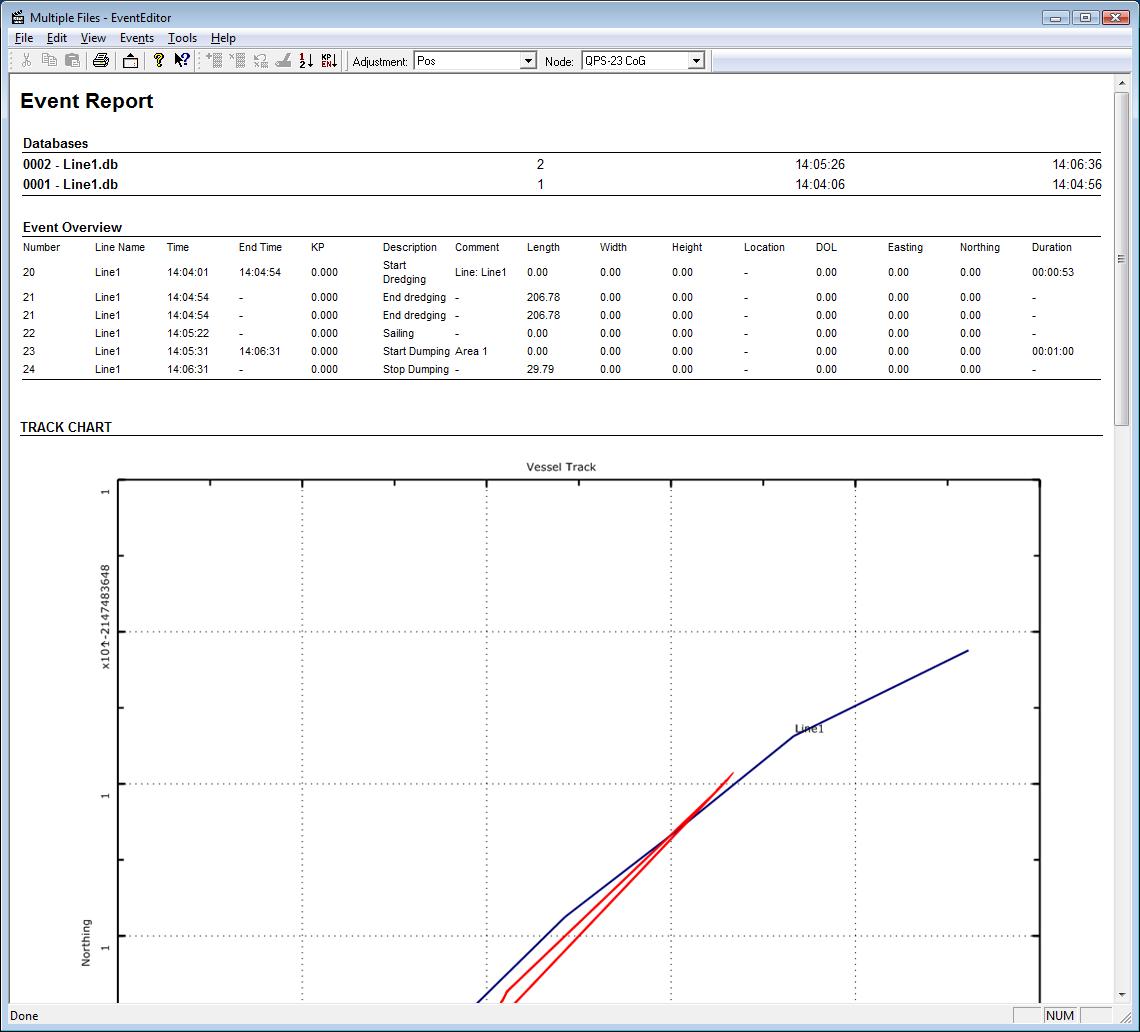
This report can be printed or saved to html. If saved to html then it can be viewed and printed with the Internet Explorer.
Return to: How-to Eventing